HAL Id: hal-00688006
https://hal.archives-ouvertes.fr/hal-00688006
Submitted on 30 Oct 2020
HAL is a multi-disciplinary open access
archive for the deposit and dissemination of
sci-entific research documents, whether they are
pub-lished or not. The documents may come from
teaching and research institutions in France or
abroad, or from public or private research centers.
L’archive ouverte pluridisciplinaire HAL, est
destinée au dépôt et à la diffusion de documents
scientifiques de niveau recherche, publiés ou non,
émanant des établissements d’enseignement et de
recherche français ou étrangers, des laboratoires
publics ou privés.
Distributed under a Creative Commons Attribution - NoDerivatives| 4.0 International
variability of particulate matter, as seen from scattering
and backscattering coefficients, in ultra-oligotrophic
eddies of the Mediterranean Sea
Hubert Loisel, Vincent Vantrepotte, K. Norkvist, Xavier Meriaux, M.
Kheireddine, J. Ras, Mireille Pujo-Pay, Y. Crombet, Karine Leblanc, G.
Dall’Olmo, et al.
To cite this version:
Hubert Loisel, Vincent Vantrepotte, K. Norkvist, Xavier Meriaux, M. Kheireddine, et al..
Characteri-zation of the bio-optical anomaly and diurnal variability of particulate matter, as seen from scattering
and backscattering coefficients, in ultra-oligotrophic eddies of the Mediterranean Sea. Biogeosciences,
European Geosciences Union, 2011, 8, pp.3295-3317. �10.5194/bg-8-3295-2011�. �hal-00688006�
doi:10.5194/bg-8-3295-2011
© Author(s) 2011. CC Attribution 3.0 License.
Characterization of the bio-optical anomaly and diurnal variability
of particulate matter, as seen from scattering and backscattering
coefficients, in ultra-oligotrophic eddies of the Mediterranean Sea
H. Loisel1, V. Vantrepotte1, K. Norkvist1, X. M´eriaux1, M. Kheireddine2, J. Ras2, M. Pujo-Pay3,4, Y. Combet5, K. Leblanc5, G. Dall’Olmo6, R. Mauriac7, D. Dessailly1, and T. Moutin61INSU-CNRS, UMR 8187, LOG, Laboratoire d’Oc´eanologie et des G´eosciences, Universit´e Lille Nord de France,
ULCO, 32 avenue Foch, 62930 Wimereux, France
2INSU-CNRS, LOV, Lab. d’Oc´eanographie de Villefranche, UMR 7093, Universit´e Paris VI, Villefranche sur mer, France 3INSU-CNRS, UMR 7621, LOMIC, Laboratoire d’Oc´eanographie Microbienne, Observatoire Oc´eanologique,
66650 Banyuls/mer, France
4UPMC Univ Paris 06, UMR 7621, LOMIC, Laboratoire d’Oc´eanographie Microbienne, Observatoire Oc´eanologique,
66650 Banyuls/mer, France
5INSU-CNRS, UMR 6535, LOPB, Laboratoire d’Oc´eanographie Physique et Biog´eochimique, Universit´e de la M´editerran´ee,
Centre d’Oc´eanologie de Marseille, Campus de Luminy Case 901, 13 288 Marseille cedex 9, France
6Plymouth Marine Laboratory, Prospect Place, The Hoe, Plymouth, PL1 3DH, UK
7INSU-CNRS, UMR 6535, LOPB, Laboratoire d’Oc´eanographie physique et biog´eochimique Universit´e de la M´editerran´ee,
Centre d’Oc´eanologie de Marseille, Campus de Luminy Case 901, 13 288 Marseille cedex 9, France
Received: 31 July 2011 – Published in Biogeosciences Discuss.: 8 August 2011
Revised: 27 October 2011 – Accepted: 28 October 2011 – Published: 14 November 2011
Abstract. The variability of inherent optical properties is
investigated in the ultra-oligotrophic waters of the Mediter-ranean Sea sampled during the BOUM experiment per-formed during early summer 2008. Bio-optical relationships found for ultra-oligotrophic waters of the three anticyclonic gyres sampled significantly depart from the mean standard relationships provided for the global ocean, confirming the peculiar character of these Mediterranean waters. These op-tical anomalies are diversely related to the specific biolog-ical and environmental conditions occurring in the studied ecosystem. Specifically, the surface specific phytoplankton absorption coefficient exhibits values lower than those ex-pected from the general relationships mainly in relation with a high contribution of relatively large sized phytoplankton. Conversely, the particulate backscattering coefficient, bbp,
values are much higher than the mean standard values for a given chlorophyll-a concentration, TChl-a. This feature can presumably be related to the relevant influence of highly re-fractive submicrometer particles of Saharan origin in the sur-face layer of the water column. The present measurements
Correspondence to: H. Loisel
(hubert.loisel@univ-littoral.fr)
also show that the Mediterranean Sea is greener than
TChl-a alone indicates, as already stressed in previous studies. This color anomaly is partly explained by the estimated col-ored dissolved organic matter and submicrometer particles absorption coefficients, and to a greater extent by the high
bbp/TChl-a values assuming that these particles backscatter
light similarly in the green and blue parts of the visible spec-trum. The diel variation of both the particulate matter atten-uation and backscattering coefficients were also investigated specifically. Despite some differences in the timing and the magnitude of the daily oscillations found for these optical parameters, potential for the backscattering coefficient daily oscillation to be used, similarly to that for the attenuation coefficient, as a proxy for estimating carbon community pro-duction budget has been highlighted for the first time. This result is particularly relevant for present and future geosta-tionary spatial ocean color missions.
1 Introduction
In situ and remote sensing measurements of inherent opti-cal properties (IOPs) in natural waters provide essential in-formation to infer biogeochemical stocks and processes at
different temporal and spatial scales (Smith and Baker, 1978; Nelson et al., 1998; Stramski et al., 1999; Oubelkheir et al., 2005; Boss et al., 2007; Vantrepotte et al., 2011). Gen-eral bio-optical relationships have long been established be-tween these IOPs and some biogeochemical parameters, such as the chlorophyll-a concentration, Chl-a, and particulate organic carbon, POC, in open ocean waters (Gordon and Morel, 1983; Yentsch and Phinney, 1989; Bricaud et al., 1995; Oubelkheir et al., 2005; Gardner et al., 2006; Huot et al., 2008). These relationships can then be used to as-sess the variability of the latter biogeochemical parameters from field or remote sensing measurements. The universal (i.e. global) status of these relationships can only be stated by characterizing and understanding the variability around these averaged laws which describe the mean trends observed be-tween the IOPs and the biogeochemical parameters concen-tration. At first order, the IOPs variability is driven by the concentration of the optically significant material present in the water masses. For instance, robust statistical relation-ships (Loisel and Morel, 1998; Bricaud et al., 1998) have been established between the particulate attenuation, cp, and
absorption, ap, coefficients with Chl-a over the whole trophic
range (covering about three orders of magnitude). The bio-optical characteristics of the particulate and dissolved matter, as well as the respective proportion between these different optically active pools, drive the natural variability observed around the averages relationships between IOPs and biogeo-chemical parameters. Here we examine the IOPs variability for ultra-oligotrophic waters of the Mediterranean Sea sam-pled in the frame of the BOUM (Biogeochemistry from the Oligotrophic to the Ultra-oligotrophic Mediterranean) cruise carried out in early summer, June–July 2008 (Moutin et al., 2011).
While numerous field measurements were acquired to es-tablished bio-optical relationships representative of the open ocean (see Morel, 2009 and references therein), in situ mea-surements performed in ultra oligotrophic waters (i.e. Chl-a lower than about 0.05 mg m−3)are still very scarce. This is particularly true for the particulate backscattering coeffi-cient, bbp, which has been rarely measured in oligotrophic
waters. Recent bio-optical relationships (Huot et al., 2008; Bricaud et al., 2010) were however established, thanks to the large trophic gradient covered in the frame of the BIOSOPE cruise which was carried out in the eastern South Pacific Ocean (Claustre et al., 2008). Compared to the South Pacific gyre system, where ultra ologotrophic waters were sampled during BIOSOPE, the Mediterranean Sea waters and their associated bio-optical relationships can be affected by conti-nental inputs such as rivers discharge and desert dust events. Different studies have already stressed the marginal charac-ter of this semi enclosed sea at a bio-optical point of view (Gitelson et al., 1996; D’Ortenzio et al., 2002; Claustre et al., 2002; Bricaud et al., 2002; Morel and Gentili, 2009). A higher than expected colored dissolved organic matter content, a presence of coccolithophorids, and Saharan dust
events were advanced to explain the over-estimation, com-pared to the field values, of Chl-a loads retrieved from the standard bio-optical algorithms used to process ocean color data collected from space. The first objective of the present study is to re-examine this well known, but still not fully un-derstood, color anomaly found in ultra-oligotrophic waters of the Mediterranean Sea, with a particular focus on the partic-ulate backscattering coefficient, bbp, which was never
mea-sured during previous studies.
Diel variation in cphas been extensively reported in
var-ious parts of the world oceans and has been used to infer biogeochemical processes such as particles growth rates and productivity (Cullen et al., 1992; Claustre et al., 2008; Marra, 1995; Gardner et al, 1999; Oubelkheir and Sciandra, 2008; Gernez et al, 2011; Dall’Olmo et al., 2011; Walsh et al., 1995). With minima near sunrise and maxima near sun set, the cp diel variations have been mainly attributed to
varia-tions in refractive index and size of phytoplankton cells dur-ing the photosynthetic processes (Stramski and Reynolds, 1993; Durand and Olson, 1998). Note that changes in par-ticles (phytoplankton and heterotrophic bacteria) numerical concentration also contribute to the cpdiel cycle (Oubelkheir
and Sciandra, 2008). Conversely, diurnal cycles in bbp have
not been documented yet and represent therefore the second major objective of the present study. The characterization of the bbp diel cycle is motivated by two major aspects. First,
in the frame of the Mie scattering theory, bbp is mostly
in-fluenced by submicrometer particles, whereas cpis mainly
driven by particles with diameters between 0.5 and 20 µm (Stramski and Kieffer, 1991; Pak et al., 1988). Therefore, the comparison of the respective diel cycles of the two lat-ter optical paramelat-ters could provide complementary infor-mation on related biogeochemical processes. Note, however, that the influence of relatively large phytoplankton cells on
bbp seems to be underestimated from Mie calculations
ac-cording to recent experimental studies (Vaillancourt et al., 2004; Dall’Olmo et al., 2009). Due to the current uncer-tainties regarding the role of sea water constituents in light backscattering processes in the ocean (Stramski et al., 2004), and to the relatively short time series acquired during BOUM (3 days), the present study only represents the first step to-ward the potential use of bbp to assess community
produc-tion loss and gain terms. Second, in contrast to cpwhich
rep-resents the sum of the particulate absorption and scattering coefficients, bbpcan be assessed from space with a satisfying
accuracy (IOCCG, 2006). Recently launched (GOCI, Ges-tationary Ocean Color Imager, KORDI) and planed (GEO-OCAPI, CNES; HR-GEO, ISRO) geostationary spatial ocean color instruments will provide new opportunities to infer bio-geochemical processes from space with an increased tempo-ral resolution and provide new insights on biogeochemical fluxes. In that context, a better understanding of bbpdiel
Figure 1.
Fig. 1. Transect performed during the BOUM cruise (16 June–20
July 2008). Short duration (SD) stations are reported as blue dots while long duration (LD) stations sampled in the centre of anticy-clonic eddies for a time period of 3 days are reported as red dots (namely stations A, B and C).
2 Materials and methods 2.1 Sampling strategy
The BOUM cruise took place during summer 2008 (from 16 June to 20 July in the Mediterranean Sea and consisted of a 3000 km transect from the Rhone river mouth (west-ern Mediterranean) to the Eratosthenes sea mount (east(west-ern Mediterranean, Fig. 1). Along this transect, two kinds of sta-tions were sampled: “short duration” (SD) and “long dura-tion” (LD) stations (27 and 3 stations respectively, Fig. 1). Surface to bottom measurements were performed at each SD station distant of around 60 miles of each other. The 3 LD stations (A, B, C) were located in the centre of anticyclonic eddies, approximately determined from satellite imagery and MERCATOR forecast and accurately located on board using hydrologic and hydrodynamic data (i.e. XBT, thermosalino-graph and ADCP measurements). The latter fixed stations were sampled at high frequency (every 3 h) for 3 days in or-der to study the diurnal cycle of various biogeochemical and optical parameters. Basic measurements consisted of CTD vertical profiles (0–500 m). In addition, discrete Niskin bot-tles samples were taken at different depths of the water col-umn. It is noteworthy that hydrodynamic conditions for the LD fixed stations remained stable all along the sampling time period (Moutin et al., 2011).
2.1.1 Biogeochemical parameters
Photosynthetic pigment (including total
chlorophyll-a, TChl-a = chlorophyll-a + divinyl
chlorophyll-a+ chlorophyllide-a mg m−3)concentrations were measured at discrete depths collected from Niskin bottles (1 to 2.5 L) by High Performance Liquid Chromatography (HPLC) fol-lowing the methodology described in Ras et al. (2008). The relative proportion of pico-, nano- and microphytoplankton was computed using the chemotaxonomic pigment ratios described in Vidussi et al. (2001) recently updated by Uitz
et al. (2006). Note that only one vertical profile of HPLC measurements is available at each long duration station.
Particulate organic carbon, POC, (in µg l−1)was collected
on precombusted (24 h, 450 C) glass fiber filters (Whatman GF/F, 25 mm). Filters were dried in an oven at 50◦C and stored, in ashed glass vial and in a dessicator until analyses when return from the cruise, on a CHN Perkin Elmer 2400.
For Lithogenic silica, LSi, between 1 and 2.3 l of seawa-ter were filseawa-tered onto 47 mm 0.6 µm PC filseawa-ters. Filseawa-ters were folded and stored in a plastic Petri dish, oven dried (60◦C) for 24 h and then stored at room temperature until analyses at the laboratory. Filters were analyzed for LSi following the HF digestion technique described by Nelson et al. (1989).
2.1.2 Optical measurements Remote sensing reflectance
Hyperspectral radiometric measurements (3 nm resolution) were performed in the 350–750 nm spectral range with two TriOS radiometers. The first radiometer was fixed on the deck and measured the above-surface downward irradiance,
Ed(0+, λ), where λ is the wavelength of light in nanome-ters (nm). The second radiometer recorded the upward ra-diance profile in the water column, Lu(z, λ).
Remote-sensing reflectance, Rrs(λ), was then calculated from the in-water method, following the protocols prescribed by Mueller (2003):
Rrs(λ) = Lw(λ)/Ed(0+,λ) (1) where Lw(λ) is the water leaving radiance which is
calcu-lated from the upwelling radiance just below the sea surface estimated from the Lu(z, λ) vertical profile. A full
descrip-tion of the radiometric data processing is given by Lubac and Loisel (2007).
Chlorophyll fluorescence
Continuous profiles of chlorophyll fluorescence were mea-sured using a Chelsea Aquatracka III fluorometer and was calibrated to TChl-a concentration using HPLC pigment measurements. In practice, a calibration was made for each LD stations, by linear regression of fluorescence on
TChl-a from each LD stations profiles and from the nearest tran-sect casts. Calibration relationships slightly differ from one LD station to another due to variation in the phytoplank-ton community and physiological state (station A:
TChl-a = 2.5263 fluo + 0.0038, r2=0.9683, N = 89; station B: TChl-a = 2.3575 fluo + 0.0059, r2=0.9771, N = 30; station C: TChl-a = 3.0638 fluo −0.0097, r2=0.9812, N = 30).
Backscattering coefficient
The particulate backscattering coefficient, bbp(λ), is
size distribution, and usually dominates the backscattering in coastal waters. However, in open ocean waters the backscat-tering of pure seawater, bbw(λ), is significant, and uncertain-ties in this term have a large impact when computing the particulate component (Twardowski et al., 2007). Vertical profiles of the scattering coefficient at 650 nm and three an-gles, 100◦, 125◦and 150◦were performed with a WET Labs ECO-VSF meter during LD stations only. Because of the very oligotrophic conditions encountered during the cruise, which push backscattering measurements near to their limit, dark current measurements were performed in the dark sev-eral times during the cruise using a neoprene black cape to cover the instrument window. The obtained values are very similar to those measured before the cruise during the cal-ibration phase at the factory (WET Labs), emphasizing no electronic drift of this parameter. Integration and extrapola-tion of the measured signal from 90◦to 180◦yield the total
backscattering coefficient, bb(650), after correction for the
loss of photons along the path due to absorption by partic-ulate and dissolved material (Loisel et al., 2007). The par-ticulate backscattering coefficient, bbp(650), is then obtained
by correcting the signal for backscattering by pure seawater as described in Loisel et al. (2007). The theoretical model by Zhang et al. (2009) was used to correct for the scattering by pure seawater while absorption correction was performed using in situ discrete measurements.
Beam attenuation coefficient
Profiles of beam transmission at 650 nm were measured by a WET Labs Cstar transmissiometer with a 25 cm pathlength at all stations. Data were processed to give the beam attenuation coefficient, c(650), for sea water, expressed in m−1. In or-der to get the attenuation coefficient for suspended particles,
cp(650), the contribution from pure seawater has to be
sub-tracted to c(650). Instead of using the factory calibration, the mean c(650) value measured between 350 and 400 m depth was subtracted from each profile since at these depths, the very low particle concentration induces c(650) values very close to the value for particle-free water. This approach, de-scribed by Loisel and Morel (1998), presents the advantage of accounting for the effects of instrumental drift and varying cleanliness of the optical windows. Theoretically, cp(650)
represents the sum of absorption and scattering coefficients, but in practice at 650 nm it can be assumed that cp(650)
cor-responds to the particle scattering coefficient bp(650) due to
very low particulate absorption in the red part of the spec-trum, especially for the oligotrophic waters sampled during BOUM (Loisel and Morel, 1998).
Absorption coefficient
The total particulate absorption coefficient, ap(λ), is the sum
of the phytoplankton absorption coefficient, aph(λ), and the
absorption coefficient by non-pigmented particles, anap(λ). Water samples were taken at 5 m depth and close to the DCM (Deep Chlorophyll Maximum) during the diel cycle casts. Samples were stored in a cool and dark compart-ment until filtration, at most 6 h after collection. Depend-ing on particle content, a volume of 2.8 to 5.6 l was filtered onto 25 mm pre-combusted Whatman GF/F filters, immedi-ately put in liquid nitrogen and stored at −80◦C until anal-ysis in the laboratory within two months of sampling. Note that precombustion shrinks the pore size of the GF/F filters for which it is initially assumed that particles with diame-ter greadiame-ter than 0.5–0.7 mm are retained before shrinking. A Cary 100 UV/VIS double-beam spectrophotometer was used for the analysis. The total Optical Density of the particles on the filter, ODfp(λ), was measured between 300–900 nm. Due to high instrumental noise in the upper and lower ends of the spectrum, only measurements in the range 350–850 nm were used for further analysis. The absorption coefficient ap(λ)
(m−1)is computed as
ap(λ) = 2.303Af/βVf[ODfp(lλ) −ODbf(λ) −ODnull] (2)
where ODbf(λ)is the optical density of a hydrated blank filter and ODnullis a residual correction from the infrared spectrum
where particle absorption is minimal. When a double-beam spectrometer with automatic baseline correction is used, with a blank filter in one of the filter holders, ODbfdoes not need
to be subtracted during the processing. ODnullis computed
as the mean ODfp(λ)in the interval 790–800 nm. Light
scat-tering within the filter increases the absorption pathlength, and the absorption coefficient must be corrected for this path-length amplification. The pathpath-length amplification factor β is calculated as
β = [C1+C2[ODfp(λ) −ODnull]]−1 (3)
The pathlength amplification varies with phytoplankton com-munity and especially cell size. The coefficients C1and C2
were set to 0.359 and 0.390, respectively. These values were obtained from Bricaud et Stramski (1990). Once the ODfp(λ)
has been measured, the pigments are extracted in methanol as described in (Mitchell et al., 2003), and ODfd(λ)is
mea-sured. anap(λ)is calculated in the same way as ap(λ),
replac-ing ODfp(λ)with ODfnap(λ)in Eq. (2). The phytoplankton
absorption aph(λ)is then computed as ap(λ) − anap(λ).
2.1.3 Ancillary parameters
Continuous PAR measurements were recorded on board (1 measure each 30 s). In addition, vertical profile of PAR were measured at each station (short and long duration) allowing to compute the euphotic depth (Zeu: depth where the PAR is equal to 1 % of its surface value). The mixed layer depth, MLD, is taken from Moutin et al. (2011) as the MLD 2 days lagged (see their Table 1a).
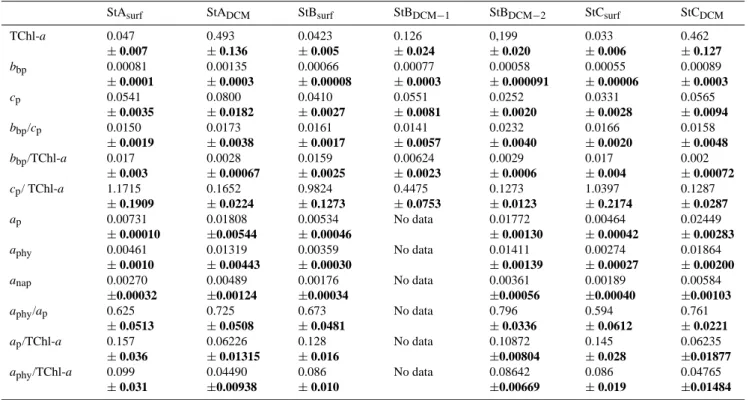
Table 1. General bio-optical characteristics of the surface water and at the deep chlorophyll maximum (DCM) at the long duration stations A,
B, and C. The values in standard font and bold represent the mean and standard deviation values, respectively. The particulate backscattering (bbp)and attenuation (cp)coefficients values are given 650 and 660 nm, respectively. The absorption coefficients values are given at 440 nm.
The subscripts p, phy, and nap stand for particulate, phytoplankton, and non-algal particles, respectively.
StAsurf StADCM StBsurf StBDCM−1 StBDCM−2 StCsurf StCDCM
TChl-a 0.047 ±0.007 0.493 ±0.136 0.0423 ±0.005 0.126 ±0.024 0,199 ±0.020 0.033 ±0.006 0.462 ±0.127 bbp 0.00081 ±0.0001 0.00135 ±0.0003 0.00066 ±0.00008 0.00077 ±0.0003 0.00058 ±0.000091 0.00055 ±0.00006 0.00089 ±0.0003 cp 0.0541 ±0.0035 0.0800 ±0.0182 0.0410 ±0.0027 0.0551 ±0.0081 0.0252 ±0.0020 0.0331 ±0.0028 0.0565 ±0.0094 bbp/cp 0.0150 ±0.0019 0.0173 ±0.0038 0.0161 ±0.0017 0.0141 ±0.0057 0.0232 ±0.0040 0.0166 ±0.0020 0.0158 ±0.0048 bbp/TChl-a 0.017 ±0.003 0.0028 ±0.00067 0.0159 ±0.0025 0.00624 ±0.0023 0.0029 ±0.0006 0.017 ±0.004 0.002 ±0.00072 cp/ TChl-a 1.1715 ±0.1909 0.1652 ±0.0224 0.9824 ±0.1273 0.4475 ±0.0753 0.1273 ±0.0123 1.0397 ±0.2174 0.1287 ±0.0287 ap 0.00731 ±0.00010 0.01808 ±0.00544 0.00534 ±0.00046 No data 0.01772 ±0.00130 0.00464 ±0.00042 0.02449 ±0.00283 aphy 0.00461 ±0.0010 0.01319 ±0.00443 0.00359 ±0.00030 No data 0.01411 ±0.00139 0.00274 ±0.00027 0.01864 ±0.00200 anap 0.00270 ±0.00032 0.00489 ±0.00124 0.00176 ±0.00034 No data 0.00361 ±0.00056 0.00189 ±0.00040 0.00584 ±0.00103 aphy/ap 0.625 ±0.0513 0.725 ±0.0508 0.673 ±0.0481 No data 0.796 ±0.0336 0.594 ±0.0612 0.761 ±0.0221 ap/TChl-a 0.157 ±0.036 0.06226 ±0.01315 0.128 ±0.016 No data 0.10872 ±0.00804 0.145 ±0.028 0.06235 ±0.01877 aphy/TChl-a 0.099 ±0.031 0.04490 ±0.00938 0.086 ±0.010 No data 0.08642 ±0.00669 0.086 ±0.019 0.04765 ±0.01484 2.2 Production model
Diel variation in the POC estimates obtained from cpcan be
used to assess various terms of a production budget including gross community production, community losses or net com-munity production rates following the method documented by Claustre et al. (2008). This method is also applied here for bbp.
For a given ocean layer, the gross community pro-duction derived from optical measurements (OptGCP in mg C m−2d−1)is the sum of the gross primary and microbial productions. It can be assessed by estimation of the increase in POC content during daytime (D1POC). In practice:
OptGCP = D1POC/Dt (4)
where Dt is equal to the day time duration corresponding to each day sampled. In practice we considered the difference between minimum and maximum POC values for the calcu-lation of the later biogeochemical rates rather than the ac-tual POC values corresponding to the sunlight diel evolution (see in Sect. 3.4). Similar estimation of the Net Community Production (OptNCP in mg C m−2d−1) and of the commu-nity losses (OptCL i.e. respiration and other processes such as grazing and sinking) can be performed following the POC
evolution during nighttime, however the latter are not con-sidered for this study due to the absence of concurrent esti-mation of these biogeochemical rates from classical methods prevailing any validation of the derived estimates.
3 Results and discussion
3.1 Vertical distribution of the particulate matter 3.1.1 Vertical profile of fluorescence and
pigment-derived phytoplankton size classes
Vertical profiles of the total chlorophyll-a concentration, TChl-a, estimated from in situ fluorescence calibrated us-ing discrete HPLC measurements (see material and method), present a general feature typical of oligotrophic conditions. A deep chlorophyll maximum is found within the stratified part of the water column (Fig. 2a, c, e). This maximum is observed at 85 and 110 m for the A and C long duration sta-tions, respectively. These water depths roughly correspond to the depths of the euphotic zone (83 m for A, and 102 m for C) and are slightly deeper than the top of the nitricline which were observed at 72, and 93 m, respectively (Moutin et al., 2011). These results are in good agreement with previous
studies performed in oligotrophic areas (Moutin and Raim-bault, 2002; Marty et al., 2002; Letelier et al., 2004; Uitz et al., 2006). The TChl-a values at the DCM are 0.49 and 0.46 mg m−3which, compared to their surface values, corre-spond to an increase in TChl-a with depth by a factor of 10.5 and 14, respectively. In contrast to these two stations, the TChl-a profile at station B is characterized by two unusual maxima (75 and 140 m) which are located above the euphotic depth (104 m) and below the top of the nitricline (114 m). Note that these TChl-a values slightly differ from the one reported in Moutin et al. (2011) who used a single parame-terization to convert the in situ fluorescence signal in terms of TChl−a for the three profiles measured at the LD stations A, B and C, while different parameterizations were used for each LD station in the present manuscript. The surface
TChl-aconcentration at station B is equivalent to those of stations A and C, but increases only by a factor of 3 and 4.7 from the surface to the first and second maximum, respectively. Chl-a concentration as measured from HPLC does not change be-tween 75 and 150 m (= 0.0845 ± 0.0062 mg m−3), whereas Divinyl-chlorophyll-a presents a peak at 124 m (Fig. 2c). As already discussed in several papers, the DCM is partly ex-plained by an intracellular increase in Chl-a (Kiefer et al., 1976; Cullen, 1982). Indeed, the phytoplankton commu-nity physiologically adapts to the low irradiance level (the so called photoacclimation process), and to the vicinity of the top of the nitricline. The recent development of appropriate in situ instrumentation to characterize the vertical profile of marine particles also highlights that phytoplankton cells can play, through photoadaptation process, an important role in this vertical feature (Oubelkier and Sciandra, 2008; Grob et al., 2007). For instance, cytometry measurements performed in the Ionian Sea show a maximum of picophytoeukaryotes in the 50–90 m layer, with a deep chlorophyll maximum lo-cated at 90 m (Oubelkier and Sciandra, 2008). In the same way, a deep picophytoeukaryotes maximum was recorded in the deep chlorophyll maximum at the center of the South Pa-cific gyre (Grob et al., 2007).
Vertical profiles of pigment-derived phytoplankton size classes as proposed by Claustre (1994) and Vidussi et al. (2001) and recently improved by Uitz et al. (2006) re-veal a change in the phytoplankton community structure over the water column (Fig. 2b, d, f). Within the surface layer, the biomass in terms of TChl-a, is dominated by nano-phytoplankton, with a proportion of 68 %, 55 %, and 60 % at stations A, B, and C, respectively. The proportion of nano-phytoplankton then decreases from the surface to the deep chlorophyll maximum, from where it starts increasing. The phytoplankton community structure is equally dominated by pico and nano -phytoplankton at the DCM for stations A and C. This is in agreement with cytometry counting and micro-scopic identification (Mauriac et al., 2011). At station B, while the first DCM shows more nano-phytoplankton (52 %) than pico-phytoplankton (35 %), the second DCM is mainly dominated by pico-phytoplankton (65 %). This diversity in
Figure 2.
Fig. 2. Vertical profiles of calibrated fluorescence performed during
the whole time period of sampling at the long duration stations A
(a), B (c), and C (e), together with the discrete measurements of
chlorophyll-a and divinyl chlorophyll-a performed by HPLC (see text). Vertical profiles of the relative proportion of pico-, nano- and microphytoplankton at the long duration stations A (b), B (d), and C (f). The depth of the euphotic zone, Zeu, and the lower limit of the mixed layer, MLD, are indicated.
the phytoplankton assemblages at the two DCM of station B which are characterized by the same Chl-a (as measured by HPLC) could explain the difference observed in the fluores-cence peak intensity.
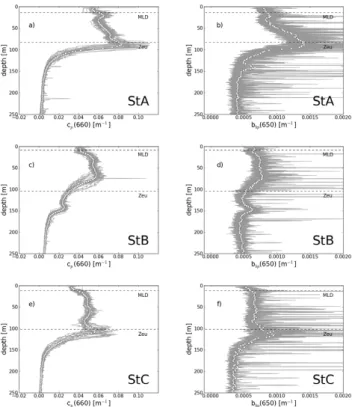
3.1.2 Vertical profiles of particulate attenuation and backscattering coefficients
Particulate attenuation (Fig. 3a, c, e) and backscattering (Fig. 3b, d, f) coefficients were also acquired simultaneously to fluorescence profiles. The main vertical patterns observed in the fluorescence profiles are also identified for the cpand bbp ones. In particular, both cpand bbppresent a maximum
located at the DCM, and their value greatly decreases be-low. However, some differences are noticeable. Firstly, while TChl-a sharply increases from the surface to the DCM, this increase is much less pronounced for both cpand bbpat each
long duration stations. For instance, while TChl-a increases by a factor of about 20, cp and bbp only increase by a
fac-tor of 1.9 and 1.6, respectively at station C (Table 1). Sec-ondly, the two TChl-a maxima measured at station B are
Figure 3.
Fig. 3. Vertical profiles of the particulate attenuation coefficient at
660 nm, cp(660), for the LD stations A (a), B (c), and C (e).
Ver-tical profiles of the particulate backscattering coefficient at 650 nm,
bbp(650), for the LD stations A (b), B (d), and C (f). The depth
of the euphotic zone, Zeu, and the lower limit of the mixed layer, MLD, are indicated.
also observable on the cp profiles but their intensity is
re-versed. From the first (z = 75 m) to the second (z = 140 m) peak the cpvalue decreases by a factor of 2.2, whereas TChl-a increases by a factor of 1.6. Thirdly, two cpmaxima (at
22 and 85 m) are also observable at station A, where only one TChl-a maximum is measured. Finally, compared with the fluorescence and particulate attenuation profiles, particu-late backscattering profiles exhibit numerous brief and large spikes, which may be related to the presence of either ag-gregates or zooplankton (Bishop et al., 1999; Gardner et al. 2000).
A combination of vertical profiles of particulate scattering coefficients and fluorescence profiles have previously been used to explain the origin of variability of TChl-a within the whole water column (Kitchen and Zaneveld, 1990; Loisel and Morel, 1998). The cpvs. TChl-a diagrams,
character-ized by a 7-shape, are typical of oligotrophic environments (Fig. 4). Between the surface and the DCM, cp is more
or less constant, and then linearly decreases with TChl-a toward the deeper aphotic level. The horizontal segment observed from surface waters to the DCM illustrates the photoacclimation process responsible for the intraspecific variation in the cellular chlorophyll concentration. The cp
Figure 4.
Fig. 4. cp(660) (left panels) and bbp(650) (right panels) as a
func-tion of TChl-a through the whole water column at stafunc-tions A, B, and C as indicated. The lines drawn with a 1:1 slope correspond to values of the specific particulate attenuation, cp*(= cp/TChl-a), and
backscattering, bbp*(= bbp/TChl-a), coefficients in m2(mg
TChl-a)−1. The depths of the euphotic zone, Zeu, of the lower limit of the mixed layer, MLD, and of the deep chlorophyll maximum, DCM, are indicated. The numerical depth values (e.g. 170, 250, and 200 m) indicate the depth, deeper than the DCM, from which the Log(cp(660)) vs. Log(TChl-a) relationship departs from
linear-ity.
vs. TChl-a linear behavior observed below the DCM can be interpreted as a progressive dilution of the entire particu-late matter assemblage seen by the transmissometer (Loisel and Morel, 1998). Values of the specific particulate coef-ficient, cp*(= cp/TChl-a), vary between about 1 and 0.1 m2
(mg TChl-a)−1 from the surface layer to the DCM for the three long duration stations. The linear trend observed be-low the DCM is characterized by cp* values of 0.1–0.2 m2
(mg TChl-a)−1. These different cp* values are typical of
those found in other oligotrophic environments (Loisel and Morel, 1998; Gardner et al., 2006; Morel et al., 2007).
The two DCMs at station B are also clearly visible on the
cpvs. TChl-a diagram. The photoacclimation of
phytoplank-ton cells is evidenced by the horizontal segment from the sur-face layer to the first DCM, with cp* value decreasing by a
factor of 2 (from 1 to 0.5 m2 (mg TChl-a)−1). Then, while TChl-a increases by a factor of 1.58 between the first and the second DCM, cpdecreases by a factor of 2.2, inducing
cp* to decrease by a factor of about 5. Such high cp*
vari-ability observed over a relatively thin water layer (65 m) may be caused by different factors. The value of cp* at 660 nm,
which is equivalent to bp* (see material and method), is
driven by the scattering cross section of the microbial or-ganisms (function of their refractive index and size distribu-tion), as well as by the relative proportion between detritus and living material. Similarly to stations A and C, this ra-tio decreases from the surface layer to the first and second DCM in station B, in agreement with the evolution of the carbon-to-chlorophyll ratio of phytoplankton cells (Stramski and Reynolds, 1993). Note however that cp increases by a
factor of 1.34 from the surface to the first DCM, probably due to the presence of detritus or other non-pigmented parti-cles, and decreases by a factor of 2.2 between the two DCM due to the adaptation of phytoplankton carbon content to the irradiance level (Table 1).
The two distinct vertical patterns observed for the cp
vs. TChl-a relationship (i.e. the 7-shape) are much less no-ticeable for the particulate backscattering coefficient. The evolution of bbp as a function of TChl-a from the surface
layer to the DCM is nearly similar to that observed below the DCM. In contrast to cp, bbp tends to increase with TChl-a
from the surface to the DCM, especially for stations A and C. While cp* is roughly constant from the DCM to deep waters, bbp* exhibits large variations of similar amplitude for the two oceanic layers located above or below the DCM. Vari-ation of bbp* from 0.003 to 0.01 m2(mg TChl-a)−1is found
within these two oceanic layers, for instance at station A. For the same range of TChl-a, variations in bbp* computed from
Huot et al. (2008)‘s formulation gives 0.002 and 0.005 m2 (mg TChl-a)−1. These values are consistent with the b
bp*
measurements performed around the DCM, but are signifi-cantly lower than those measured within the surface waters (by a factor of 2). The differences observed between the cp
vs. TChl-a and bbp vs. TChl-a vertical patterns certainly
re-flect variation in the sensitivity of bbp and cp regarding the
nature of the whole particulate matter. The origins of these differences are discussed in the following section.
3.2 The bio-optical environment of the particulate matter at the three long duration stations
Relationships between inherent optical properties (IOPs) and biogeochemical parameters are analyzed for the three long duration stations to establish their bio-optical environment, which in turn is compared with standard relationships previ-ously developed for open ocean waters.
The behavior of the particulate, ap(440), and
phytoplank-ton, aphy(440), absorption coefficients are analyzed as a
func-tion of the total chlorophyll-a concentrafunc-tion, TChl-a (Fig. 5). The variation of aphy(440) and ap(440) versus TChl-a from
the surface water to the DCM can be described by the fol-lowing relationships:
aphy(440) = 0.0364 TChl-a0.708(N =125, r2=0.89) (5)
ap(440) = 0.0432 TChl-a0.622(N = 125, r2 = 0.91) (6) where N is the number of samples, and r2 is the determi-nation coefficient. The non-linear character of these two relationships is particularly consistent with previous studies (Yentsch and Phinney, 1989; Bricaud et al., 1995, 1998). Ex-ponents in Eqs. (5) and (6) are relatively close to each other, emphasizing that absorption by non-algal particles is propor-tional to phytoplankton absorption at 440 nm. On average, phytoplankton absorption contributes to 62 ± 5, 67 ± 5, and 59 ± 6 % of the particulate absorption measured at 440 nm in surface waters of LD stations A, B, and C, respectively. These proportions are consistent with previous studies per-formed in the Mediterranean Sea (Bricaud et al., 1998; Oubelkheir et al., 2007). These proportions significantly in-crease around the DCM to reach about 70 % (Table 1). The exponents in equations 5 and 6 are similar to previous find-ings established from large data sets made of in situ measure-ments collected in various oceanic regions (Bricaud et al., 1995, 1998, 2004; Dupouy et al., 2003). For a given chloro-phyll concentration, the values of ap(440) and especially of aphy(440) measured in the surface layer during the BOUM cruise are however lower than the mean values previously published. For instance, the mean specific phytoplankton ab-sorption coefficients, aphy*(=aphy/TChl-a), measured in the
surface layer of station A, is lower by a factor of 1.5 and 1.1 compared to the mean values given in Bricaud et al. (2004) and Bricaud et al. (1995), respectively (see Table 1). How-ever, the aphy* values measured at the three long duration
stations are in the range of the natural variability of aphy*
reported by Bricaud et al. (2004), and very close to the ones measured during the MINOS cruise in the Mediterranean Sea (see their Fig. 2a). For the same TChl-a range (about 0.02– 0.05 mg m−3), the BOUM aphy* values are also in agreement
with those obtained in ultra-oligotrophic waters sampled in the South Pacific Gyre during the BIOSOPE cruise (Bricaud et al., 2010).
The relative low aphyvalues reported in the present study
compared to the values generally adopted in open ocean waters can be explained by a difference in the size struc-ture and accessory pigments of the phytoplankton assem-blage. The phytoplankton size index (SI) values, calculated as in Bricaud et al. (2004), are in the upper limit of the re-ported values by Bricaud et al. (2010) measured in ultra-oligotrophic waters sampled during BIOSOPE. Based on HPLC measurements, the SI (and TChl-a) values at stations A, B, and C are 11.1 (0.06 mg m−3), 11.7 (0.04 mg m−3),
and 7.7 (0.026 mg m−3), respectively. These relatively high
SI values explain the low aphycoefficient through the
pack-aging effect (Morel and Bricaud, 1981). Concerning ac-cessory pigments, while the ratio values of photosynthetic carotenoids, i.e., fucoxanthin, peridinin, 19‘-HF and 19‘-BF; to TChl-a are in the range of expected values, the non photo-synthetic pigments (zeaxanthin, diadinoxanthin, alloxanthin, and β-carotene) to TChl-a ratio values are very low (about
Figure 5.
Fig. 5. Variations of the absorption coefficient of (a) particles, ap(440), and (b) phytoplankton, aphy(440), at 440 nm as a function of
the TChl-a concentration for the surface layer (open circles), and at the DCM (crosses). The solid curves stand for the regression fits corresponding to Eqs. (6) and (5) from measurements performed at the surface and DCM. Previous relationships are also represented as indicated.
0.15–0.33). These two factors (i.e. relatively high SI and low non photosynthetic pigments to TChl-a ratio), which both explain the relatively low aphy values, are consistent with
a significant contribution of nanophytoplankton to the total phytoplankton biomass. The same conclusion was reached by Bricaud et al. (2010) for the phytoplankton absorption measurements performed in the very clear water of the South Pacific Gyre.
The behavior of cp(66w) with Chl-a, and POC has been
studied in various parts of the global ocean for about 3 decades (Gordon and Morel, 1983; Loisel and Morel, 1998; Gardner et al., 1999; Stramska et al., 2005). In contrast, open ocean water field measurements of the particulate backscat-tering coefficient, bbp(66w), are relatively scarce and
re-stricted to few oceanic areas given that the proper in situ commercial instrumentation has been made available only for about a decade (Stramski et al., 1999; Reynolds et al., 2001; Boss et al., 2004; Huot et al, 2008). The first order variability of both cp(66w) and bbp(66w) can be used to
as-sess the concentration of the particulate assemblage. Based on Mie scattering theory, which assumes that suspended par-ticles are homogeneous spheres, more than 80 % of the scat-tering signal is due to particles less than 8 µm in diameter. In contrast, for the same particle size distribution (a Junge type with an exponent of −4), and a mean refractive index rela-tive to water of 1.05 (typical of phytoplankton cells), most of the backscattering signal is caused by particles smaller than about 1 µm (Stramski and Kieffer, 1991; Morel and Ahn, 1991). However, recent fractionation experiments performed in the open ocean (Dall’Olmo et al., 2009) and in coastal wa-ters (Roesler and Boss, 2008) indicate contributions to bbp
from particles larger than 3 µm of 53 ± 7 % (at 470 nm) and about 70 % (at 440 nm), respectively, and much lower contri-butions (10–30 %) from submicron particles. The origin of the bbpsignal is then still controversial and more laboratory
experiments and in situ measurements are needed to explain
the variability observed in the particulate backscattering sig-nal (Stramski et al., 2004).
The (TChl-a, cp)data points obtained at the surface for the long (N = 69) and short (N = 106) duration stations fall within the range of variability obtained over a larger data set (Loisel and Morel, 1998), which covers different oceanic regions, and are in agreement with previous measurements performed in the Mediterranean Sea during the PROSOPE (French acronym for “Productivit´e des Syst`emes Oc´eaniques PElagiques” or “productivity of oceanic pelagic systems” ) cruise in September 1999 (Oubelkheir et al., 2005) (Fig. 6). The standard non-linear behavior of cp(660) with TChl-a is
well characterized from the surface water measurements per-formed at the three LD stations (Fig. 6a):
cp(660) = 0.499TChl-a0.77(N =69, r2 = 0.56) (7) While the exponent 0.77 is remarkably close to the one found in Loisel and Morel (1998) for the upper homogeneous layer of the ocean, the coefficient (0.499) falls above the previously published values. For instance, this coefficient has been fixed at 0.26 from measurements performed within the upper layer of the eastern South Pacific Ocean (Huot et al., 2008), and varies between 0.103 and 0.383 depending on the data set used over different regions of the global ocean (Loisel and Morel, 1998). The relationship described in Eq. (7) is simi-lar to the one established using all the surface measurements performed at short duration stations:
cp(660) = 0.574TChl-a0.81(N =106, r2=0.64) (8) The exponent in Eq. (7) is closer to those obtained in Loisel and Morel (1998) when all pairs of available data are consid-ered (their subset 1 + 2 + 3 in Table 2), and larger to the one obtained when data measured in the north Atlantic ocean are excluded (their Subset. 1). The mean surface specific particu-late attenuation coefficients, cp*(=cp/TChl-a), at stations A,
(mg TChl-a)−1 (Table 1). These values are significantly
higher than those calculated using the mean global relation-ships (Subset. 1 + 2 + 3) of Loisel and Morel (1998) which are 0.71, 0.73, and 0.77 m2(mg TChl-a)−1at stations A, B, and C, respectively. Note that the BOUM surface cp*
val-ues are consistent with those measured in oligotrophic waters sampled during the PROSOPE cruise (Fig. 6a).
A tight relationship is also observed between cpand TChl-aat the DCM (Fig. 6b):
cp(660) = 0.152TChl-a1.08(N =67, r2=0.9) (9)
Note that cpvs. TChl-a relationship is closer to linearity in
the DCM (Eq. 9) than in surface waters (Eq. 7). This rela-tionship is equivalent to the one established for the short du-ration stations (not shown). Compared with surface waters, the variability in cpis more tightly related to that of TChl-a
at the DCM, as stressed by the relatively high determination coefficient found for the latter relationship. The mean spe-cific attenuation coefficient decreases from the surface water to the DCM by a factor of 6.4, 7.7, and 5.2 at stations A, B (second maximum), and C (Table 1).
In situ cpmeasurements have been extensively used to
as-sess the spatio-temporal variability of POC in open ocean waters (Marra et al., 1995; Loisel and Morel, 1998; Claustre et al., 1999; Karageorgis et al., 2008). The conversion factor between cpand POC, namely the attenuation cross section,
depends on the refractive index, particle size distribution, shape and internal structure of the particles in suspension. Despite the large natural variability of these different param-eters, relatively similar relationships have been established between cpand POC in different oceanic regions (Fig. 3c in
Stramska et al., 2005). For the surface waters (Eq. 10) of the BOUM stations, POC is related to cpas follows:
P OC = 404.cp(660) + 29.25(N = 31, r2 = 0.6) (10) This equation was developed using mainly the short stations, since only two POC profiles were measured during each long duration stations. The coefficient 404 is in the range of previ-ously published values used to convert cpinto POC (see
ref-erences in Stramska et al., 2005). The relationship between POC and cppresents much less variability from the surface
layer to the DCM (not shown) than the cpvs. TChl-a
rela-tionship which greatly changes along the water column. This is explained by the fact that the vertical profiles of POC are much more constant than those of TChl-a, as already shown previously (Duforˆet-Gaurier et al., 2010).
The evolution of bbp as a function of TChl-a (Fig. 7)
sig-nificantly differs between surface waters (Eq. 11) and the DCM (Eq. 12):
bbp(650) = 0.00573TChl-a0.67(N =68, r2 = 0.59) (11)
bbp(650) = 0.00197TChl-a0.75(N =66, r2 = 0.75) (12) Similarly to the cpvs. TChl-a relationships established at the
surface and DCM, the exponents in Eqs. (11) and (12) are
relatively similar, but the coefficients sharply decrease from the surface to the DCM. Between these two layers, the spe-cific backscattering coefficients, bbp/TChl-a, decrease by a
factor 3 to 5, depending on the station (Table 1). This verti-cal pattern stresses that the bulk particulate matter is a much more efficient backscatter at the surface than at the DCM for the same TChl-a. Note that the bbp/TChl-a mean values are
remarkably similar between the three long duration stations (Table 1).
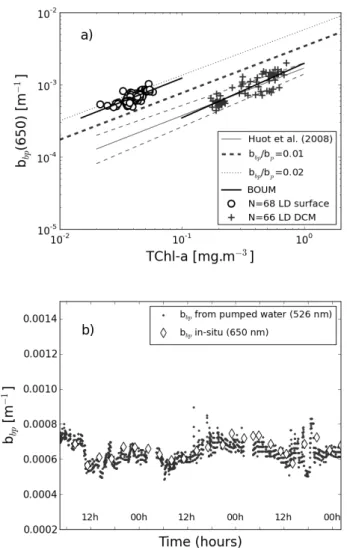
The evolution of bbp as a function of TChl-a established
during the BOUM cruise is compared with the empirical for-mulation documented by Huot et al. (2008), and with the semi-analytical model of Morel and Maritorena (2001). In the latter, the mean formulation used between bpand TChl-a
(Loisel and Morel, 1998) is replaced by the empirical formu-lation developed over the BOUM data set (Eq. 7), and two different values of the backscattering ratio, bbp/bp, are
suc-cessively used: 2 % as in Morel (1988), and 1 % as in Morel and Maritorena (2001) who decreases the Morel (1988)‘s value on the basis of theoretical considerations. The bbp
BOUM parameterization (Eq. 11) follows the same trend with TChl-a compared to the three other models, especially the one developed by Huot et al. (2008) which presents ex-actly the same exponent than in Eq. (11) (Fig. 7a). How-ever, for a given chlorophyll concentration, the bulk par-ticulate matter suspended in the surface water of the long duration stations backscatters light much more efficiently than what is expected for oligotrophic waters. Considering for instance a TChl-a of 0.05 mg m−3, bbp calculated using
Eq. (11) is greater by a factor of 3.3 compared to the value computed using the Huot et al. (2008)‘s model. The disper-sion of the Huot et al. (2008) data points, as represented by their 95 % confidence interval, does even not overlap part of the BOUM data set (Fig. 7a). A relatively good agree-ment can be observed between the BOUM data set and the Morel and Maritorena (2001)‘s model when the greatest par-ticulate backscattering ratio value (2 %) is used and when bp
vs. TChl-a is modeled using Eq. (7) instead of the Loisel and Morel (1998)‘s parameterization which is characterized by a lower bp/TChl-a value (Fig. 7a). However, based on Mie
scattering calculations, it appears that bbp/bpvalue of 2 % is
too high for organic particles, which are predominant in case 1 waters (Ulloha et al., 1994; Morel and Maritorena, 2001). Similar or higher bbp/bpvalues are currently encountered in
coastal areas (Sullivan et al., 2005; Loisel et al., 2007), but have never been measured in open ocean waters, at least in absence of suspended mineral particles from organic (coccol-ithophorids) or inorganic (atmospheric inputs) origin. The reasons of such singular bbp/bp values and bbp vs. TChl-a
relationship are discussed in the next section.
The fact that bbpfollows the same trend with TChl-a than
those described in previous studies for oligotrophic waters gives us confidence in the present data set. However, to be able to faithfully compare the present bbp vs. TChl-a
Figure 6.
Fig. 6. Variations of the particulate attenuation coefficient, cp(660), as a function of the TChl-a concentration for (a) the surface layer, and
(b) at the DCM. The data collected during BOUM at the LD and SD stations, during the PROSOPE cruise, and those gathered by Loisel and
Morel (1998) are plotted as indicated. Nhland Ndlrepresent the number of data available in the Loisel and Morel (1998)‘s data set for the
homogeneous and the deep layers, respectively. The results of the present and previous regression analyses are also plotted as indicated.
processed the data according to the procedure defined by Twardowski et al. (2007) also used in Huot et al. (2008). In their approach, bbp is derived from scattering measurements
performed at one scattering angle (117◦), β(117). Then, bbp
is derived by assuming a conversion factor between bbp and
2πβ(117). This conversion factor is fixed at 0.9, accord-ing to Sulivan et al. (2005). Based on the BOUM data set, the conversion factor between bbp and 2πβ(125) is 1.0086
(r2=0.84). This weak difference may be caused by the fact that the BOUM data set is focused on very clear waters whereas to the data set used in Sulivan et al. (2005) encom-passes measurements performed in coastal areas. By apply-ing the conversion factor used by Twardovski et al. (2007) to our measurements collected at 125◦we obtain higher bbp
values (by about 30 %) than those derived using the scatter-ing measurements at three angles. Therefore, the derivation of the backscattering coefficient from a single angle, as it is done in Huot et al. (2008), would even increase the discrep-ancy observed with their bbpvs. TChl-a parameterization.
Moreover, other bbp measurements were performed
dur-ing the BOUM cruise usdur-ing a quite different protocol (on water continuously pumped from about 9 m below the sea surface) and instrument (an ECO-BB3 WET Lab measuring at 3 wavelengths and at one given angle, 117◦). Particulate backscattering coefficients are calculated as in Dall’Olmo et al. (2009). Only the blue and green channels can be used because the red channel showed significant drifts in the cali-bration coefficients measurements. Comparison between the in situ bbp(650) values and the bbp values obtained from
the measurements performed on pumped waters at 526 nm shows a relatively good agreement (Fig. 7b). So, even if these two sets of bbpmeasurements were acquired at
differ-ent wavelengths and using differdiffer-ent methodologies, the slight differences observed between these two data sets re-enforce our present conclusion about the backscattering anomaly,
and clearly demonstrate that this is not an artifact of the mea-surements.
3.3 The Mediterranean color anomaly as seen during the BOUM cruise
3.3.1 Ocean color anomaly
Remote sensing reflectance measurements performed during the BOUM cruise confirm the unusual bio-optical character of the Mediterranean Sea, as previously stressed in different studies (Gitelson et al., 1996; Claustre et al., 2002; Antoine et al., 2006). The blue-to-green reflectance ratios vs. TChl-a measurements depart significantly from the OC4v4 empiri-cal formulation (O’Reilly et al., 1998) currently used to as-sess TChl-a from the Seaviewing Wide Field-of-view Sensor (SeaWiFS) (Fig. 8). Based on the restricted BOUM radio-metric data set, the OC4v4 algorithm overestimates TChl-a by a factor of two, with a mean ratio of the retrieved-to-in situ TChl-a using OC4v4 of 2.2 ± 0.3. This ratio drops to 0.9 ± 0.2 when using the regional algorithm developed from a data set of reflectance and chlorophyll measurements col-lected during the PROSOPE and AMOFRONT-2 cruises in the Mediterranean Sea (Bricaud et al., 2002). Different as-sumptions were proposed to explain the fact that the Mediter-ranean Sea is greener than TChl-a alone indicates. The pres-ence of phytoplankton cells with a high specific attenuation coefficient, such as coccolithophorids, was suggested to ex-plain the bias observed in ultra oligotrophic waters of the eastern Mediterranean Sea (Gitelson et al., 1996). In contrast to this assumption based on a specific phytoplankton nature, the presence of submicron Saharan dust in suspension within the upper layer was advanced by Claustre et al. (2002) to explain the enhanced absorption in the blue as well as the enhanced backscattering in the green part of the visible spec-trum, which tend to decrease the blue-to-green reflectance
Figure 7.
Fig. 7. (a) Variations of the particulate backscattering coefficient,
bbp(660), as a function of the TChl-a concentration for the
sur-face layer (cross), and at the DCM (circle). The two solid lines are the least squares linear fits described by the Eqs. (11) (surface layer) and (12) (DCM). The dashed and doted lines represent the semi-analytical model of Morel and Maritorena (2001), in which the mean formulation used between bpand TChl-a is replaced by the
empirical formulation developed over the BOUM data set (Eq. 7), and for two different values of the backscattering ratio, bbp/bp, as
indicated. The solid grey line represents the empirical formulation of Huot et al. (2008), and the two grey dashed lines delimit the 95 % confidence interval as given in Huot et al. (2008) (their Ta-ble 1). (b) Comparison between the in situ bbp(650) measurements and the bbp(526) measurements performed in the wet lab on surface
pumped water at station B.
ratio values. More recently, Morel and Gentili (2009) pro-posed that the TChl-a overestimation by standard (global) algorithms (such as OC4v4) reflects the presence of a high CDOM background within the Mediterranean waters.
The over-estimation of TChl-a by a factor of 2 using OC4v4 is due to a lower blue-to-green reflectance ratio, BG, than expected (by a factor 1.4). The mean and standard
Figure 8.
Fig. 8. Variations of the blue-to-green reflectance ratio as a function
of the TChl-a concentration for the BOUM data set. The dashed line represents the global NASA algorithm (“OC4v4,” see O’Reilly et al., 1998), and the solid line the regional algorithm developed by Bricaud et al. (2002).
deviation of in situ BG and TChl-a values are 5.66 ± 0.67 and 0.041 ± 0.006 mg m−3, respectively. The same mean TChl-a value can be obtained using OC4v4 with a BG value of 8.2, that is 1.4 times higher than the BG in situ value. The lower than expected BG value is explained by a lower than expected blue-to-green backscattering ratio,
bb(443)/bb(555), and/or a higher than expected blue-to-green
absorption ratio, a(555)/a(443). Based on standard IOPS vs. TChl-a relationships the variability of BG with TChl-a, as driven by the empirical OC4v4 algorithm, can be reproduced to study the impact of each IOPs on the BG value. For that purpose, bbp(λ), ap(λ), and acdom(λ)are modeled as a
func-tion of TChl-a according to Huot et al. (2008), Bricaud et al. (1998), and Morel and Gentili (2009), respectively. For the mean TChl-a value obtained from the present data set (i.e. 0.041 mg m−3)the BG value (= 7.9) calculated using these different relationships is close to the OC4v4 BG value (= 8.2), emphasizing that these relationships can be used in this sensitivity analysis. The impact of each IOPs measured during BOUM on the BG values is now examined by mod-ifying the mean IOPs vs. TChl-a relationships based on the BOUM data set.
3.3.2 Absorption by particles larger than about 0.5–0.7 µm
The substitution of the mean (global) ap(λ) relationships
at 443 and 555 nm by those established from the present in situ data set in the BG parameterization only induces a very slight increase of BG. This increase is due to the lower than expected ap(440) and ap(555) values. Such low values
al. (2010) during BIOSOPE. The measured non-algal par-ticles, anap(440), values are consistent with those
calcu-lated using the mean relationship established by Bricaud et al. (2010) between anap(440) and TChl-a from data collected
in different oceanic areas ranging from ultra-oligotrophic and eutrophic waters. For instance, for TChl-a = 0.05 mg m−3,
anap(440) is equal to 0.0023 and 0.0021 m−1for the BOUM
data set and from the Bricaud et al. (2010)‘s parameteriza-tion, respectively. Therefore, absorption properties of sus-pended marine particles sampled during BOUM with diam-eters higher than 0.5–0.7 µm (the assumed porosity of the GF/F filter after their precombustion) can not explain the 40 % BG decrease (compared with its expected values for the same TChl-a).
3.3.3 Absorption by small particles and colored dissolved organic matter
Decrease in the blue-to-green reflectance ratio by a factor of 1.4 by modifying only the amount of colored dissolved or-ganic matter would require an increase in each of the mean values of acdom(443) and acdom(555) as modeled by Morel
and Gentili (2009) by a factor of 2.9. Unfortunately, ab-sorption by colored dissolved organic matter, acdom(λ), and
absorption by small particles with diameters between about 0.2 and 0.7 µm, asp(λ), have not been measured during the BOUM cruise. asp(λ)represents the missing part in the ab-sorption budget, as ap(λ) represents the absorption by par-ticles retained by a filter with a nominal pore size of about 0.5–0.7 µm, and acdom(λ)is the absorption of the matter af-ter filtration onto membrane filaf-ters with a 0.22 µm pore size. However, acdom(λ)+ asp(λ)can be modeled by subtracting the measured particulate absorption, ap(λ), and the pure sea water absorption, aw(λ) (Pope and Fry, 1997), coefficients
to the total absorption coefficient, a(λ), retrieved from ra-diometric measurements. The remote-sensing reflectance, the average attenuation coefficient for downwelling irradi-ance, Kd(λ), between the surface and the first attenuation
depth, and the solar zenith angle, are used as input param-eters in the new version of the Loisel and Stramski (2000) model to assess the total absorption and backscattering co-efficients. This new version directly accounts for Rrs
in-stead of irradiance reflectance, R(0−), and includes more realistic b/a- bw/b combination in the different
parameteri-zations used in the model (b and bw are the total and pure
sea water scattering coefficients, respectively). Based on a synthetic data set (IOCCG, 2006) bbp(443) and a − aw(443)
are retrieved with a Root Mean Square error of 0.024 and 0.0022 for oligotrophic waters (Chl-a < 0.3 mg m−3). Based on the BOUM data set when bbp, Rrs and Kd
measure-ments are available, the inversed-to-measured bbp(650) ratio
is 0.92 ± 0.11. The mean and standard deviation for the mea-sured and inversed bbp(650) values are 0.00074 ± 0.00005
and 0.00068 ± 0.00011 m−1, respectively. Even though the number of stations is limited (N = 7), this result gives us a
certain degree of confidence for the absorption assessment using the present model. The mean and standard deviation of acdom(443) + asp(443) are 0.0054 ± 0.0011 m−1for these
stations. These inversed values are slightly higher than those calculated from the mean global relationship of Morel and Gentili (2009) between acdom(443) and TChl-a. Indeed, for
the TChl-a values measured at the stations considered for the inversion, the mean and standard deviation values for
acdom(443) are 0.0042 ± 0.0004 m−1. The inversed values
are therefore greater by a factor of 1.29 than the averaged values, which is far from the factor 2.9 that should be con-sidered to explain the BG anomaly with only absorption by CDOM and submicron particles. Note that by taking into ac-count an error of 40% in the acdom(443) + asp(443) retrieval
would provide values greater by a factor of 1.8 than the aver-aged values.
3.3.4 The scattering and backscattering anomalies
The present in situ data set reveals that both surface cp*
and bbp* are higher than expected using standard
relation-ships developed for open ocean waters (Loisel and Morel, 1998; Huot et al., 2008). Our high cp* values are
consis-tent with the findings of Gitelson et al. (1996) and Claustre et al. (2002). For instance, Claustre et al. (2002) have shown that the particulate scattering coefficients measured in the Io-nian Sea (eastern basin of the Mediterranean sea) were higher by a factor of 2.4 than the ones modeled according to Loisel and Morel (1998) using their data Subsects. 2 and 3. With the BOUM data set this overestimation reaches a factor of 1.4. The discrepancy between the measured and modeled cp, is
even more pronounced for bbpin the ultra oligotrophic parts
of the Mediterranean Sea sampled during the BOUM cruise. This is the first time that such large bbp* values are reported
in ultra oligotrophic environments, as only scattering or at-tenuation measurements were performed in the previously cited studies (mainly due to the relatively recent commercial availability of appropriate instrumentation). While recent studies stressed that higher than averaged bbp* values lead to
an over-estimation of TChl-a by standard global algorithms using blue-to-green reflectance ratios (Brown et al., 2008; Loisel et al., 2010), the relevant driving processes are not to-tally understood. Based on the present data set and for
TChl-a = 0.041 mg m−3, bbp(650) is greater by a factor of 3.26
compared to the averaged value of Huot et al. (2008). The spectral values of bbp(λ)are computed using three methods to assess the effect of bb(443)/bb(555) on BG. First, the
spec-tral dependencies as established by Huot et al. (2008) from their different parameterizations between bbp(λ)and TChl-a
are used to assess bbp(443) and bbp(555) from the bbp(650)
measurements performed during the BOUM cruise. In this configuration the blue to green reflectance ratio decreases by a factor of 1.10 compared to its mean expected value for TChl-a = 0.041 mg m−3. Second, bbp(555) is equal to the bbp(443) value as calculated in the first configuration. This
configuration, which accounts for the presence of absorb-ing particles in the blue beabsorb-ing responsible for the decreas-ing bbp(443) value through the absorbing depressing effect,
explains more than half of the BG anomaly. Indeed, the BG decreases by a factor of 1.33 compared with the factor 1.4. At last, bbp(443) and bbp(555) are calculated from bbp(650)
as-suming a spectral dependency of λ−1and λ−3.5, respectively. Note that such high bbpspectral dependency has already been
reported in the Mediterranean Sea in summer (Antoine et al., 2011). This configuration, in which bbp(555) is slightly
higher than bbp(443) (by a factor 1.20), almost fully explains
the 1.4 decreasing of the blue-to-green ratio. The two last scenarios in terms of bbpspectral shapes account for the fact
that these particles should strongly backscatter light in the green part of the spectrum due to (i) their specific proper-ties and (ii) the absorbing depressing effect in the backscat-tering spectrum, which reduce the number of backscattered photons in the blue. The spectral variability of bbp
calcu-lated from the scattering measurements performed in the blue (470 nm) and in the green (526 nm) parts of the spectrum on pumped-water, as described in the Sect. 3.2, emphasizes that the second scenario is the more reliable one. Indeed, the
bbp(470)/bbp(526) ratio is 1.04±0.06 for stations where the
blue-to-green reflectance anomalies have been reported. This ratio is significantly lower that the one measured in the most oligotrophic part of the Atlantic ocean during the AMT19 cruise (bbp(470)/bbp(526) ≈ 1.2) using the same
measure-ment protocol (Dall‘Olmo, personal communication, 2011). This feature again stress the peculiar bio-optical character of these Mediterranean waters sampled.
Based on the different scenarios of specific IOPs exam-ined above, one may assume that the presence of highly re-fractive suspended marine particles with diameter lower than 0.5–0.7 µm in the surface layer of the Mediterranean Sea could explain most of the observed blue-to-green reflectance anomalies. The vertical variability of the factor appearing in Eq. (11) (0.00573) and (12) (0.00197) emphasizes that the overestimation of bbp, compared to its mean expected
value, is restricted to a surface layer of about 40 m deep (Fig. 9). In the same way, the higher determination coeffi-cient found between cpor bbpand TChl-a at the DCM
com-pared to their surface value stress that the variability in both
bbp and cp is more tightly related to that of TChl-a at the
DCM (Eqs. 7, 9, 11, and 12). The presence of non-pigmented particles (in terms of TChl-a) at the surface could explain part of this difference. Therefore, the combination of the in-versed acdom(λ) + asp(λ) values, which decreases BG by a factor of 1.08, and the bbp(λ)values calculated using the
sec-ond scenario, explains the full blue-to-green reflectance ratio anomaly.
3.3.5 Origin of the submicrometer particles
Even though Mie calculations should be used with cau-tion for the interpretacau-tion of bbp (Stramski et al., 2004), it
Figure 9.
Fig. 9. Vertical evolution of the coefficient α (bbp=αTChl-aβ)
calculated from a regression analysis performed at different depths between the bbpand TChl-a data values measured at the three long
duration stations.
provides some insights if one considers particles as homoge-neous spheres. In this context, the higher-than-expected bbp
surface values for a given TChl-a may be caused by a much greater concentration of small organic living or non-living particles compared to large particles, or/and by the presence of highly refractive particles. Indeed, hyperbolic particle size distribution with a high slope value, and particles with high refractive index both explain the high bbp/bpvalues reported
here (see Fig. 9 in Twardowski et al., 2001). Based on these theoretical considerations, the following different types of particles could explain the high bbp* and bbp/cpvalues in the
studied area: a high concentration of submicron non-living or living organic particles, highly refractive submicron Saharan dust, and highly refractive coccolithophores. Based on the fact that high bbp* values are found at the three long duration
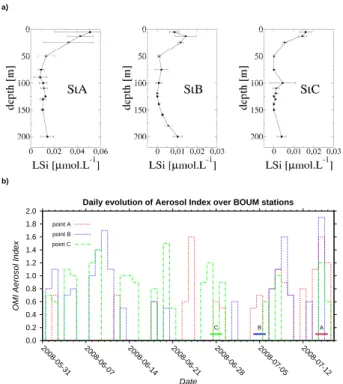
stations which are located in the eastern, central and western part of the Mediterranean Sea, and that these particles should be in the submicron size range with therefore a negligible sinking velocity, coccolithophores are not the most plausi-ble candidates to explain the BG anomaly. Picoparticles, amongst which picodetritus have a lower water content and a higher refractive index than phytoplankton cells, may appear in high concentrations as shown in Loisel et al. (2006) in the ultra-oligotrophic waters of the south Pacific gyre. However, no bbp and BG anomalies were observed during BIOSOPE
where very steep slopes of the particle size distribution in the submicrometer range were measured. In contrast to the two previous types of particles, strong evidence indicates that highly refractive particles from Saharan origin could ex-plain the BG anomalies as already advanced by Claustre et al. (2002). Firstly, vertical profiles of lithogenic silica, LSi, a desert dust tracer (Betzer et al., 1988), exhibit high sur-face concentration for each LD stations (Fig. 10a). Besides,