HAL Id: hal-02749008
https://hal.archives-ouvertes.fr/hal-02749008
Submitted on 3 Jun 2020
HAL is a multi-disciplinary open access
archive for the deposit and dissemination of
sci-entific research documents, whether they are
pub-lished or not. The documents may come from
teaching and research institutions in France or
abroad, or from public or private research centers.
L’archive ouverte pluridisciplinaire HAL, est
destinée au dépôt et à la diffusion de documents
scientifiques de niveau recherche, publiés ou non,
émanant des établissements d’enseignement et de
recherche français ou étrangers, des laboratoires
publics ou privés.
Experiences from Monitoring Fish Communities around
Drifting FADs
Patrice Brehmer, Gorka Sancho, Vasilis Trygonis, David Itano, John Dalen,
Ariel Fuchs, Abdelmalek Faraj, Marc Taquet
To cite this version:
Patrice Brehmer, Gorka Sancho, Vasilis Trygonis, David Itano, John Dalen, et al.. Towards an
Autonomous Pelagic Observatory: Experiences from Monitoring Fish Communities around
Drift-ing FADs.
Thalassas: An International Journal of Marine Sciences, 2019, 35 (1), pp.177-189.
�10.1007/s41208-018-0107-9�. �hal-02749008�
Towards an Autonomous Pelagic Observatory: Experiences
from Monitoring Fish Communities around Drifting FADs
Patrice Brehmer1 &Gorka Sancho2&Vasilis Trygonis3&David Itano4&John Dalen5&Ariel Fuchs6& Abdelmalek Faraj7&Marc Taquet8
Received: 8 January 2018 / Published online: 24 August 2018 # Springer Nature Switzerland AG 2018
Abstract
This work presents a methodological synthesis for the in situ monitoring of fish aggregating devices (FADs) using a combination of optical, echosounder and SCUBA observations conducted in the vicinity of drifting FADs. The acoustic methods allowed, according to the devices used, the description of the spatial organisation and dynamics of biotic scattering layers, individual fishes, schools, shoals and mammals, while visual, photographic and video observations permitted species identification within a range of 0 to ~ 25 m. Based on these results, we elaborate on the interest to combine acoustic and visual methods, and present an autonomous instrumented drifting buoy for remotely monitoring fish diversity and abundance in the pelagic ecosystems. The perspective of autonomously collecting large amounts of basic information useful for ecological and fisheries studies in an ecosystem approach for open sea, as well as coastal pelagic environment, is also emphasized. As perspective we present BSeaorbiter^ a futuristic large drifting platform which will allow performing innovative ecosystemic studies taking into account simultaneously all macro components of the pelagic ecosystem.
Keywords Optical . Census . Acoustics . Buoy . Seaorbiter . Biomonitoring . Conservation . Environmental monitoring . Fish . Pelagic
Introduction
Oceanographic observatories are floating, autonomous, in-strumented systems which combine a range of sensors that enable the long-term collection of biotic and abiotic data about the pelagic environment. Processed in real-time or offline mode, data from such systems allow the production of
indicators that can facilitate the monitoring and/or manage-ment of remote marine ecosystems and/or areas of interest. Using as case study our in situ investigations on drifting fish aggregating devices (FADs) conducted during the European research project FADIO (‘Fish Aggregating Devices as Instrumented Observatories of pelagic ecosystems’, Dagorn et al. 2007), this study aims at formulating suggestions for
Electronic supplementary material The online version of this article
(https://doi.org/10.1007/s41208-018-0107-9) contains supplementary
material, which is available to authorized users. * Patrice Brehmer
Patrice.Brehmer@ird.fr
1 Institut de Recherche pour le Développement (IRD), Campus
Ifremer, Délégation régional IRD France-Ouest, UMR LEMAR, BP 7029 280 Plouzané, France
2
College of Charleston, 205 Fort Johnson Rd, Charleston, SC 29 412, USA
3 Department of Marine Sciences, University of the Aegean,
University Hill, 81 100 Mytilene, Greece
4
University of Hawaii at Manoa, 1000 Pope Road, MSB 312, Honolulu, HI 96 822, USA
5 Institute of Marine Research, P.O. Box 1870, Nordnes 5817, Bergen,
Norway
6
Out-There Science Consulting, Sustainable Strategies &
Opportunities, 10 rue du Levant, 34 280 La Grande Motte, France
7
Institut National de Recherche Halieutique (INRH), Route de Sidi Abderrahmane, Casablanca, Morocco
8 Institut de Recherche pour le Développement (IRD), UMR EIO
developing an autonomous observatory for the monitoring of fish aggregations in the open ocean, with a particular focus on the upper part of the water column.
The fish aggregation effect of floating objects was first described in detail by Hunter and Mitchell (1967), and several hypotheses have been since formulated (Fréon and Dagorn 2000; Castro et al.2001) to explain this associative behaviour of fish (see review by Dagorn et al.2012). The phenomenon of fish aggregation around floating objects has been recog-nized and exploited by fishermen for a long time, and, nowa-days, the systematic deployment and exploitation of drifting FADs is a common fishing strategy for industrial fisheries that target tuna species in tropical pelagic waters (Fonteneau et al. 2000, 2013). Tuna, however, are not the only species that aggregate around floating objects; FAD-associated fish aggre-gations (Pitcher1983) commonly comprise of 10 to 40 fish species (Romanov2002; Taquet et al.2007), most of which are of no commercial value to industrial fishing fleets, and are therefore discarded as by-catch (Hall et al.2000). Yet, some FAD-associated fish species are of interest to small-scale fish-eries exploiting coastal FADs, while others may play a key role in the initial stages that drive the aggregation process around floating objects (Taquet et al.2007).
Considering the widespread use of drifting FADs as a fish-ing tool, and the inherent biases of the respective commercial catch data (Gaertner et al.1999), collecting scientific, fishery-independent information on fish communities around drifting FADs is crucial for better characterizing and understanding the role of FADs in pelagic ecosystems, including potential adverse ecological impacts. However, collecting in situ data on drifting FAD aggregations is particularly difficult, as FADs deployed by tuna purse seiners are usually found far from coastlines and dispersed over broad offshore areas (Hyrenbach et al.2000).
Observing fish aggregations around FADs with non-intrusive methods can be done from research vessels using in situ visual (Taquet et al. 2007) and acoustic surveys (Josse et al.2000; Brehmer et al.2006a; Doray et al.2006; Moreno et al.2007a; Trygonis et al.2016). Specifically, visual underwater fish censuses are extensively used to identify fish species, but are commonly limited in space and time (e.g. Jones and Thompson1978; Kimmel1985; Michalopoulos et al.1992). Standardized acoustic survey methods can be con-ducted repeatedly and more extensively to provide reliable biomass data, but lack accurate species recognition without complementary information (Fréon and Misund 1999; Simmonds and MacLennan2005). Overall, these survey pro-tocols require substantial human and financial efforts, plus extended and costly research cruises. In order to collect large and simultaneous data sets, there is a need for the use of autonomous monitoring systems, which are pre-requisites to develop large-scale research projects in order to: (a) improve our understanding of the effects of FADs on tuna and other fish species; and (b) build the foundation for future scientific
observatories of pelagic ecosystems using autonomous platforms.
In this study, we evaluate the operability and efficiency of various observation tools based on visual observations and active underwater acoustics that could be autonomously de-ployed on drifting FADs, and discuss the interest, limits and advantages of combining acoustic and optical methodologies to remotely monitor pelagic environments and characterize fish communities associated with FADs.
Materials and Methods
We distinguished two categories of instruments/methods: those that in their current configuration need to be operated from a research vessel (category 1,‘C1’), and those that can be deployed and work autonomously (category 2,‘C2’).
FAD Surveys
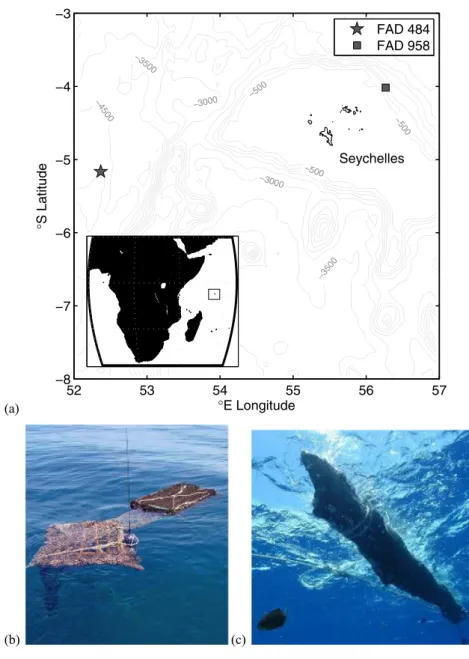
Two drifting FADs were surveyed during a research cruise operated in the frame of the EU project FADIO (. They were deployed by the French tuna purse seine fleet in the western Indian Ocean, around the Seychelles Islands (Fig. 1a). The first FAD (ID 484: 05°10’ S - 52°22’ E; 13/10/2004) was a bamboo raft with hanging netting panels, and the second FAD (ID 958: 04°01’ S - 56°16’ E; 16/10/2004) consisted of a floating coil of thick rope (Fig.1b, c). A sonar buoy prototype (C2) which could not be safely deployed on these drifting FADs due to bad weather conditions was tested separately on an anchored FAD near Mahé Island (Seychelles). A second test of a sonar buoy prototype was performed in August 2006 in a Spanish Bluefin tuna cage.
Acoustic Monitoring
The ship-based acoustic equipment (C1) consisted of multi-frequency echosounders, a multibeam high resolution lateral sonar, and an omnidirectional sonar (Fig.2a to d).
The multibeam echosounder, a Reson Seabat™ 6012 was pole-mounted amidships at two meters depth. It emitted at a frequency of 455 kHz in a vertical plane from the surface to 90°, with 60 beams of 1.5°*17° at a range of 50 m (Gerlotto et al.1999; Guillard et al.2006). The multibeam echosounder TVG (Time Varied Gain) function was set in 20 log R (where R is the distance to the target), the gain was 4 to 6 dB and the pulse length was 0.67 ms. The video multibeam echosounder detec-tion was recorded on a digital videotape recorder and the raw digital one on a hard disk via a dedicated data acquisition soft-ware (Gerlotto et al.1999). The data analysed were the voxel (volume element) delivered by the multibeam echosounder cen-tral unit, with a beam size of 1024 samples and a data precision of 7 bits. The multibeam echosounder software analyzed this
°E Longitude °S Latitude −500 −500 −3000 −500 −3500 −3500 −3000 −4500 52 53 54 55 56 57 −8 −7 −6 −5 −4 −3 FAD 484 FAD 958 Seychelles (b) (a) (c)
Fig. 1 a Map of the study area, showing the FADs that were surveyed offshore Seychelles, western Indian Ocean. b Surface view of an artificial drifting FAD, consisting of bamboo rafts and fishing net (Fadio/IRD-IFREMER/Erwan Josse). c Subsurface view of a natural drifting FAD (Fadio/IRD-IFREMER/Marc Taquet)
(a)
(b) (c) (d)
Fig. 2 a Underwater view of the active acoustic devices used to monitor marine biomass around the drifting FADs. b Split-beam echosounders of different fre-quencies; (c) Pole-mounted high resolution multibeam sonar coupled to an underwater video camera; and (d) Hull-mounted omnidirectional multibeam sonar (Fadio/IRD-IFREMER/Marc Taquet)
digital multibeam echosounder data and produced detailed 3D images of the fish schools. The sampling methodology consisted in performing repeated passes close to the FAD, keeping a vessel - FAD distance of 50 m.
The multifrequency split-beam scientific echosounders were SIMRAD EK60’s operating at 38, 70, and 120 kHz, deployed on an external pole as the multibeam echosounder (see above; Fig.2). Recordings were done over a diameter of 0.8 nautical miles around the FAD in the horizontal plane and on 250 m depth (see Moreno et al.2007a).
An omnidirectional Simrad SP90 sonar was hull-mounted at four meters depth (Fig.2), and used at a frequency of 24 kHz. The omnidirectional sonar was used to detect the FAD fish aggregation and precisely determine its position (Trygonis et al.2016). Then, the vessel would perform a drifting operation from a distance of 50 to 300 m to the FAD to monitor large fish schools (for more details see Brehmer et al.2006a,2007; Trygonis et al.2016).
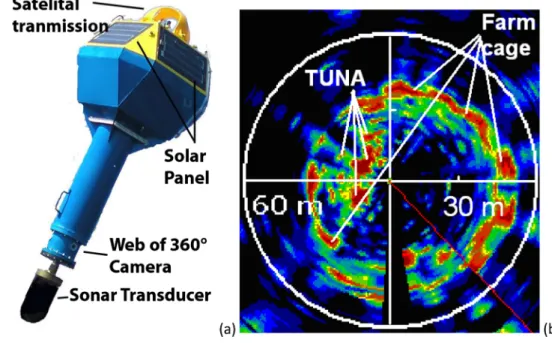
The autonomous acoustic equipment (C2) consisted of a prototype of a sonar buoy system manufactured by Martec-Serpe designed for observing pelagic fish schools. This instru-mented buoy system was equipped with a scanning sonar sys-tem (model: Simrad SL 35; frequency 90 kHz) and a radio beacon system (WIFI: frequency 2.6 GHz; data rate transfer 6 Mo s−1), which directly transmitted the sonar data to the vessel. The buoy settings could be remotely adjusted from the vessel though WIFI. A detailed plan of this first prototype is presented in Appendix1. A second prototype was built by the same company following the preliminary analysis of the data present-ed in this paper, maintaining the Simrad SL35 scanning sonar, and changing the radio beacon system by a satellite communi-cation system (Iridium). This second prototype was also equipped with solar panels and 4 underwater cameras (Fig.3a).
Visual/Optical Monitoring
Two survey methods were used from the research vessel (C1). The first one consisted of visual surveys performed by Scuba divers equipped with an underwater digital video camera sys-tem. The surveys consisted of a diver visual census starting with the fishes present directly under the FAD structure within a 25 m radius and down to 15 m depth, followed by a dive down to 30 m depth to count deeper fishes, all performed in 30 min (for details, see Taquet et al.2007). The second meth-od tested was an underwater video system (Sea-Viewer™, Sea-Drop Camera model 650 Series (dimensions: diameter of 7.6 cm and length of 18.4 cm; focal distance 5 1/2″ to infinity), mounted on a pole along the side of the vessel (Fig. 2c), the camera being at 2 m under the surface. The system was specifically optimized for the marine applications such as underwater wildlife videos and habitat monitoring. The video camera allowed permanent monitoring in PAL-B Video standard, stored on an S-VHS videotape recorder. The analogical video data were post-digitalized with a video card (Brehmer et al. 2005). The sampling methodology was to perform repeated passages close to the FAD, keeping a dis-tance of 50 m (same procedure than for the pole-mounted multibeam echosounder monitoring).
The autonomous optical system (C2) tested was an Aquapix SeaSnap photographic system, consisting of a Nikon CoolPix 5400 digital camera (focus 28 mm) electronically controlled by a Harbotronics Snap360 turntable, all enclosed in a boro-silicate transparent underwater housing (www.aquapix.net/ seasnap360.php). Panoramic views of 360° consisted of ten overlapping digital images of 5 megapixels each, shooting 1 picture every 4 s. This autonomous underwater imaging system was originally developed to monitor benthic
Fig. 3 a Autonomous buoy prototype using wireless satellite system (iridium transmission), solar panel and a web of underwater cameras. b Example data from a trial conducted in a tuna farming cage, where tuna schools are distinguished against the circular net of 60 m diameter
communities and obtain panoramic photographs of benthic habitats while deployed on the bottom. For monitoring fishes around FADs, the Aquapix system was suspended from a buoy hooked to the FAD (with an elastic rope for absorption of the swell movement) at 3 m depth. A vane was attached below the casing to avoid erratic drift and spinning of the suspended camera.
Results: Synthesis of Methodological
Approaches
Results obtained with ship-based (C1) multifrequency echosounders and omnidirectional sonar are detailed in Moreno et al. (2007a); Brehmer et al. (2007) and Trygonis et
al. (2016), respectively. Corresponding underwater SCUBA visual surveys are described in (Taquet et al.2007). The pres-ent paper mainly focuses on novel data obtained through the use of (i) the Martec-Serpe autonomous buoy system, (ii) the RESON multibeam echosounder, (iii) the Aquapix 360o rotat-ing digital photographic camera and (iv) the pole-mounted video camera (Sea Viewer).
Using the RESON multibeam echosounder data, a three-dimensional representation of an underwater scene around a drifting FAD was produced, discriminating the FAD from the fish schools surrounding it (Fig.4a). However, while the 3D positions and structures of the schools could be determined, neither the species nor the size of the individual fishes of these schools could be assessed from the data, nor the school biomass.
(a)
(b)
(c)
Large fish
school
Scattered
layer
Tuna fish
school
FAD
Fish
school
Fig. 4 a 3D representation of several small fish schools detected near a drifting FAD. In red the multibeam echosounder volume insonified (at a range of 50 m), the green windows cross at the FAD position, starting from the surface (455 kHz; range 50 m). b Echosounder view detecting individual fish and scattered layers (i.e. plankton), below the FAD at 38, 70 and 120 kHz from the right to the left, showing different acoustic responses of the planktonic layers according to the frequencies used. The echotrace in‘V’ shape is characteristic of tuna detection (range 120 m depth). c Omnidirectional detection in the vicinity of a drifting FAD; shown on the right is a large fish school, as revealed by theomnidirectional medium range multibeam sonar (24 kHz; horizontal diameter range 1500 m)
The vertical multifrequency echosounders recordings pro-vided accurate acoustics characteristics and position of fish schools, individual fishes and the different planktonic scatter-ing layers present in the water column. Acoustic responses from the planktonic scattering layers varied with the frequen-cies used e.g. shallow layers were well observed at 70 and 120 kHz, while deeper layers were accurately observed at 38 kHz (Fig.4b). The 120 kHz frequency appeared as the best for tuna detection but was the worst for observation of plank-tonic layers as revealed by the visual reading of the echogram i.e. comparing the backscattering from the three frequencies used (Fig.4b). On the other hand, the multifrequency meth-odology permitted a better extraction of fish school character-istics from the echogram and the estimation of relative bio-mass (Moreno et al.2007a).
The recordings by the hull-mounted omnidirectional so-nar allowed for monitoring the behaviours (kinematics and spatial structure) of large fish schools and marine mammals around the FADs, in a horizontal plane, at a much higher range that all the other methods (Brehmer et al.2007,2012) (Fig.4c).
The experimental trials with the first sonar buoy around the anchored FAD produced positive results as it successfully recorded acoustic data on fish schools around the FAD. Horizontal locations of fish school all around the FAD were observed dynamically and transmitted directly to the vessel positioned at several hundred meters from the FAD. The pos-sibility to transmit directly data on the vessel platform by the radio system was validated. The ability to set the sonar buoy parameters from the vessel (wireless control) was also
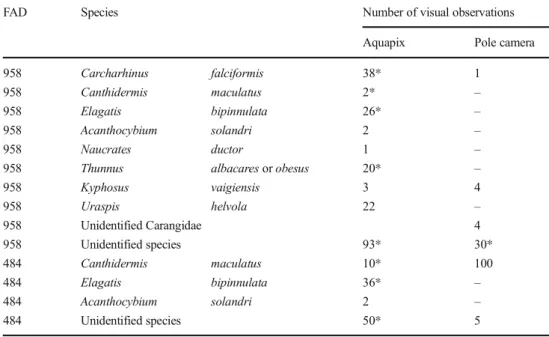
confirmed. The second buoy prototype, deployed on a Bluefin tuna school in a Mediterranean farming cage, effec-tively detected the tuna school and the net around it (Fig.3b). Three pole-mounted video fish observations were made at the first drifting FAD (ID 484), recording one trigger fish school (Canthidermis maculatus) with about 100 individual fish, and two other fish species, which could not be identified from the recordings (Table1). On the second FAD (ID 958), the pole-mounted video recorded eight fishes: one shark Carcharinus falciformis (80 to 100 cm), one Carangid (spe-cies unidentified), four Kyphosus sp. and five unidentified f i s h e s ( a d d i n g u p t o a r o u n d 4 0 i n d i v i d u a l f i s h ) . Comparatively, a total of more than 600 individuals of 11 species and more than 13,000 individuals of 15 species were observed respectively for FADs 484 and 958 by Scuba divers (Taquet et al.2007). All the species observed with the pole-mounted video camera were also recorded during the Scuba surveys (Table 2). There is a poor correlation between fish composition (number of identified species) as well as abun-dance (number of individual fish) data collected with the pole camera vs. the Scuba divers ones (Fig. 5; Table 1). Intermediate results were provided by the autonomous Aquapix system, which recorded 207 individual fishes from 8 identifiable species and multiple unidentified fishes at FAD 958 (Fig.5). Three species were identified from Aquapix im-ages at FAD 484 (98 individual fish recorded), along with numerous fishes that could not be identified (Fig. 5). Observations from the Aquapix system were still less efficient than observations performed by Scuba diver team, particularly on the estimation of individual fish quantity.
Table 1 Fish Identification made after post watching from Aquapix Digisnap 360 image sequences and from the pole-mounted video camera on both studied drifting FAD
FAD Species Number of visual observations Aquapix Pole camera 958 Carcharhinus falciformis 38* 1
958 Canthidermis maculatus 2* – 958 Elagatis bipinnulata 26* – 958 Acanthocybium solandri 2 – 958 Naucrates ductor 1 – 958 Thunnus albacares or obesus 20* – 958 Kyphosus vaigiensis 3 4 958 Uraspis helvola 22 – 958 Unidentified Carangidae 4 958 Unidentified species 93* 30* 484 Canthidermis maculatus 10* 100 484 Elagatis bipinnulata 36* – 484 Acanthocybium solandri 2 – 484 Unidentified species 50* 5
(*) Overestimation due to probable repeats as the fish identified could turn around the FAD. The unidentified fish species number does not represent the total unidentified fish species but the total number of their visual observation
Discussion
Acoustic Observations
Echosounders have permitted to obtain information not only on individual fishes and fish schools around FADs (Josse et al. 2000), but also on the planktonic scattering layer (Bertrand et al.1999; Brierley et al.2006; Doray et al.2006). In order to avoid misleading descriptive interpretations when plankton scattering layers occur, echosounder data must be studied using multifrequency analyses (Moreno et al.2007a), which needs at least two complementary frequencies e.g. in our case study
38 kHz and 70 kHz. The differences of mean volume back-scattering strengths between two different echo sounder fre-quencies allow to discriminate biological backscatterings (Muras et al. 2009). The echosounders in the present study had a narrow sampling volume (vs. multibeam echosounder) below the vessel (Fig.6), but could efficiently correct the pitch and roll effect from the vessel experienced in rough seas during the survey of the both FADs. Nevertheless, sea surface rever-beration produced misleading echoes at the surface, and sub-surface air bubbles generated numerous interferences on the multibeam echosounder detection ability. The high nearest neighbour distance‘NND’ (Bleckmann1993) between indi-vidual fishes inside fish aggregation and inside tuna schools did not allow producing a single target. In this case the software solution did not permit the generation of useful 3D images. In order to avoid these signal limitations, an alternative method would be to analyse multibeam echosounder pictures from multibeam echosounder video data (Brehmer et al.2006b).
The medium range omnidirectional sonar allows to de-tect fish schools up to 800 m (Brehmer et al.2006a,2007; Trygonis et al.2016), but has high power consumption. In this study, we limited the buoy system instrumentation to a small scanning sonar coupled with fixed simple video cam-eras. This was a balance between gaining scientific infor-mation on FAD fish communities (i.e. sonar range in accor-dance with FAD attraction effect), reducing power con-sumption (i.e. low power concon-sumption of the SL35 vs. SP90) (Table3) and the objective of maintaining an overall
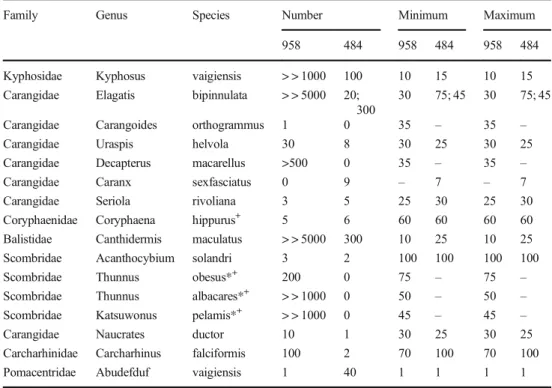
Table 2 List of fish species observed during the survey by SCUBA diving around the two studied drifting FADs 484 (13/10/ 2004; 09:40 to 10:40) and 958 (16/10/2004; 14:00 to 14:40)
Family Genus Species Number Minimum Maximum 958 484 958 484 958 484 Kyphosidae Kyphosus vaigiensis > > 1000 100 10 15 10 15 Carangidae Elagatis bipinnulata > > 5000 20;
300
30 75; 45 30 75; 45 Carangidae Carangoides orthogrammus 1 0 35 – 35 – Carangidae Uraspis helvola 30 8 30 25 30 25 Carangidae Decapterus macarellus >500 0 35 – 35 – Carangidae Caranx sexfasciatus 0 9 – 7 – 7 Carangidae Seriola rivoliana 3 5 25 30 25 30 Coryphaenidae Coryphaena hippurus+ 5 6 60 60 60 60
Balistidae Canthidermis maculatus > > 5000 300 10 25 10 25 Scombridae Acanthocybium solandri 3 2 100 100 100 100 Scombridae Thunnus obesus*+ 200 0 75 – 75 –
Scombridae Thunnus albacares*+ > > 1000 0 50 – 50 –
Scombridae Katsuwonus pelamis*+ > > 1000 0 45 – 45 –
Carangidae Naucrates ductor 10 1 30 25 30 25 Carcharhinidae Carcharhinus falciformis 100 2 70 100 70 100 Pomacentridae Abudefduf vaigiensis 1 40 1 1 1 1 The maximum and minimum size estimate are in cm. (*) Fish species exploited by the professional fishing fleets and (+) per the small-scale fisherman
0 5 10 15 20 25 30 FAD 484 FAD 958 Number of species Aquapix 360 Scuba diver Pole camera
Fig. 5 Graphic of species visually observed by SCUBA diver (in black), the Aquapix system (in hatched) and the pole video camera (in white) around drifting FAD. The fish not identified, only found on the two last devices are not presented
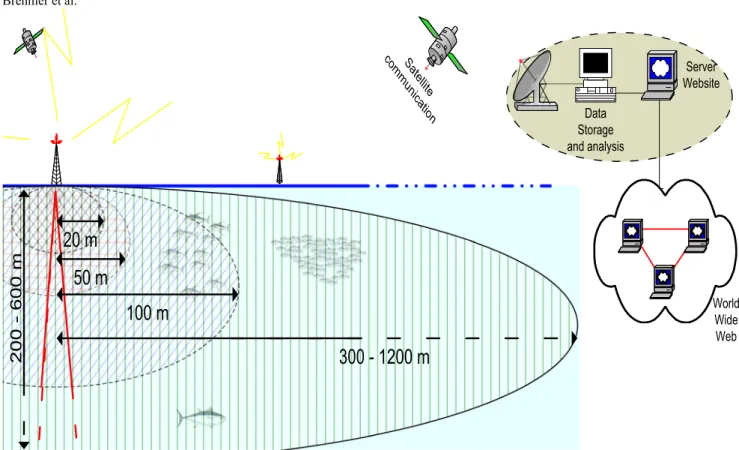
Brehmer et al. Server Website Satellite commu nic atio n Data Storage and analysis 200 -600 m
300 - 1200 m
100 m
50 m
20 m
World Wide WebFig. 6 Scheme of sampling distance for data collection around drifting FAD. The drifting buoy system transmits wireless data (by satellite or by radio HF near a relay) to a data storage centre, which could share scientific information using the World Wide Web. a Buoy video system allows fish identification at short range [20 m], (b) SCUBA diver observation sample a greater area [diameter≈ 50 m]. The acoustic
methods allow large, well standardized and continuous observation below the FAD using (e) echosounder [depth 200 to 600 m], at 3D high resolution using (c) multibeam echosounder [range 50 to 100 m], and at long horizontal distance using (d) omnidirectional or scanning sonar [range 300 to 1200 m]
Table 3 Board of the devices used during our experiments showing their interest in the study of pelagic fish associated to drifting FADs Active acoustics Visual techniques
Device Omnidirectional sonar(1) Scanning sonar(2) Multibeam echosounder(3) Multifrequency echosounders(4) Pole mounted video(5) 360° pictures system(6) Scuba divers Focus Identification -- -- - + ++ ++ +++ Abundance + + ++ +++ -- - -Spatial position ++ ++ +++ ++ + + +++ Sampling volume +++ ++ + ++ -- -- -Power needs -- - - -- ++ + +++ Pelagic fish population scale
Meso Meso Meso Meso Micro Micro Micro
Main focus Kinematic & spatial structure Kinematic & spatial structure 3D visualisation & Internal structure Identification,& Abundance
Identification Inventory & Identification
Accurate inventory & Identification
Each device is ranking by increasing order using 6 modalities (— ‘not useful’, – ‘very bad’, - ‘bad’, + ‘medium’, ++ ‘good’, and +++ ‘excellent’) according to their potential in (i) fish identification, (ii) estimation of relative fish abundance, (iii) spatial positioning and (iv) their electronic power consumption. Lastly, for each device used we shown: their applied scale on pelagic fish population [Micro (individual fish to the school), meso (school to cluster) and macro (cluster to the population)] and their main area of expertise.(1)Simrad SP-90;(2)Simrad SL-35;(3)Reson Seabat 6012;(4)Simrad ES60;(5)Seaviewer Sea-Drop Camera model 650 Series;(6)Aquapix SeaSnap photographic system
low cost of autonomous observatories (i.e. limited to one acoustic device).
Visual Observations
The goal of our study was to check the operability at sea and potential of each visual device, and assess their functionality and effectiveness for the development of autonomous observatories. The number of species ob-served from the pole-mounted video and from the au-tonomous camera (Aquapix system) were significantly lower than those estimated in situ by SCUBA divers. Multiple factors can explain these results. The duration of observations were different: while SCUBA divers were staying 30 min in the water to conduct their visual surveys, the pole-mounted camera was used during 15 min more per survey, and the autonomous camera did multiple 1 min scans (10 pictures) in both surveyed FADs. Also, while the divers surveyed the FAD com-munity dynamically from the surface to 30 m of depth, the pole-mounted camera was located 2 m below the surface turning around the FAD, and the autonomous camera was 3 m deep, fixed under the FAD. Other factors that could explain the poor results produced by the pole-mounted camera were fish avoidance reactions to the moving vessel (Olsen et al. 1983; Fernandes et al. 2000; Brehmer et al. 2003) and reduced visual ranges due to a narrow focal optics of the cameras. However, we consider that the use of pole-mounted camera can provide visual information simultaneous to acoustic data and thus help in identifying some species from specific acoustic targets, without the use of diving operations in offshore waters.
The autonomous photographic camera (Aquapix) tested in our study appeared to constitute the best compromise between a pole-mounted video and diver surveys. The number of fishes and species observed were less than those observed by Scuba divers, but much higher than from the pole-mounted video. We hypothesize that with a more appropriate sampling proto-col (i.e. longer duration of observations, greater number of images taken), such system could approach the performances of Scuba divers at short distances from the FAD (Fig.6). This system would (i) reduce human risks (conducting Scuba diver surveys in offshore environments is a difficult and risky task), (ii) not depend on human performance, (iii) be autonomous (vs. both other visual methods involve using experienced di-vers or the use of vessel), (iv) and can be made regularly and simultaneously at multiple FADs. Consequently we propose a simpler video system with 4 cameras at 90ofrom each other, which would obtain similar information to that of the Aquapix rotating photographic camera in the second autonomous buoy prototype tested (Fig.3).
Combining Visual and Acoustic Observations
At the present time the combination of video/pictures with simultaneous multibeam echosounder data records is not operational for species identification. The range o f d e t e c t i o n b y t h e h i g h r e s o l u t i o n m u l t i b e a m echosounder (50 m) was too wide (i.e. the range was 50 m in a 90° plane) compared to the visual detection range of the pole-mounted video (around 5 to 20 m, using a narrow focal angle). Nevertheless experimental studies could lead to fish identification using acoustics standalone (Guillard et al. 2006, 2011). Synchronized acoustics detection with fish video identification sam-pling a common volume of the water is a way to char-acterize acoustic echoes and confirm their identity. Efficient fishery applications of optical technologies have been detailed in Churnside et al. (2012). Species identi-fications made through images were associated with spe-cific acoustic records during the survey, using both the multibeam echosounder and multifrequency echosounder. We determined that fish recognition when the video cam-era was mounted in the vertical plane (i.e. as the echosounder) was more difficult than when the video system samples in the horizontal plane (i.e. as for the multibeam echosounder (Fig. 2d)). Combining visual and acoustics is a way to facilitate the acoustic discrim-ination of fish species, which is a key to the reduction of by-catch (Bailey et al. 1996) and the take of undersize tuna species (Brehmer et al.2005; Miquel et al.2006) by the fishing industry.
The sampling area covered by each sampling method encompassed different scales and sampling volume (Fig.6). Moreover the information on the fish aggregations deliv-ered by the different active acoustic methodologies were highly complementary (Brehmer et al.2002): from a few small individual fishes located just below the FAD (Taquet 2004) visually observed by divers [Range (omnidirection-al): 0 to 30 m, maximum 50 m], to the large schools of tuna all around the FAD detected by omnidirectional sonar [Range (omnidirectional): 5–800 m, maximum 1200 m], and the individual fishes and planktonic layers observed by the multifrequency echosounders [Range (vertical): 3– 200 m, maximum 600 m]. Small fishes directly under the FAD could not be detected by our acoustics devices be-cause they were in the near field of the active acoustics systems, or because they were below the range resolution of the transducers. Apart from the complementarities of their sampling volume, each method can provide valuable information (e.g. fish species identification, estimation of abundance, spatial positioning) and focuses on a different pelagic fish population scales (micro-from individual fish to school, meso- from school to cluster, and macro- from cluster to population) (Table3).
Perspectives in Autonomous Pelagic Observatories
A drifting monitoring buoy system appears to be a valid ob-servational platform since it would act as a FAD and therefore could allow for long term monitoring of pelagic fish commu-nities without human disturbances. These instrumented buoys could also potentially cover large areas while being displaced by surface currents and winds. Purse seine fishermen are al-ready working with autonomous non-scientific acoustic buoys that remotely provide information on relative biomass esti-mates using commercial echosounders and satellite transmit-ters (e.g. Moreno et al.2007b), illustrating the value and the operability of such systems. Future refinements to both buoy prototypes tested in this study are needed before a final auton-omous buoy reaches the production stage. Hardware power consumption is still the main challenge for building autono-mous instrumented drifting platforms with acoustic and video surveying capabilities in offshore environments. The rate of data transfer through satellite transmissions as the buoy con-ception does not constitute a technical limitation (Stolte1994). Video systems have shown their operability in remote harsh conditions, plus they have low power consumption which allows them to be mounted additionally to sonar systems. Our second autonomous buoy prototype with four cameras provides 360° underwater view (4*90°) around the buoy. Data can be transmitted though radio or satellite communica-tion modules which provide real time data transmission. An alternative is to store data on a hard disk in the buoy (Wilson 1998; Godø and Totland1999), which increases power econ-omy, but requires the recovery of the device to access the recorded data. However, the recovery of drifting buoys after long deployments in the open ocean where purse seiner fish-ing fleets operate is very unlikely (Moreno et al.2007a). To further increase power economy, video cameras could be only activated during daytime hours and triggered according to particular acoustics detection characteristics (e.g. changes in acoustic intensity and reflectivity indexes of the targets) or when certain movement patterns are acoustically detected (i.e. fish passage in the camera detection field) (Spruijt et al. 1992). Fish tracking by video could also be envisaged to in-crease the fish species recognition (Kirkpatrick et al.1991; Noldus et al.2002), as a joint video acoustic system (Cevher et al.2007). The power limitation would be inversely propor-tional to the buoy size (battery compartment size). A certain critical buoy size is needed to implement renewable energy generators such as solar panels, wind turbines or fuel cells, which would allow adding other valuable instruments and sensors to the buoy such as acoustic Doppler current profilers (Brierley et al.2006). In our case of drifting FAD ecological studies, atmospheric and oceanographic sensors (rain, wind, air and water temperature, water conductivity and turbidity,
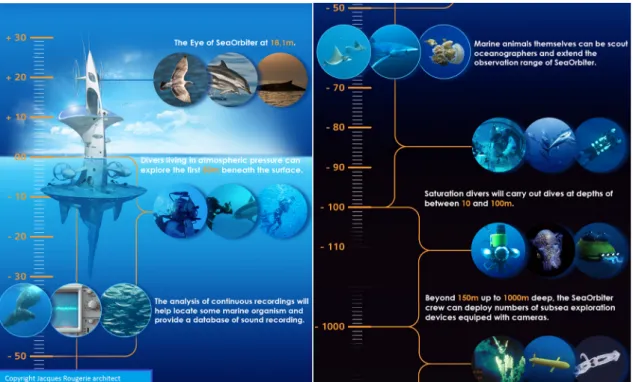
etc.), hydrophones (sea state, bioacoustic noises) and acoustic listening stations for detecting acoustically tagged organisms (Ohta and Kakuma2005), do not need heavy technical adap-tation to the buoy and can provide the complementary valu-able information. At the opposite of our low coast buoy sys-tem, a futuristic drifting platform ‘Seaorbiter’ (Fig. 7, Appendix2), could be instrumented with all devices tested in this study without the problems of power supply or data storage. Moreover a potential Seaorbiter platform could allow the safe deployment of scuba divers.
Apart from the devices used in our project, an interesting possibility would be to use remotely operated vehicles (ROV) and autonomous underwater vehicles (AUV), using the buoy as a power source/charging station and data transmission platform. Fernandes et al. (2003) have shown that such equip-ment could be equipped with acoustics devices and produce high quality results. The main interest is that the AUV equipped with physical, acoustic and video sensors could make surveys around the FAD at several depths, could track particular individuals, or even perform inter-FAD transects. A limitation could be the avoidance by specific fishes of under-water vehicles (Trenkel et al.2004).
This work paves way to provide interesting perspective for fisheries and ecological studies in the pelagic environment. Dagorn et al. (2007) underline the interest to study top pred-ators (e.g. shark and tuna) using buoy observatories, because these species have natural aggregative behaviours around floating objects. The interest to use broad net of instrumented buoys at a large scale was a perspective of the Fadio project (Dagorn et al.2007). Future studies which necessitate an eco-system approach, need adapted experimental sampling schemes, using ad-hoc methodologies and devices that can provide data from remote offshore pelagic habitats (e.g. Godø and Tenningen2009). A key goal using such autono-mous tools, in particular in such open sea pelagic environ-ments that are seldom surveyed but could be regularly moni-tored, would be to define consistent indicators of the ecosys-tem ecological status.
Conclusions
This synthesis refined our methodology for characterizing fish aggregations and will help with the study of dynamic fish aggregations in association with drifting FADs as well as to monitor pelagic fishes in an ecosystems approach, including seabirds, marine mammals and plankton communities. Visual fish censuses by divers were limited in space and time, while acoustic methods were not. Acoustics methods are well stan-dardized and are not dependant on underwater visibility. On the other hand SCUBA diver fish surveys allow accurate fish
species identification and collection of detailed information on the FADs characteristics. Catching fishes from FAD aggrega-tions with commercial purse seiners remains a valid way to obtain detailed fish inventories and abundance estimates around drifting FADs (e.g. Parin and Fedoryako 1999), though this method does not produce data on fish behavioural dynamics nor the presence of small fishes that swim through the net mesh or more simply not catchable by the fishing practice.
The underwater acoustics and video autonomous buoy system, drifting or fixed, linked with satellite communica-tion, radio link (near a reception centre) or high memory storage recoverable systems will be in a near future an op-erative observatory of the pelagic environment for monitor-ing plankton, fish and mammal behaviour, abundance and diversity. Indeed a combination of video and acoustic ob-servations recorded simultaneously from the same instru-mented buoy structure will provide large quantities of basic information useful for ecological and fisheries studies on fish aggregations in the open sea, as in our case study, or coastal pelagic environment. In the context of global warming, biodiversity conservation and overexploitation of natural resources, such tools could provide in situ data and consistent indicators crucial to making ecological stud-ies in the pelagic ecosystems.
Acknowledgements This work was carried out within the European pro-ject FADIO (QLRI-CT-2002-02773) in collaboration with the Seychelles Fishing Authority and we thank Laurent Dagorn (IRD) for his coordina-tion. Previous work on multibeam echosounder data visualization was done under the Avitis project (EU DG XIV contract Fair CT 96-1717). This synthesis was supported by the GIS Europole Mer (Research Axis 5 - Complex systems for observation, measures and intervention) and then by the AWA project (IRD– BMBF). Thanks to Stratis Georgakarakos, the crew of the Indian Ocean Explorer, and the SCUBA diver team (Christophe Peignon (IRD), Olivier Dugornay (Ifremer)) for conducting underwater visual and video surveys and particularly Marc Taquet (Ifremer). We dedicate this work to the crew of the M/V Indian Ocean Explorer which was seized by Somali pirates for 3 months. We thank the blue belt initiativeBBBI^ for its encouragement in ocean monitoring since CoP22. Lastly we thank Jacques Rougerie for the Seaorbiter project and for considering our scientific advice in Seaorbiter science plan during the 2010-2016 period.
References
Bailey K, Williams PG, and Itano D (1996) By-catch and discards in the Western Pacific Tuna fisheries: A review of SPC data holdings and literature. South Pacific Commission, Noumea, New Caledonia, Oceanic Fisheries Programme, Technical Report 34, Various pagings
Bertrand A, Le Borgne R, Josse E (1999) Acoustic characterisation of micronekton distribution in French Polynesia. Mar Ecol Prog Ser 191:127–140
Fig. 7 Seaorbiter is a 51 m height drifting platform (30 m immerged) planned to be deployed in high Sea through large oceanic current in a near future. This quiet platform (no combustion engine) apart from its original sampling scheme in drift mode will allows setting up easily Scuba diver team, allowing increasing limitation in power supply and data storage.
Such infrastructure permit to implement optical, active and passive acoustic systems to monitor simultaneously the macro components of the pelagic ecosystem (i.e. planktonic scattering layers, individual fishes, schools, shoals and mammals) in the 3 dimensions
Bleckmann H (1993) Role of lateral line in fish behaviour. In: Pitcher TJ (ed) Behaviour of teleost fishes. Chapman and Hall, London, pp 201–246
Brehmer P, Gerlotto F, Rouault A (2002) In situ inter-standardization of acoustics data: an integrated database for fish school studies. Acta Acust 88:730–733
Brehmer P, Guénnegan Y, Arzelies P, Guillard J, Cheret Y, Duformentelle P, Colon M (2003) In situ radiated noise of platform used on shallow water area on echo sounder data in fisheries science. Hydroacoustics 6:28–31
Brehmer P, Aumeeruddy R, Itano D, Taquet M, Gerlotto F, Sanchez G (2005) Simultaneous under water digital video recording and multibeam sonar monitoring of FADs and artificial reef in eastern Indian Ocean. In: Papadakis JS, Bjorno L (eds) Proceedings of the 1stInternational Conference Underwater acoustic measurements: technologies and results, Heraklion, Crete, 28thJune– 1stJuly, p 6 Brehmer P, Lafont T, Georgakarakos S, Josse E, Gerlotto F, Collet C
(2006a) Omnidirectional multibeam sonar monitoring: applications in fisheries science. Fish Fish 7:165–179
Brehmer P, Vercelli C, Gerlotto F, Sanguinède F, Pichot Y, Buestel D, Guénnegan Y (2006b) Multibeam sonar detection of suspended mussel culture grounds in open sea: direct observation methods for management purpose. Aquaculture 252:234–241
Brehmer P, Georgakarakos S, Josse E, Trygonis V, Dalen J (2007) Adaptation of fisheries sonar for monitoring schools of large pelagic fish: dependence of schooling behaviour on fish finding efficiency. Aquat Living Resour 20:377–384
Brehmer P, Josse E, Nøttestad L (2012) Evidence that whales (Balaenoptera borealis) visit drifting fish aggregating devices. Mar Ecol 3(2):176–182.https://doi.org/10.1111/j.1439-0485.2011. 00478.x
Brierley AS, Saunders RA, Bone DG, Murphy EJ, Enderlein P, Conti SG, Demer DA (2006) Use of moored acoustic instruments to measure short-term variability in abundance of Antarctic krill. Limnol Oceanogr 4:18–29
Castro JJ, Santiago JA, Santana-Ortega AT (2001) A general theory on fish aggregation to floating objects: an alternative to the meeting point hypothesis. Rev Fish Biol Fish 11:255–277
Cevher V, Sankaranarayanan AC, McClellan JH, Chellappa R (2007) Target tracking using a joint acoustic video system. IEEE Trans Multimedia 9(4):715–727
Churnside J, Jech M, Tenningen E (eds) (2012) Fishery applications of optical technologies. ICES Coop Res Rep 312:91
Dagorn L, Holland K, Dalen J, Brault P, Vrignaud C, Josse E, Moreno G, Brehmer P, Nøttestad L, Georgakarakos S, Trigonis V, Taquet M, Aumeeruddy R, Girard C, Itano D, Sancho G (2007) New instru-ments to observe pelagic fish around FADs: satellite-linked acoustic receivers and buoys with sonar and cameras. In: Lyle JM, Furlani DM, Buxton CD (eds) Cutting-edge technologies in fish and fisher-ies science. Australian Society for Fish Biology Workshop Proceedings, Hobart, Tasmania, August 2006, Australian Society for Fish Biology
Dagorn L, Holland KN, Restrepo V, Moreno G (2012) Is it good or bad to fish with FADs? What are the real impacts of the use of drifting FADs on pelagic marine ecosystems? Fish Fish 14:391–415 Doray M, Josse E, Gervain P, Reynal L, Chantrel J (2006) Acoustic
characterisation of pelagic fish aggregations around moored fish aggregating devices in Martinique (Lesser Antilles). Fish Res 82: 162–175
Fernandes PG, Brierley AS, Simmonds EJ, Millard NW, McPhail SD, Armstrong F, Stevenson P, Squires M (2000) Fish do not avoid survey vessels. Nature 404:35–36
Fernandes PG, Stevenson P, Brierley AS, Armstrong F, Simmonds EJ (2003) Autonomous underwater vehicles: future platforms for fish-eries acoustics. ICES J Mar Sci 60:684–691
Fonteneau A, Pallarés P, Pianet R (2000) A worldwide review of purse seine fisheries on FADs. (Ed. Le Gall J.-Y., Cayré P., Taquet M.), Pêche thonière et dispositifs de concentration de poissons. IFREMER, Actes Colloq. 28, pp. 15–34. (Ifremer: Martinique, France)
Fonteneau A, Chassot E, Bodin N (2013) Global spatio-temporal patterns in tropical tuna purse seine fisheries on drifting fish aggregating devices (DFADs): taking a historical perspective to inform current challenges. Aquat Living Resour 26:37–48
Fréon P, Dagorn L (2000) Review of fish associative behaviour: toward a generalisation of the meeting point hypothesis. Rev Fish Biol Fish 10:183–207
Fréon P, Misund OA (1999) Dynamics of pelagic fish distribution and behaviour: effects on fisheries and stock assessment. Fishing News Books. Blackwell Scientific, Oxford
Gaertner D, Pagavino M, Marcano J (1999) Influence of fishers' behav-iour on the catchability of surface tuna schools in the Venezuelan purse-seiner fishery in the Caribbean Sea. Can J Fish Aquat Sci 56: 394–406
Gerlotto F, Soria M, Fréon P (1999) From two dimensions to three: the use of multibeam sonar for a new approach in fisheries acoustics. Can J Fish Aquat Sci 56:6–12
Godø OR, Tenningen E (2009) Remote sensing. In: Megrey BA, Moksness E (eds) Computers in fisheries research, 2nd edn. Kluwer Academic Publishers, London, pp 121–144
Godø OR, Totland A (1999) Bergen acoustic buoy (BAB): a tool for remote monitoring of marine resources. J Acoust Soc Am 105: 1051–1051
Guillard J, Brehmer P, Colon M, Guennégan Y (2006) Three dimensional characteristics of young–of–year pelagic fish schools in lake. Aquat Living Resour 19:115–122
Guillard J, Fernandes P, Laloë T, Brehmer P (2011) Three-dimensional internal spatial structure of young-of-the-year pelagic freshwater fish provides evidence for the identification of fish school species. Limnol Oceanogr Methods 9:322–328
Hall M, Alverson DL, Metuzals KI (2000) By-catch: problems and solu-tions. Mar Pollut Bull 41:204–219
Hunter JR, Mitchell CT (1967) Association of fishes with flotsam in the offshore waters of Central America. Fish Bull 66:13–29
Hyrenbach KD, Forney KA, Dayton PK (2000) Marine protected areas and ocean basin management. Aquat Conserv Mar Freshwat Ecosyst 10:437–458
Jones RS, Thompson MJ (1978) Comparison of Florida reef fish assem-blages using a rapid visual survey technique. Bull Mar Sci 28:159–172 Josse E, Dagorn L, Bertrand A (2000) Typology and behaviour of tuna aggregations around fish aggregating devices from acoustic surveys in French Polynesia. Aquat Living Resour 13:183–192
Kimmel JJ (1985) A new species-time method for visual assessment of fishes and its comparison with established methods. Environ Biol Fish 12:23–32
Kirkpatrick T, Schneider CW, Pavloski R (1991) A computerized infrared monitor for following movement in aquatic animals. Behav Res Methods Instrum Comput 23:16–22
Michalopoulos C, Auster PJ, Malatesta RJ (1992) A comparison of tran-sect and species-time counts for assessing faunal abundance from video surveys. Mar Technol Soc J 26:27–31
Miquel J, Delgado de Molina A, Ariz J, Delgado de Molina R, Déniz S, Díaz N, Iglesias M, Santana JC and Brehmer P (2006) Acoustic Selectivity in Tropical Tuna (Experimental Purse-seine Campaign in the Indian Ocean). WCPFC-SC2/FT WP-8, 31 pp. (Western and Central Pacific Fisheries Commission, Scientific Committee: Manila, Philippines)
Moreno G, Dagorn L, Sancho G, García D, Itano D (2007a) Echotrace classification and spatial distribution of pelagic fish aggregations around drifting fish aggregating devices (DFAD). Aquat Living Resour 20:343–356
Moreno G, Josse E, Brehmer P, Nøttestad L (2007b) Using local ecolog-ical knowledge (LEK) to provide insight on the tuna purse seine fleets of the Indian Ocean useful for management. Aquat Living Resour 20:367–376
Muras H, Ichihar M, Yasum H, Watanab H, Yonezak S, Nagashim H, Kawahar S, Miyashit K (2009) Acoustic characterization of biolog-ical backscatterings in the Kuroshio-Oyashio inter-frontal zone and subarctic waters of the western North Pacific in spring. Fish Oceanogr 18:386–401
Noldus LPJJ, Spink AJ, Tegelenbosch RAJ (2002) Computerised video tracking, movement analysis and behaviour recognition in insects. Comput Electron Agric 35:201–227
Ohta I, Kakuma S (2005) Periodic behavior and residence time of yellowfin and bigeye tuna associated with fish aggregating devices around Okinawa Islands, as identified with automated listening sta-tions. Mar Biol 146:581–594
Olsen K, Angell J, Pettersen F, Løvik A (1983) Observed fish reactions to a surveying vessel with special reference to herring, cod, capelin and polar cod. FAO Fish Rep 300:131–139
Parin NV and Fedoryako BI (1999) Pelagic fish communities around floating objects in the open ocean. In: Scott M.D., Bayliff W.H., Lennert-Cody C.E. and Schaefer K.M. (eds.), Proceedings of the International Workshop on the Ecology and Fisheries for Tunas Associated with Floating Objects, February 11-13, 1992. Inter-American tropical tuna commission special report 11, La Jolla, California, pp. 447–458
Pitcher TJ (1983) Heuristic definitions of shoaling behaviour. Anim Behav 31:611–613
Romanov EV (2002) By-catch in the tuna purse-seine fisheries of the western Indian Ocean. Fish Bull 100:90–105
Simmonds EJ, MacLennan DN (2005) Fisheries acoustics. Theory and practice. Blackwell Publishing, Oxford
Spruijt BM, Hol T, Rousseau JBI (1992) Approach, avoidance, and con-tact behavior of individually recognized animals automatically quantified with an imaging technique. Physiol Behav 51:747–752 Stolte S (1994) Short-wave measurements by a fixed tower-based and a
drifting buoy system. IEEE J Ocean Eng 19:10–22
Taquet M (2004) Le comportement agrégatif de la dorade coryphène (Coryphaena hippurus) autour des objets flottants. PhD Thesis, 168 pp. (Université de Paris 6: Paris, France)
Taquet M, Sancho G, Dagorn L, Gaertner JC, Itano D, Aumeeruddy R, Wendling B, Peignon C (2007) Characterizing fish communities associated with drifting fish aggregating devices (FADs) in the west-ern Indian Ocean using underwater visual surveys. Aquat Living Resour 20:331–341
Trenkel VM, Lorance P, Mahévas S (2004) Do visual transects provide true population density estimates for deep-water fish? ICES J Mar Sci 61:1050–1056
Trygonis V, Georgakarakos S, Dagorn L, Brehmer P (2016) Spatiotemporal distribution of fish schools around drifting fish ag-gregating devices. Fish Res 177:39–49
Wilson CD (1998) Field trials using an acoustic buoy to measure fish response to vessel and trawl noise. J Acoust Soc Am 103:3036– 3036