HAL Id: hal-02891603
https://hal.archives-ouvertes.fr/hal-02891603
Submitted on 13 Jul 2020
HAL is a multi-disciplinary open access
archive for the deposit and dissemination of
sci-entific research documents, whether they are
pub-lished or not. The documents may come from
teaching and research institutions in France or
abroad, or from public or private research centers.
L’archive ouverte pluridisciplinaire HAL, est
destinée au dépôt et à la diffusion de documents
scientifiques de niveau recherche, publiés ou non,
émanant des établissements d’enseignement et de
recherche français ou étrangers, des laboratoires
publics ou privés.
Karst and urban flood-induced solid discharges in
Mediterranean coastal rivers: The case study of Las
River (SE France)
Christiane Dufresne, Bruno Arfib, Loic Ducros, Céline Duffa, Frank Giner,
Vincent Rey
To cite this version:
Christiane Dufresne, Bruno Arfib, Loic Ducros, Céline Duffa, Frank Giner, et al.. Karst and urban
flood-induced solid discharges in Mediterranean coastal rivers: The case study of Las River (SE
France). Journal of Hydrology, Elsevier, 2020, pp.125194. �10.1016/j.jhydrol.2020.125194�.
�hal-02891603�
Karst and urban flood-induced solid discharges in
Mediterranean coastal rivers: The case study of Las River (SE
France)
Christiane Dufresne
a,b,c*, Bruno Arfib
d, Loïc Ducros
b,e, Céline Duffa
b,
Frank Giner
b, and Vincent Rey
ca. Institut des sciences de la mer de Rimouski, Université du Québec à Rimouski, 310 allée des Ursulines,
Rimouski QC, G5L 3A1, Canada
b. Institut de Radioprotection et de Sureté Nucléaire (IRSN), PSE-ENV, SRTE/LRTA, BP 3, 13115,
Saint-Paul-lez-Durance, France
c. Université de Toulon, CNRS/INSU, IRD, Mediterranean Institute of Oceanography (MIO), UM 110,
83041 Toulon Cedex 09, France. / Aix Marseille Université, CNRS/INSU, IRD, Mediterranean Institute of Oceanography (MIO), OSU PYTHEAS, UM 110, 13288 Marseille, France
d. Aix Marseille Univ, CNRS, IRD, INRAE, Coll France, CEREGE, Aix-en-Provence, France. email :
arfib@cerege.fr
e. Université de Nîmes, EA7352 CHROME, Laboratoire GIS, Parc scientifique et technique G. Besse, 150
rue Georges Besse, 30000 Nîmes, France
* corresponding author: christiane_dufresne@uqar.ca
Dufresne C., Arfib B., Ducros L., Duffa C., Giner F., Rey V. (2020) Karst and urban flood-induced solid discharges in Mediterranean coastal rivers: The case study of Las River (SE France). Journal of Hydrology. https://doi.org/10.1016/j.jhydrol.2020.125194
Abstract
Rivers solid discharge represents a substantial environmental issue, especially for the coastal marine environment. Unlike continental climate rivers, Mediterranean rivers show large discharge variability linked to rainfall, runoff and groundwater discharge, and can be temporary dry. Solid yields are difficult to predict due to variable source of floodwater. This paper assesses the suspended solid discharge of the Las River (SE France), a small stream in karst and urban environments, and its proportion due to flood events. Floods characteristics are analyzed to explore the variability of the solid yield and the influence of urban runoff and karst springs discharge, based on in situ data. The 35 floods events monitored during a 17 months survey largely contributed to the annual yield, with a proportion of 47% of the total water, and 69% of the total solid yielded in 11% of the time. The total rainfall and the total water discharge, related to the water levels in karst springs, drive the total solid yield, mostly composed of mud (90%). Urban runoff induces higher suspended solid concentration than karst flood, but generated a lower total solid yield. Karst springs, by expanding the catchment area of the stream, largely contribute to the total volume of water discharged to the sea and enhance the sand proportion due to their influence on the maximal water discharge. These results reveal the strong influence of the karst spring hydrodynamic functioning on the sediment yield to Mediterranean coastal environments. This study also highlights the efficiency of electric conductivity data to provide valuable insights about floodwater sources and sediment transport processes.
Keywords
Solid discharge; flood; runoff; urban stream; karst spring; Bay of Toulon
Highlights
• 69% of the total solid yield of the Las River occur during flood events • Solid discharge is composed at 90% of mud
1. Introduction
Coastal areas are very sensitive zones impacted by many anthropogenic and natural factors, where continental activities strongly influence the marine environment through rivers discharges. Sediments play an essential role in both aquatic and marine environments, as they influence nutrients dynamics but also contribute to contaminants transport. Although essential for bio-geochemical activities and responsible for some marine pollution, sediment fluxes in small rivers are poorly documented. Rivers solid discharge thereby represents a substantial environmental issue, especially for the coastal marine environment. Unlike continental climate rivers, Mediterranean rivers show large discharge variability (Struglia et al. 2004) and solid yields are difficult to predict due to variable rainfall events and rivers temporary character (De Girolamo et al. 2015). A temporal average is barely significant because of the considerable discharge variation between the low flow and flood. Hydrologic sources include karst springs, rainfall events and urban runoff, while anthropogenic activities and uses of the watershed primarily impact rivers discharge (Cudennec et al. 2007). One may then be concerned by rivers solid discharge in coastal areas, especially in a Mediterranean highly touristic and marine-based economic region.
Quantification of sediment fluxes is all the more important in the Mediterranean region and arid and semi-arid areas, given that long dry periods and intense rainstorms cause unpredictable flash-flood of not only rivers but also temporary streams (Gaume et al. 2009). A single flash-flood event may alter the physical characteristics of the seawater column near the river’s outlet for several days and its surface water for one month (Capello et al. 2016). Small rivers and ephemeral streams are generally un-gauged and little studied due to their limited economic impact, despite the need to understand their dynamics and processes (Tzoraki
et al. 2007, Skoulikidis & Amaxidis 2009). Temporary rivers catchments yet represent 30% of the
Mediterranean region (Moraetis et al. 2010), and their solid discharge might represent a significant proportion of total solid yield. For instance, Nicolau et al. (2012) estimated that flood discharge of the Eygoutier River (southern France, catchment ~ 70km2) was responsible for more than 90% of the annual
yield of suspended solids and particulate copper (Cu), zinc (Zn), cadmium (Cd) and lead (Pb). Large flood event in the Têt River (southern France, catchment ~1400 km2) yielded about half of the annual total load
within only a few days (Bourrin et al. 2008). Between 1980 and 1999, 78% of the total sediment was discharged from the Têt River to the Gulf of Lion (Western Mediterranean) within 50 days (Serrat et al. 2001). The solid discharge due to floods events in small coastal Mediterranean rivers is expected to contribute significantly to the total solid yield. Small rivers and urban streams have yet been understudied, but their contributions are commonly crucial for the local economy, flood risk assessment and management, and water supply (Skoulikidis et al. 2017). Their solid yields are also essential for the sedimentary budget of the entire marine system.
Triggered by rainfall, snowmelt or karst springs, flood events characterization usually relies on water discharge. Several other hydrological parameters and flood characteristics also provide insights on the solid discharge and the total yield. The event duration (López-Tarazón et al. 2010), the highest water discharge during the flood (Alexandrov et al. 2003, Zabaleta et al. 2007, López-Tarazón et al. 2010, López-Tarazón
et al. 2012) and the total water volume (Serrat et al. 2001, Meybeck et al. 2003, López-Tarazón et al. 2010)
are used in several studies to characterize flood events. Suspended solid characteristics, like the highest suspended solid concentration (SSC) (Meybeck et al. 2003, Zabaleta et al. 2007, Nadal-Romero et al. 2008), the total suspended sediment yield (Serrat 1999, Meybeck et al. 2003, Zabaleta et al. 2007) and the grain-size characteristics (Antonelli et al. 2008) shed light on the solid discharge variability. Finally, rainfall parameters such as the total rainfall, the rainfall intensity and the antecedent rainfall (Jungerius & ten Harkel 1994, Alexandrov et al. 2007, Zabaleta et al. 2007, Nadal-Romero et al. 2008, López-Tarazón et al. 2010) may also impact the solid discharge.
Because the electric conductivity (EC) acts as a tracer of the source of water and mixing processes, it has also been used to characterize flood events (e.g. Pilgrim et al. 1979, Valdes et al. 2006, Pellerin et al. 2008, Meriano et al. 2011). Rainwater, coming from evaporation and then condensation, has a very low EC (around 0 μS·cm-1). Following contact with surrounding soils, runoff may increase stream conductivity
(Robson et al. 1993). Karst springs also show specific EC that may act as a signature and lead to identify hydrological processes, provided that the water EC is sufficiently distinct to distinguish the different contributions to the discharge. The flood event characteristics might thus be linked to the water sources (runoff or karst) with EC data (i.e. Robson et al. 1992, Valdes et al. 2006, Perrin & Tournoud 2009). In this study, we focus on the Las River, in southern France, a typical small karst and urban Mediterranean coastal river. Carbonate rocks occupy 21.6% of the European land surface (Chen et al. 2017), where they form the dominant coastal rock in the northern part of the Mediterranean Sea (Fleury et al. 2007a). Mostly forming karst aquifers, their recharge area is usually distinct from the watershed. By enlarging the total catchment area of a stream, karst aquifers often increase both the water discharge and the sediment reserve.
Karst aquifers also have a peculiar hydrodynamic functioning due to large and permeable conduits, related to the speleogenetic history of the carbonate rocks (Jouves et al. 2017). Groundwater flows through the karst network and converges to the springs that concentrate the water discharge in few outlets. Karst springs discharge is then highly variable and can lead to flash-flood (Gaume et al. 2009, Fleury et al. 2013). This paper aims to assess the total solid yield of a small urban river to the Mediterranean Sea and to explore floods characteristics influencing its solid discharge. Not only we estimate the annual solid yield, but we also analyze hydrological data from 35 events to focus on floods characteristics and to assess the solid discharge variability. More specifically, our goals are 1) to estimate the annual solid yield and its proportion due to flood events; 2) to characterize different types of flood events with EC, and 3) to identify environmental parameters that influence floods and their solid discharge.
2. The case study of the Las River
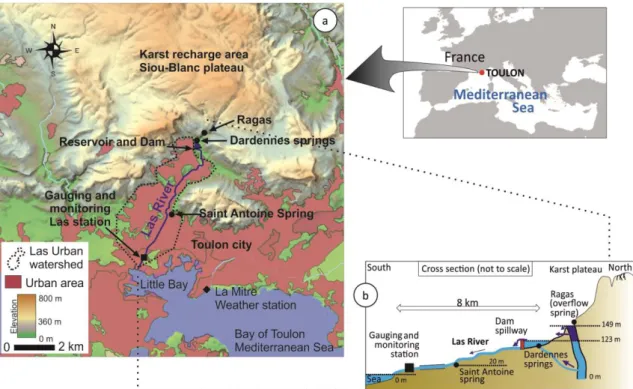
Located in the south of France, on the Mediterranean coast (Fig. 1), the Las River is a small urban stream (8 km long) flowing through the city of Toulon (170 000 inhabitants, population density of 4000 inhabitants per km2). It is the only river flowing into the Little Bay, the western sub-basins of the Bay of Toulon that
shelters the military and civilian harbors. The Bay of Toulon is submitted to intense anthropogenic pressure (French Navy, commercial traffic, industry, raw sewage) where many economic activities (nautical and touristic activities, mussel and fish farming) take place. Previous studies have shown the high contamination of the bottom sediment of the Bay of Toulon (Tessier et al. 2011, Dang et al. 2014, Dang et al. 2015), demonstrating the need to understand the hydro-sedimentary processes and sources of sediment supply. The suspended solid yield to the Bay remains the missing link for such processes and represents a gap to fulfill to further understand, explain and conserve its coastal system. Because of its high population density and its strong influence on economic activities, the Las River is a proper case study location, with typical Mediterranean climate conditions, various uses of the watershed, several hydrologic sources and a crucial necessity for water supply.
2.1. Catchment
The area has a typical Mediterranean climate with mild winters and dry summers. The 30-year interannual rainfall is 640 mm with less than 55 rainy days per year on average (Toulon weather station, Météo-France, 2017).
The Las River catchment area is dual, composed of a groundwater recharge area supplying the karst springs and a surface watershed around its valley. Jurassic and Cretaceous carbonate rocks (mainly limestone and dolostone) form the geological environment and an extensive karst system covers the surrounding area. Karst features, including sinkholes, dolines, polje, karren and caves, favor the concentration of water infiltration and create a very dynamic aquifer, with fast and significant variation of flow rate (Baudement
et al. 2017). This limestone plateau (Siou-Blanc) is a large catchment area (~70 km2) for groundwater
recharge of the Dardennes aquifer, mainly discharging at the Dardennes springs (Baudement et al. 2017). Karst springs provide the seasonal varying low-flow water discharge in the Las River and cause karst floods during rainfall events. Diversified land-use characterize the watershed, ranging from natural and former agricultural land upstream, to urban areas close to the Las valley and the Mediterranean Sea. A large part of the rainfall infiltrates over the karst natural or formal agricultural land, and surface runoff is almost nil on the carbonate hills. Runoff is then roughly limited to the downstream urban area, covering an area of 14 km2, and the urban drainage network transports water that converges from hills to the Las valley.
2.2. Karst springs and river morphology
Two main karst springs are referenced (Fig. 1): the Dardennes springs at the upstream location of the Las valley (8 km from the sea) and the Saint-Antoine spring (3.6 km from the sea). The latter’s discharge ranges from 0.01 m3·s-1 to 4 m3·s-1 (Arfib, unpublished data, 2019). Other springs exist with insignificant discharge
(as the Baume de Dardennes spring) and may be negligible compared to the two previous zones.
The Dardennes springs are of significant importance for the city of Toulon since they provide drinking water for more than a century. Downstream the springs, a dam built in 1913 creates a reservoir which provides drinking water during the low flow period (maximum stored volume 1.1·106 m3). The reservoir
a near-bottom current which prevents the settling of sediments in the reservoir and favours a solid discharge to the Las River through the water treatment plant.
The natural discharge of the Dardennes springs is close to 0.1 m3·s-1 during the low-flow period in summer,
withdrawn for the freshwater supply. During floods, karst discharge can exceed 20 m3·s-1 and is closely
linked to the rainfall amount over the recharge area (Baudement et al. 2017). A vauclusian overflow spring, called “Ragas” spring and located 500 m upstream the reservoir, discharges groundwater during flood events when a threshold level at 149 m a.s.l. is exceeded. The Ragas karst conduit acts as a natural piezometer in the karst network, and its level (HRagas) reflects the periods of a possible high contribution of
karst groundwater to the Las River.
The Las river has a straight channel, constrained by the hill slopes surrounding the valley. Its width is almost constant, 10 m large. The water height ranges from few centimeters at low-flow to two meters in flood, and its bed is natural with coarse pebble and gravel. The gradient is high, 14 per mil in average between the Dardennes springs and Saint-Antoine spring. The downstream 3 km have been channelized, the first 2km with concrete.
Fig. 1. (a) Location of the Las River catchment with karst springs (dots), reservoir and dam, monitoring station (square) and La Mitre Météo-France weather station (diamond); (b) schematic cross-section of the Las River
3. Methodology
3.1. Instrumental setup
We assessed the solid discharge with climatic datasets and hydrological observations recorded both at the source and the mouth of the Las River. The location of the monitoring station near the river’s mouth was selected accordingly to accessibility and technical constraints (square in Fig. 1), as far downstream as possible. The vast majority of tributaries (such as possible underground springs, stormwater outlet, urban runoff) were thus taken into account. A 2 meters high waterfall located 100m upstream the monitoring station favors a complete mixing of the water column and homogeneous SSC. We assumed that recorded data is representative of the entire vertical cross-section and consequently, of the solid discharge to the sea. A multi-parameter probe and a sediment trap were deployed continuously for 17 months, from October 2012 to March 2014. The multi-parameter probe recorded temperature, pressure, turbidity and electric conductivity data every 5 minutes. The sediment sampler, fully described by Phillips et al. (2000), is designed to trap suspended matter that flows in the stream by slowing down the ambient flow, which induces sedimentation by settling. Its efficiency in trapping a representative time-integrated sample of the suspended solid discharge has been showed (Phillips et al. 2000, Russell et al. 2000) and verified for the Las River (see Appendix A). Sediment trap samplings were processed with a laser diffraction particle size
analyzer that provides size distribution in volume with a sizing range from 0.04 to 2000 µm. 155 water samples were also collected punctually at the same station to estimate the SSC and to convert the recorded turbidity data into concentration. Upstream, near the river’s sources, CTD probes were deployed to characterized the three karst springs (Ragas, Dardennes, Saint Antoine) at a 15 minutes time-step.
3.2. Rainfall and water discharge
The French meteorological network Météo-France provided the rainfall data, recorded at La Mitre weather station (diamond in Fig. 1). This station is located 4 km from our monitoring station, close to the sea, in the same climatic environment. Using only one rain-gauge, we assume that the rainfall is homogeneous over Toulon city and the Las catchment, and so this station is representative of the rainfall over the urban watershed of the Las River. For further discussion about the rainfall over the karst recharge area, out of the scope of this paper, several rain-gauges must be used to capture the rainfall heterogeneity, as done in Baudement et al. (2017).
The Las River flow was estimated with a rating curve, linked to the water height at the monitoring station (square in Fig. 1). The rating curve was established with 41 discharge measurements carried out with the dilution method by injection of a fluorescent dye (Schnegg et al. 2011, Lamarque 2014) between August 2013 and January 2014 (during the monitoring period).
3.3. Data analysis
3.3.1. Relationship turbidity/suspended solid concentration
The SSC is deduced from turbidity data, which indicates the water opacity. Establishing a single relationship between the turbidity data and the SSC for each monitoring station is essential, since the suspended matter characteristics (e.g. size, mineralogy) (Lenzi & Marchi 2000) influence the turbidity response and might change depending on the location. We established a specific NTU/SSC relationship for our monitoring station from the recorded turbidity data and the SCC from water samplings filtrations (see appendix B).
3.3.2. Selection of flood events
We selected flood events based on the water discharge by using the Filtered Peaks Over Threshold (FPOT) method (Claps & Laio 2003). All the local maxima of the time series were first selected and filtered (step 1) to obtain a sequence of discharge rises relative to the base level preceding the event. A second filter was applied to retain only the largest peaks (step 2) and to ignore the smallest events and false peaks induced by the noise component of the signal. A threshold of 1 m3·s-1 was defined graphically to be higher than the
daily noisy discharge variations and to keep a maximum of relevant flood events. A lower value would have included a small number of additional short events, with a minor impact on the volume of water and the total solid discharge. However, this threshold is a key factor for flood frequency analysis (Lang et al. 1999, Bezak et al. 2014), and the time-series should be reprocessed for further analysis. When several peaks succeed one another within less than 12 hours, successive floods peaks were merged in one single flood event (Fig. 2).
3.3.3. Characterizing flood events
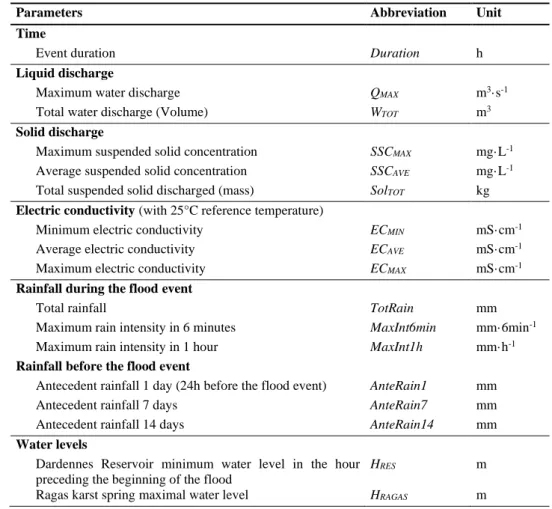
Events-based characteristics regarding hydrological features, the suspended solid discharge and rainfall for each flood events are summarized in Table 1, with their abbreviation and units. The duration of selected events is based on the start and the end times. The start time is taken when the water discharge started to increase. The end of the event is, by contrast, not trivial and depends on the shape of the recession limb of the hydrograph. Flood recession hydrographs have been commonly described by a rapid falling limb followed by one or a series of exponential recessions, which are characterized by one or several slopes depending on the baseflow variations (Chow 2010). We adopted a method to include the rapid falling limb and the first baseflow recession time. The flood event thus lasts until the inflection point at the end of the first baseflow recession slope (Fig. 2). This method has the advantage to be easily applied and integrates the flood peak and the first part of the delayed recession flow while excluding the effects of a long tailing discharge recession.
Fig. 2 Method to identify the start and end time of the flood events. Example for the event of the 8th of September 2013, with two peaks and 2 main recession slopes after
a rapid falling limb of the hydrograph.
Rainfall characterizes the events with the total rainfall during the flood event and rainfall intensities (6min and 1h). Because rainfalls frequently occur before the increase of the water discharge (and consequently before the beginning of the selected flood event), previous rainfalls are also taken into account (antecedent rainfalls parameters).
Relationships among all of these parameters are investigated with a Pearson correlation matrix, an appropriate analysis to identify factors that might control the measured hydrological and sedimentary responses (Zabaleta et al. 2007, Nadal-Romero et al. 2008).
Table 1: Names, abbreviation and units for the event-based parameters used to describe the selected 35 flood events
Parameters Abbreviation Unit
Time
Event duration Duration h
Liquid discharge
Maximum water discharge QMAX m3·s-1
Total water discharge (Volume) WTOT m3
Solid discharge
Maximum suspended solid concentration SSCMAX mg·L-1
Average suspended solid concentration SSCAVE mg·L-1
Total suspended solid discharged (mass) SolTOT kg
Electric conductivity (with 25°C reference temperature)
Minimum electric conductivity ECMIN mS·cm-1
Average electric conductivity ECAVE mS·cm-1
Maximum electric conductivity ECMAX mS·cm-1
Rainfall during the flood event
Total rainfall TotRain mm
Maximum rain intensity in 6 minutes MaxInt6min mm·6min-1
Maximum rain intensity in 1 hour MaxInt1h mm·h-1
Rainfall before the flood event
Antecedent rainfall 1 day (24h before the flood event) AnteRain1 mm Antecedent rainfall 7 days AnteRain7 mm Antecedent rainfall 14 days AnteRain14 mm
Water levels
Dardennes Reservoir minimum water level in the hour preceding the beginning of the flood
HRES m
3.3.4. Sources of water
The discharge water of the Las River originates from different sources, mixed in various proportions. We distinguish the two karst groundwater discharge zones (Dardennes springs and Saint-Antoine spring) and the urban runoff of the city of Toulon with the water levels in the karst springs and the EC at the monitoring station. Main karst flood events from Dardennes springs are characterized by a disconnection between the water levels from the Ragas spring (HRagas) and the Dardennes reservoir (HRES), with a peak water level up
to the Ragas cave threshold (149 m a.s.l). The 123 m a.s.l. threshold of the Dardennes reservoir controls the discharge of karst groundwater to the Las river. Rocks of the aquifer and the residence time of groundwater induce different EC, representative of the Total Dissolved Solids in the water column. EC values act as a signature for different sources of water, identified with CTD measurements in karst springs. EC of the runoff water in Toulon has been measured during rainfall event in road gutter draining stormwater.
We defined three categories of floodwater sources in the river. (i) An increasing water discharge combined with runoff EC values and an unchanged karst level creates an urban runoff (UR) flood only due to rainfall. (ii) The groundwater from Dardennes karst springs fills the reservoir and only supply the river when overflowing the dam spillway (HRES > 123 m a.s.l.). This karst overflow (KO) creates a sudden rise of the
river discharge combined with characteristic EC values of the Dardennes springs. (iii) To prevent this massive water discharge, managers occasionally open the dam’s valves, usually during and after a karst flood. This management (M) maintains HRES under 123 m a.s.l. and sustains the discharge for a few days
(slow recession). All combinations of sources of water are possible (UR and/or KO and/or M).
4. Results
4.1. Las River hydrological response
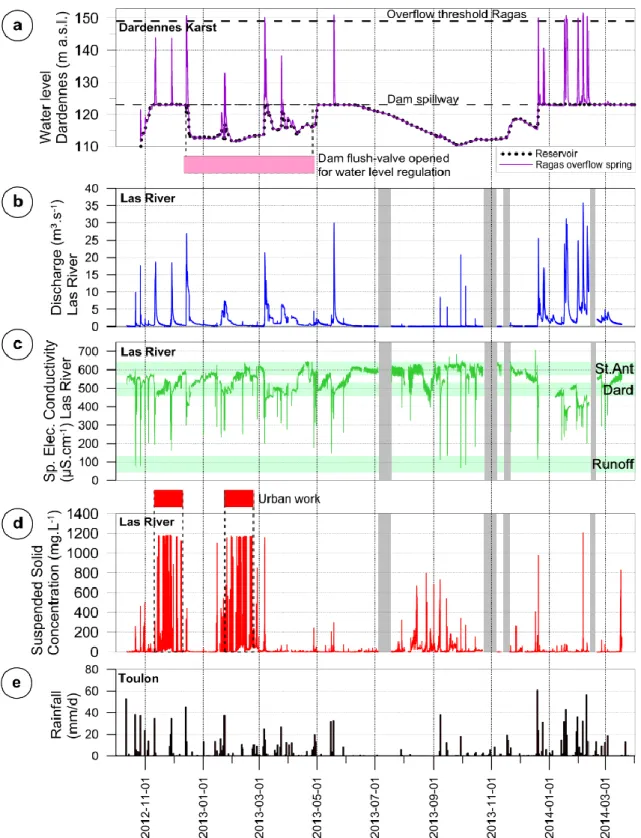
Data is available for 462 days over 522 days of in-situ monitoring and shows the highly variable hydrological response of the Las River (Fig. 3). The water discharge (Q) shows significant variations, ranging from 0.01 to 37.5 m3·s-1 (Fig. 3b). The mean discharge (Q
AVE) is about 1.66 m3·s-1, and the total
volume of water discharged (WTOT) (in 462 days) is 74·106 m3. Q was higher than QAVE for 101 days, which
yield a water volume of 59·106 m3. Consequently, 80% of the total water volume is discharged to the sea
in less than 22% of the time.
Each of the water sources of the Las catchment has a specific EC signature and their contributions induce fluctuations of EC within the river (Fig. 3c). The EC of the Dardennes springs ranges from 440-520 μS·cm -1 (mean=481 μS·cm-1, st.d.=23 μS·cm-1, n = 49421), and could reach 400 μS·cm-1 for heavy rainfall. The
Saint-Antoine spring has an EC signature of 550-650 μS·cm-1 (mean=602 μS·cm-1, st.d.=34 μS·cm-1,
n = 50113). Runoff low EC value is highly different from the karst groundwater and is within the same range of other urbanized area (Meriano et al. 2011), with a mean around 80 μS·cm-1 (st.d. 27 μS·cm-1,
n = 37).
During low flow, EC in the river is close to 600 μS·cm-1, i.e. with the main contribution from the
Saint-Antoine Spring (downstream from the dam). Floods globally induce a decrease of EC with fast drop to less than 100 μS·cm-1 due to the input of rainstorm and intermediate values (450-500 μS·cm-1) from Dardennes
springs (including the Ragas spring overflow). During the flow recession following a flood, EC increases from 450 to 600 μS·cm-1 with mixed water from Dardennes springs and Saint-Antoine spring.
The water level in Dardennes springs shows the seasonality of the hydrological response of the Las River. During the warm and dry season (June to October), rainfalls are scarce and the water level in the karst decreases. The water level in the reservoir remains below 123m and runoff largely contributes to the river’s discharge, as depicted by low EC values in the river (e.g. September, October 2013). As the first autumn rainfalls refill the karst, the water levels in Dardennes springs and in the reservoir increase with little influence on Q. Contributions of Dardennes springs significantly increase once the water level in the reservoir reaches the dam spillway threshold (123m), or when flush-valves are opened.
Fig. 3 (a) Water levels at Dardennes springs, (b) water discharge (m3·s-1) in the Las
River, (c) Specific Electric Conductivity (µS·cm-1) at the monitoring station with the
range of values for sources of water Saint-Antoine spring (St.Ant), Dardennes springs (Dard) and runoff in light green, (d) suspended solid concentration (mg·L-1), and (e)
4.2. Suspended solid discharge
4.2.1. Suspended solid concentration
In low-flow, the average SSC is 5 mg·L-1, while during floods SSC reaches more than 1000 mg·L-1. One
may note that this value is out of the manufacturer range, up to 1000 NTU matching to 996 mg·L-1 (with
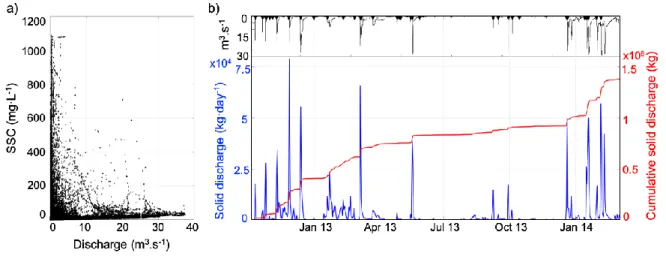
Eq.B.1 in Appendix B). Values over this threshold might thus be misestimated. However, these very high SSC values mostly recorded in November 2012 and February 2013 were not due to flood events. Most of the largest SSC over this period were recorded in low flow and are most likely due to road works (Fig. 3d). Other high SSC values might be caused by unauthorized discharge or obstruction of the turbidity probe by floating wastes at the end of summer and autumn 2013. Despite the high SSC induced by those events, the associated solid yield is low regarding Q and the total solid yield to the Bay. The SSC time-series from November 2013 to March 2014 (end of available data) (Fig. 3d) shows a more natural evolution, with SSC peak related to rainfall events. Despite the apparent impact of the flood and water discharge on the suspended load, no clear relationship links SSC to Q (Fig. 4a), and the highest water discharges do not directly lead to the highest suspended loads.
The SSC is multiplied with Q at each time-step to deduce the solid flux. The solid flux increases during flood events and is usually comprised between 2 and 5 kg·s-1 with a maximum value of 14 kg·s-1. The
typical step-shape of the cumulative daily solid discharge plot (Fig. 4b) clearly shows the short main discharge periods and the decisive influence of flood events. About 1340·103 kg of suspended matters were
brought to the sea during the recorded 17 months period, including two winters but only one summer. To assess the annual discharge, we calculated a 365-days moving average, which leads to an approximate annual yield of 707·103 kg ·y-1 (s.d. 108·103 kg). Approximately 1050·103 kg of suspended solid were
yielded when Q was exceeding QAVE: 78% of the solid yield is carried in 22% of the time.
Fig. 4. a) Suspended sediment concentration (SSC, mg·L-1) against discharge (Q,
m3·s-1); b) Discharge (Q, m3·s-1) (black), Solid discharge (kg·day-1) (blue) and
cumulative solid yield (kg) (red) from October 2012 to March 2014. Black arrows mark selected flood events.
4.2.2. Grain-size characterization of the suspended solid discharge
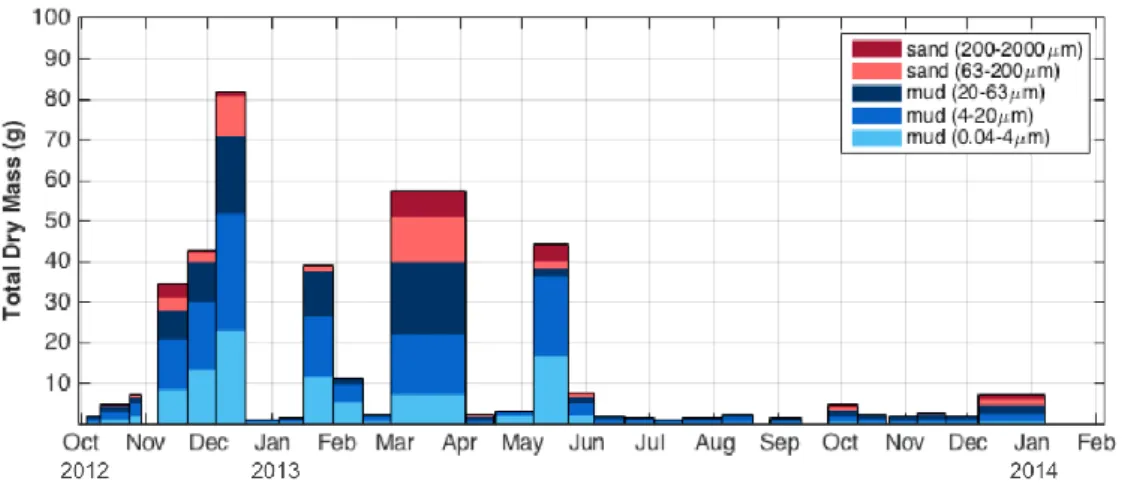
Grain-size analyses were conducted on the 28 samples from the sediment trap to characterize the suspended matter of the Las River. Most loaded samples are from flood season, with a highest total dry mass in fall and spring. Fig. 5 shows the proportion of 5 grain-size classes (0.04–4 µm, 4–20 µm, 20–63 µm, 63– 200 µm, 200-2000 µm) for the samples, with mud (D<63 µm, 3 classes) in blue shades and sand (D>63 µm, 2 classes) in red shades. Mud composes almost 90% of the total sediment yield (Table 2). Fine silt (4-20 µm) shows the biggest proportion, with 40.6% on average. The smallest clay particles (0.04-4 µm) compose a quarter of the sediments collected, but also show the greatest variability (s.d. 13.6). Some samples stand out with high sand proportions, as in March-April 2013, September-October 2013 and in December 2013, when sand composes almost 30% of the sediment samples (Fig. 5).
Fig. 5 Proportion of each grain-size class for the 28 sediment samples with mud in blue and sand in red. The width of bars is proportional to deployment duration.
Table 2. Mean proportion (%) and standard deviation of sediment samples for each grain-size class and gathered in mud (<63µm) and sand (>63µm) type.
Sediment class (µm) Proportion (%) [St. deviation]
Mud 0.04-4 24.6 [13.6] 4-20 40.6 [6.8] 20-63 24.5 [9.9] Sand 63-200 6.9 [5.7] 200-2000 3.3 [4.7]
4.3. Flood events characterization
Based on the methodology described in section 3, we selected 35 flood events (Table 3) which were characterized with parameters identified in Table 1 and sources of water as described in section 3.3.4. Selected floods events lasted between 2.3 h and 162.5 h (6.8 days) and are characterized by rainfalls ranging from 0 mm to 81.7 mm. Flood events yielded between 11.5·103 m3 and 5.54·106 m3 of water and between
408 kg and 105·103 kg of suspended solids, with SSC
AVE between 4 mg·L-1 to 408 mg·L-1. These events
contributed to approximately 47% of the total water discharge and about 69% of the total solid yield. Summed up, these events durations represented 1188 h (~49.5 days), being 11% of the studied period. According to the hydrograph, karst water levels and EC, we identified 20 UR floods, 3 KO floods and 12 floods from mixed sources: 9 UR and KO, 2 UR and M, and 1 UR, KO and M.
We investigated the flood characteristics with a Pearson correlation matrix (Table 4) with regards to the solid yield. Very significant correlations (with an assumption of non-correlation p inferior to 0.01) are in bold and significant correlations (p<0.05) are underlined. The positive and very significant correlation between WTOT, QMAX and SolTOT shows the influence of the water discharge on the solid discharge. Similarly,
the positive and very significant correlations between SolTOT and both TotRain and HRAGAS suggest that
higher total rainfalls and higher water levels in the Ragas spring increase the solid discharge. The floods events characteristics and their impact on the solid discharge are further discussed in the following section.
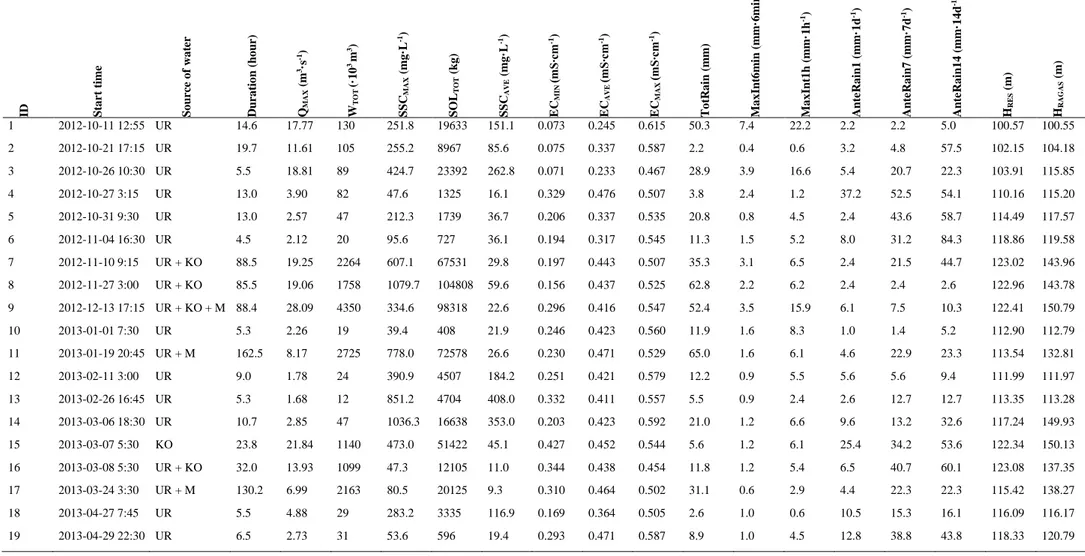
Table 3: Flood events characteristics. UR: urban runoff; KO: karst overflow; M: dam opening management. Refer to Table 1 for abbreviations and units. ID Sta rt t ime S o u rc e o f w a te r D u ra ti o n ( h o u r) QM A X (m 3·s -1) W TO T (· 1 0 3 m 3) SSC M A X ( mg ·L -1) S OL TO T ( k g ) SSC AVE ( mg ·L -1) EC M IN (mS∙c m -1) EC A V E (mS∙ cm -1) EC M A X (mS∙c m -1) T o tR a in ( m m) M a x In t6 m in ( m m·6 mi n -1) M a x In t1 h ( m m·1 h -1) A n te R a in 1 ( m m·1 d -1) A n te R a in 7 ( m m·7 d -1) A n te R a in 1 4 ( mm ·1 4 d -1) HR ES ( m) HR A G A S ( m) 1 2012-10-11 12:55 UR 14.6 17.77 130 251.8 19633 151.1 0.073 0.245 0.615 50.3 7.4 22.2 2.2 2.2 5.0 100.57 100.55 2 2012-10-21 17:15 UR 19.7 11.61 105 255.2 8967 85.6 0.075 0.337 0.587 2.2 0.4 0.6 3.2 4.8 57.5 102.15 104.18 3 2012-10-26 10:30 UR 5.5 18.81 89 424.7 23392 262.8 0.071 0.233 0.467 28.9 3.9 16.6 5.4 20.7 22.3 103.91 115.85 4 2012-10-27 3:15 UR 13.0 3.90 82 47.6 1325 16.1 0.329 0.476 0.507 3.8 2.4 1.2 37.2 52.5 54.1 110.16 115.20 5 2012-10-31 9:30 UR 13.0 2.57 47 212.3 1739 36.7 0.206 0.337 0.535 20.8 0.8 4.5 2.4 43.6 58.7 114.49 117.57 6 2012-11-04 16:30 UR 4.5 2.12 20 95.6 727 36.1 0.194 0.317 0.545 11.3 1.5 5.2 8.0 31.2 84.3 118.86 119.58 7 2012-11-10 9:15 UR + KO 88.5 19.25 2264 607.1 67531 29.8 0.197 0.443 0.507 35.3 3.1 6.5 2.4 21.5 44.7 123.02 143.96 8 2012-11-27 3:00 UR + KO 85.5 19.06 1758 1079.7 104808 59.6 0.156 0.437 0.525 62.8 2.2 6.2 2.4 2.4 2.6 122.96 143.78 9 2012-12-13 17:15 UR + KO + M 88.4 28.09 4350 334.6 98318 22.6 0.296 0.416 0.547 52.4 3.5 15.9 6.1 7.5 10.3 122.41 150.79 10 2013-01-01 7:30 UR 5.3 2.26 19 39.4 408 21.9 0.246 0.423 0.560 11.9 1.6 8.3 1.0 1.4 5.2 112.90 112.79 11 2013-01-19 20:45 UR + M 162.5 8.17 2725 778.0 72578 26.6 0.230 0.471 0.529 65.0 1.6 6.1 4.6 22.9 23.3 113.54 132.81 12 2013-02-11 3:00 UR 9.0 1.78 24 390.9 4507 184.2 0.251 0.421 0.579 12.2 0.9 5.5 5.6 5.6 9.4 111.99 111.97 13 2013-02-26 16:45 UR 5.3 1.68 12 851.2 4704 408.0 0.332 0.411 0.557 5.5 0.9 2.4 2.6 12.7 12.7 113.35 113.28 14 2013-03-06 18:30 UR 10.7 2.85 47 1036.3 16638 353.0 0.203 0.423 0.592 21.0 1.2 6.6 9.6 13.2 32.6 117.24 149.93 15 2013-03-07 5:30 KO 23.8 21.84 1140 473.0 51422 45.1 0.427 0.452 0.544 5.6 1.2 6.1 25.4 34.2 53.6 122.34 150.13 16 2013-03-08 5:30 UR + KO 32.0 13.93 1099 47.3 12105 11.0 0.344 0.438 0.454 11.8 1.2 5.4 6.5 40.7 60.1 123.08 137.35
20 2013-05-01 21:15 KO 24.0 2.44 170 12.4 702 4.1 0.482 0.493 0.582 0.0 0.0 0.0 0.0 47.3 52.3 122.98 123.22 21 2013-05-16 1:00 UR 6.5 3.83 50 115.8 2193 44.0 0.143 0.214 0.404 12.1 1.0 4.8 20.5 20.5 21.9 122.91 123.00 22 2013-05-18 7:30 UR + KO 64.5 30.99 2616 163.1 67535 25.8 0.333 0.462 0.506 34.6 4.5 11.4 3.8 38.4 39.8 122.97 150.92 23 2013-05-28 15:30 UR 2.3 2.87 13 73.3 629 47.9 0.258 0.350 0.561 2.6 1.0 1.0 5.3 5.3 78.3 122.94 122.92 24 2013-09-08 4:45 UR 11.3 8.96 80 645.5 13469 167.6 0.110 0.238 0.688 38.5 12.1 37.2 3.8 3.8 3.8 112.78 114.03 25 2013-09-15 2:45 UR 14.3 6.24 44 171.8 2862 65.8 0.131 0.277 0.610 15.5 2.5 8.6 1.8 43.9 44.1 112.21 112.21 26 2013-09-29 11:45 UR 8.8 26.53 84 343.6 17274 206.0 0.069 0.346 0.551 16.1 6.3 9.5 1.8 2.4 2.4 110.54 110.80 27 2013-10-04 22:15 UR 5.3 12.83 50 199.3 5628 112.9 0.081 0.227 0.626 26.0 7.2 0.6 0.2 18.3 18.9 110.88 111.17 28 2013-10-14 15:15 UR 9.3 2.80 17 186.0 764 45.9 0.184 0.377 0.652 2.0 1.0 0.2 0.0 3.0 31.6 111.95 112.15 29 2013-12-19 15:30 UR 22.2 10.01 280 183.6 11015 39.3 0.116 0.285 0.582 81.7 2.3 9.3 4.2 4.8 5.8 115.80 149.90 30 2013-12-20 14:45 KO 29.3 26.68 1269 707.6 50102 39.5 0.340 0.420 0.525 0.0 0.0 0.6 83.5 86.5 87.3 123.22 149.97 31 2014-01-13 16:30 UR + KO 9.25 3.20 44 64.6 1319 30.2 0.217 0.362 0.504 12.7 0.8 5.3 1.8 1.8 10.8 123.00 122.60 32 2014-01-16 4:45 UR + KO 51.5 24.73 2560 81.7 45408 17.7 0.235 0.367 0.487 40.3 1.1 6.1 0.0 14.5 22.5 123.02 149.57 33 2014-01-18 14:00 UR + KO 94.0 32.78 5537 83.3 100890 18.2 0.270 0.379 0.403 37.1 2.1 5.5 26.5 77.1 79.1 123.11 150.76 34 2014-01-30 4:30 UR + KO 61.5 25.96 2781 19.2 24159 8.7 0.322 0.406 0.469 40.9 1.3 5.4 17.4 21.2 120.9 123.03 149.93 35 2014-02-05 8:00 UR + KO 51 37.54 3274 163.7 94210 28.8 0.283 0.403 0.449 29.9 1.8 6.7 4.8 73.2 79.4 123.08 151.59
Table 4: Pearson correlation matrix with significant correlation (p<0.05) underscored and very significant correlation (p<0.01) in bold for the selected flood events (n=35). Du ratio n QMAX W TOT SSC M AX SOL TOT SSC A VE EC MIN EC AVE EC MAX T o tR ain Ma x In t6 m in Ma x In t1 h An teR ain 1 An teR ain 7 An teR ain 1 4 HRES Duration QMAX 0.415 WTOT 0.796 0.743 SSCMAX 0.194 0.040 0.000 SOLTOT 0.723 0.779 0.864 0.349 SSCAVE -0.370 -0.182 -0.384 0.582 -0.226 ECMIN 0.233 0.079 0.328 -0.146 0.173 -0.320 ECAVE 0.451 0.068 0.353 0.106 0.312 -0.261 0.784 ECMAX -0.357 -0.419 -0.530 0.213 -0.398 0.286 -0.272 -0.180 TotRain 0.591 0.391 0.492 0.237 0.550 -0.107 -0.282 -0.126 -0.059 MaxInt6min -0.088 0.231 -0.054 0.144 0.060 0.255 -0.497 -0.505 0.406 0.356 MaxInt1h -0.002 0.217 0.050 0.194 0.149 0.229 -0.355 -0.412 0.279 0.461 0.802 AnteRain1 -0.010 0.234 0.134 0.118 0.146 -0.152 0.334 0.177 -0.267 -0.256 -0.220 -0.207 AnteRain7 0.162 0.362 0.379 -0.162 0.304 -0.334 0.496 0.281 -0.430 -0.210 -0.259 -0.265 0.622 AnteRain14 0.060 0.251 0.283 -0.295 0.095 -0.381 0.439 0.226 -0.346 -0.287 -0.387 -0.374 0.451 0.655 HRES 0.299 0.286 0.492 -0.063 0.418 -0.461 0.603 0.428 -0.480 0.028 -0.368 -0.251 0.236 0.361 0.385 HRAGAS 0.569 0.602 0.734 0.162 0.699 -0.316 0.464 0.433 -0.479 0.429 -0.248 -0.068 0.298 0.373 0.328 0.745
5. Discussion
Small rivers and urban streams play a decisive role on the total solid yield to the marine system. Our measurements show that a large proportion of the annual solid yield is due to flood events, but the relationship between the solid discharge and the water discharge is intricate. Investigations on main environmental parameters such as EC provide insights on the floodwater source. This section discusses the key factors of Karst Mediterranean rivers that contribute to the solid yield.
5.1. Mediterranean rivers: rainfall-discharge relationship
Overall, our data shows a typical Mediterranean river with very low water discharge at the basic low-flow level and high peaks during flood events. While our dataset covers a relatively short period of 17 months, our results seem representative and are typical of Mediterranean rivers (e.g. Rovira et al. 2005, Bourrin et
al. 2008, De Girolamo et al. 2015). Discharge variability is similar to wadi rivers (dryland streams also
called oueds), often located in semi-arid climates, where rainfall events might be highly variable both spatially and temporally (Cudennec et al. 2007). Such variable feature triggers runoff flood, but in a dual urban and karst environment like the Las River, largest rainfalls not always produce largest flood. The alternating low flow/flood hydrological regime of the Las River is amplified by the karst, with peculiar flood characteristics.
The hydraulic responses of both karst springs (draining the additional karst recharge area, and with typical karst fast and slow groundwater flows) and the urban watershed (runoff of the city of Toulon) enhance the highly variable discharge. When the Dardennes karst aquifer and the reservoir levels are low (e.g. during summer and autumn), the karst floods are mitigated by natural storage in the saturated and unsaturated zones of the aquifer (Baudement et al. 2017) and by artificial storage in the reservoir. Mediterranean karst aquifers naturally mitigate the first rainfall events during summer and autumn, e.g. in Fontaine de Vaucluse spring (catchment area 1100 km², Fleury et al. (2007b)), Lez spring (catchment area 130 km², Fleury et
al.(2009), Jourde et al.(2014)), or Port-Miou (catchment area 400 km², Arfib and Charlier (2016)). 50 mm
to more than 100 mm of cumulated rainfall is then needed in autumn to recharge those karst aquifers and activate fast groundwater flow generating springs floods. The cumulated rainfall threshold is usually assessed based on the soil and epikarst storage capacity, the non saturated zone storage and the water-table height increase. When the karst aquifer is depleted, the regulated karst water storage in the Dardennes reservoir then favors the observation of UR floods in the Las River. By contrast, during high-water periods, the very dynamic response of the aquifer to Mediterranean rainfall events generates karst floods in the river. Once the karst aquifer has been recharged in autumn, the groundwater becomes the main source of floodwater (KO), with floods lasting for days or weeks after the rainfall event. In the Dardennes case study, the dam forces the water-level to rise above the spillway, which enhances the groundwater level variation. This behaviour is yet typical of vauclusian karst aquifer and would be also observed at the Dardennes springs in natural conditions since several springs discharge at different levels, with the highest, the Ragas spring, overflowing 60 meters above the valley. The regulated karst water storage in the Dardennes Reservoir is a specific characteristic of the Las River directly impacting its discharge, but the effect of karst on floods is not unique and other case study showed that mitigation can be low (Sezen et al. 2019, Watlet
et al. 2020). The highly variable discharge implies that a specific knowledge of Mediterranean rivers yield
is required to better understand the coastal marine environment and develop management tools. Flood events largely contribute to annual yields of the Las River, and our assessment of the solid and liquid discharges is therefore crucial for hydro-sedimentary modeling of the Bay of Toulon (Dufresne et al. 2018).
5.2. Exploring the relationship between water discharge and solid
discharge
The relationship between water discharge and suspended solid concentration is intricate, although the latter increases during flood events. Our results suggest the influence of water discharge on the total solid discharge, with a positive and very significant correlation between SolTOT and discharge characteristics
(WTOT, QMAX). However, no clear relation between SSC and Q is established for the Las River, as the
maximum SSC and the maximum water flow peaks mismatch. This lack of relation is yet not surprising since the link between sediment load and water discharge in fluvial environments is often weak and difficult to assess (i.e. Tournoud et al. 2003, Regüés & Nadal-Romero 2013, Tesi et al. 2013, Aich et al. 2014). The Mediterranean climate and the Las River catchment might explain this lack of Q/SSC relationship. Long dry periods favor sediments retention within the catchment and limit the solid discharge, enhancing the solid load during next flood events. In the Las River, the most loaded events (with highest SSCAVE) often
occur following a dry period, as highlighted by the significant negative correlation between SSCAVE and AnteRain14 (Table 4): little rainfall over the 14-days previous period increases the SSCAVE of a flood event.
Likewise, decreasing SSCAVE for several successive events demonstrates the reduction of sediments
availability (Table 3, e.g. floods #3-4, 14-16). Previous floods have then probably flushed the sediment stock from the watershed, the streambed or the karst. A phenomenon of sediment exhaustion might explain the solid load variability, as the period of the year influences the suspended solid carried within a flood in Mediterranean rivers (Rovira & Batalla 2006). Characteristics of the Las River dual catchment also conceal such relationship between water discharge and solid discharge. A single empirical rating curve between
SSC and Q could hence rarely be defined for Mediterranean rivers.
5.3. Contribution of floodwater sources on solid yield
The positive and very significant correlations between water levels (HRAGAS and HRES) and WTOT clearly
show the influence of the karst water in the Las River (Table 4).The EC data also corroborates the karst water inflows to the river. The positive correlations of ECMIN with the levels HRAGAS and HRES and with
previous rainfall events (AnteRain1, AnteRain7, AnteRain14) capable of filling the karst aquifer confirm the karst contribution to the river’s discharge. The highest the levels are, the highest the ECMIN. Likely, the
direct input of rainwater by urban runoff during intense rainfall (high MaxInt6, MaxInt1h) induces lower
ECMIN (negative correlation): the more intense the rainfall is, the lower the ECMIN. Low ECMIN globally
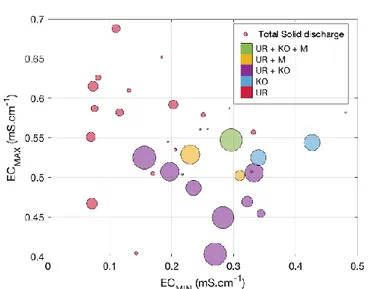
characterizes UR events while karst water increases ECMIN (Fig. 6). The significant and positive correlation
between ECMAX and MaxInt6is yet more intricate, and its interpretation should be handled with care.
Because the maximal EC is usually observed at the beginning of the flood, ECMAX might actually depicts
the water flowing in the river before the event. Maximal values are then observed for high proportions of water from the Saint-Antoine spring, especially at low flow. EC data distinguishes the sources of water as karst springs largely contribute to the WTOT discharged to the sea.
Fig. 6: Maximum electric conductivity (ECMAX, mS.cm-1) against minimum electric
conductivity (ECMIN, mS.cm-1) for each flood event with size depending on total solid
discharge (kg) and colorscale representing the source of water as Urban Runoff (UR), Karst Overflow (KO) and Management of the dam (M).
By impacting the liquid discharge, the source of water also influences the solid yield. The relationships between duration, TotRain, WTOT and SolTOT suggest that largest rainfall events lead to longest floods and
to largest water and solid discharges. Those very significant correlations (Table 4) yet conceal the relative importance of the karst on the solid discharge. The very significant and positive correlations between
HRAGAS, HRES, WTOT and SolTOT reveal that largest events receive contributions of Dardennes springs and that
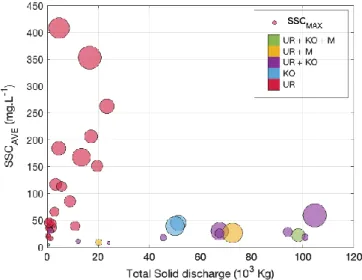
since both karst and runoff events give a wide range of values (large dots in Fig. 7). UR events thus present more loaded floods (highest SSCAVE), but their shorter durations induce lower WTOT and SolTOT than karst
floods.
Fig. 7 Average SSC (mg.L-1) against the total solid discharge (103kg) for each flood
event. with size depending on SSCMAX and colorscale representing the source of water
as Urban Runoff (UR), Karst Overflow (KO) and Management of the dam (M).
The capacity of karst flood to yield a large amount of suspended solid relies on the regulation of the water discharge from karst springs throughout the year. Karst aquifers might store a part of the rainfall water and delay its discharge from several days, with a characteristic time-lag different for each case-study. Although we did not explore this property in this paper, the solid discharge from karst flood might also be expanded by supplementary sources of sediments from the streambed and the karst aquifer itself. The sediment storage and yield in karst watersheds are poorly documented but act as a potential sediment source to the sea that must be further investigated. Karst flood may yield a substantial amount of solid discharge, and the complex geomorphology and the extreme heterogeneity of karst systems require an interdisciplinary approach (Bonacci et al. 2006). In such a complex karst system exposed to flash flood and under dam regulation, the solid discharge is likely to play a decisive role in the erosion and coastline evolution (Bergillos et al. 2016).
5.4. Particles size variation
As small particles exhibit the capacity to transport contaminants, the grain-size of the suspended matter affects the capacity of a river to discharge contamination to the coastal ocean. Cohesive sediments (with mean diameter <63µm) form 90% of the solid yield of the Las River, which implies a considerable contamination pathway. Because of the extended deployment duration of the sediment sampler regarding floods duration (weeks vs hours or days), a critical analysis of samplings and water sources is intricate due to the combination of several environmental factors. Some parameters may still provide insights, such as the water levels in karst springs.
Karst flood events seem to yield coarser sediment, with an increased sand proportion in samples from the wet season (e.g. March, November, December). The positive and significant correlation between HRAGAS
and QMAX may imply a larger sand proportion in the samples, as higher QMAX would increase the water’s
ability to reach the motion threshold for coarser sediments. Samplings with the highest sand proportions also had a common characteristic, as shown in Fig. 3a,b: they all include floods following a long period of low-flow, able to flush sand sediment settled in the Las Valley or the catchment. One abundant source of sand sediment might also be upstream in the Dardennes Reservoir, fed by runoff over the limestone quarry located uphill.
Some results regarding grain-size over the November-December 2012 and February 2013 periods should yet be interpreted with caution. Roadwork in the city of Toulon created disturbed discharges and induced very turbid water at the monitoring station (Fig. 3). Those events likely increased the amount of sediment trapped by the sampler and results are non-characteristic of the Las River’s normal behavior.
Uncertainties due to measurements by grain-size analyzer may also lead to an underestimation of the sand proportion. With a maximum allowed size of 2000 µm, the grain-size analyzer could not detect coarser particles. The sampler's inlet diameter (4mm) constrains the size of the trapped suspended solids, and our study might underestimate the proportion of coarser particles. Coarser sediments are more likely to be bedload transported and might present a significant proportion of the solid yield for large flood events in streams (Vericat & Batalla 2010). Bottom vertical sediment traps would then allow to assess the transport by rolling, sliding, or saltation (hopping). Otherwise, an in situ grain-size analyzer might improve the characterization of the suspended particles discharged by coastal rivers. Using such an analyzer would, however, imply arduous maintenance to avoid measuring drift, not to mention the risk of impacts due to large debris and thief/vandalism risks in urbanized areas and should thus be considered only for safe monitoring station.
Proportions of grain-size classes may not only exhibit events variability but may also evolve within a single flood event. A possible suspended solid concentration gradient between the surface and the bottom might also lead to an underestimation of the total solid yield. For instance, sand proportion increases within a single flood event in the Rhone River, most likely due to the water discharge, the rain intensity and the sediment availability on the watershed (Antonelli et al. 2008). The evolution of the sediment grain size proportion within a flood event is out of the scope of this paper, but we foster future work to focus on sediment load variability at the event’s scale. Particle size variability might introduce errors in the SSC estimation due to its influences on the turbidity/SSC relationship, especially if grain-size varies within a flood (Lenzi & Marchi 2000, Regüés & Nadal-Romero 2013). Despite our similar relationships for low flow and floods events (see Appendix B), we believe that the influence of grain-size variations on turbidity data needs to be further explored.
5.5. Other sources of solid yield
Despite a large amount of total solid discharge by rivers to the coastal ocean, the particulate matter might end up in the marine system through other processes, such as through the air-sea interface. For instance, the annual atmospheric particulate matter deposition might reach 0.2 g·m-2 in the French Alps, 1 g·m-2 in
Central France and 12 g·m-2 in Corsica (Goudie & Middleton 2001). Although seldom, exceptional Saharan
dust event might induce considerable mud deposits, as one reported by Masson et al. (2010) in February 2002 when 13 g·m-2 deposited around the city of Toulon. By assuming a homogeneous deposit over the
Little Bay (9.5 km2), this event possibly led to a solid yield of 123.5 tons of mud. This amount is more than
our biggest total solid yield for one single flood (8th event, 27-30 November 2012) and represents about
15% to 20% of the annual solid discharge (710 tons·y-1 +-110) from the Las River. Atmospheric mud
deposition might reach the same order of magnitude than the annual solid yield from rivers to the Western Mediterranean (Martin et al. 1989) and therefore might act as a major process in the sedimentary budget of the ocean, or at least, of the Western Mediterranean Sea.
6. Conclusion
This study assessed the suspended solid yield of a coastal Mediterranean river and its proportion due to flood events. With an alternating low-flow/flood regime, the Las River provides 69% of solid discharge in 11% of the time, which supports the hypothesis that floods events in coastal Mediterranean rivers largely contribute to the total solid yield. Characterization of flood events allowed the identification of environmental parameters generating large solid discharge. Mostly composed of mud (90%), the solid yield depends on the total rainfall and the total water discharge but is also highly related to the groundwater contribution of karst springs. Comparatively to karst flood, runoff induced higher suspended load (average SSC) but generated a lower total solid yield.
As our results regarding the solid discharge based on in situ data seems reliable, they also highlight the necessity of on-site specific calibration of the turbidity probe. Often laborious, challenging and expensive, fieldwork and measurements may, however, become easier by using simple conductivity probes. Electric conductivity data may accurately describe the floodwater source and provide valuable insights on solid discharges and sediment transport processes. Karst regions are of substantial interest since they contribute
7. Acknowledgements
The authors wish to thank T.Lamarque and SpéléH2O for his involvement in measurements for the rating curve and Toulon Provence Méditerranée (TPM) for its founding. Ch.D. is grateful to IRSN and Region PACA for the funding of this research. We thank Météo-France for the meteorological data. This work benefited from the fruitful discussions within the framework of the KARST observatory network (www.sokarst.org) initiative from the INSU/CNRS, which aims to strengthen knowledge sharing and promote cross-disciplinary research on karst systems. Dardennes springs data have been monitored in the frame of the DARDENNES project funded by the Agence de l'Eau (RMC), the city of Toulon, Veolia Eau, Cenote Company, and Aix-Marseille University. The authors also wish to thank all persons who participated in the fieldwork. We are very grateful to the anonymous reviewers for the valuable criticisms, which substantially improved the quality of the manuscript.
8. References
Aich, V., A. Zimmermann and H. Elsenbeer (2014). "Quantification and interpretation of suspended-sediment discharge hysteresis patterns: How much data do we need?" CATENA 122: 120-129.
Alexandrov, Y., J. B. Laronne and I. Reid (2003). "Suspended sediment concentration and its variation with water discharge in a dryland ephemeral channel, northern Negev, Israel." Journal of Arid Environments 53(1): 73-84. Alexandrov, Y., J. B. Laronne and I. Reid (2007). "Intra-event and inter-seasonal behaviour of suspended sediment in
flash floods of the semi-arid northern Negev, Israel." Geomorphology 85(1–2): 85-97.
Antonelli, C., F. Eyrolle, B. Rolland, M. Provansal and F. Sabatier (2008). "Suspended sediment and 137Cs fluxes during the exceptional December 2003 flood in the Rhone River, southeast France." Geomorphology 95(3–4): 350-360.
Arfib, B. and J.-B. Charlier (2016). "Insights into saline intrusion and freshwater resources in coastal karstic aquifers using a lumped Rainfall–Discharge–Salinity model (the Port-Miou brackish spring, SE France)." Journal of Hydrology 540: 148-161.
Baudement, C., B. Arfib, N. Mazzilli, J. Jouves, T. Lamarque and Y. Guglielmi (2017). "Groundwater management of a highly dynamic karst by assessing baseflow and quickflow with a rainfall-discharge model (Dardennes springs, SE France)." Bull. Soc. géol. Fr. 188(6): 40.
Bergillos, R. J., C. Rodríguez-Delgado, A. Millares, M. Ortega-Sánchez and M. A. Losada (2016). "Impact of river regulation on a Mediterranean delta: Assessment of managed versus unmanaged scenarios." Water Resources Research 52(7): 5132-5148.
Bezak, N., M. Brilly and M. Šraj (2014). "Comparison between the peaks-over-threshold method and the annual maximum method for flood frequency analysis." Hydrological Sciences Journal 59(5): 959-977.
Bonacci, O., I. Ljubenkov and T. Roje-Bonacci (2006). "Karst flash floods: an example from the Dinaric karst (Croatia)." Natural Hazards and Earth System Science 6(2): 195-203.
Bourrin, F., P. L. Friend, C. L. Amos, E. Manca, C. Ulses, A. Palanques, X. Durrieu de Madron and C. E. L. Thompson (2008). "Sediment dispersal from a typical Mediterranean flood: The Têt River, Gulf of Lions." Continental Shelf Research 28(15): 1895-1910.
Capello, M., L. Cutroneo, G. Ferretti, S. Gallino and G. Canepa (2016). "Changes in the physical characteristics of the water column at the mouth of a torrent during an extreme rainfall event." Journal of Hydrology 541: 146-157. Chen, Z., A. S. Auler, M. Bakalowicz, D. Drew, F. Griger, J. Hartmann, G. Jiang, N. Moosdorf, A. Richts and Z.
Stevanovic (2017). "The World Karst Aquifer Mapping project: concept, mapping procedure and map of Europe." Hydrogeology Journal 25(3): 771-785.
Chow, V. T. (2010). Applied hydrology, Tata McGraw-Hill Education.
Claps, P. and F. Laio (2003). "Can continuous streamflow data support flood frequency analysis? An alternative to the partial duration series approach." Water Resources Research 39(8).
Cudennec, C., C. Leduc and D. Koutsoyiannis (2007). "Dryland hydrology in Mediterranean regions—a review." Hydrological Sciences Journal 52(6): 1077-1087.
Dang, D. H., V. Lenoble, G. Durrieu, D. Omanovic, J. U. Mullot, S. Mounier and C. Garnier (2015). "Seasonal variations of coastal sedimentary trace metals cycling: Insight on the effect of manganese and iron (oxy)hydroxides, sulphide and organic matter." Mar Pollut Bull 92(1-2): 113-124.
Dang, D. H., E. Tessier, V. Lenoble, G. Durrieu, D. Omanović, J.-U. Mullot, H.-R. Pfeifer, S. Mounier and C. Garnier (2014). "Key parameters controlling arsenic dynamics in coastal sediments: An analytical and modeling approach." Marine Chemistry 161: 34-46.
De Girolamo, A. M., G. Pappagallo and A. Lo Porto (2015). "Temporal variability of suspended sediment transport and rating curves in a Mediterranean river basin: The Celone (SE Italy)." CATENA 128: 135-143.
Dufresne, C., C. Duffa, V. Rey and R. Verney (2018). "Hydro-sedimentary model as a post-accidental management tool: Application to radionuclide marine dispersion in the Bay of Toulon (France)." Ocean & Coastal Management
153: 176-192.
Estrany, J., C. Garcia and R. J. Batalla (2009). "Suspended sediment transport in a small Mediterranean agricultural catchment." Earth Surface Processes and Landforms 34(7): 929-940.
Fleury, P., M. Bakalowicz and G. de Marsily (2007a). "Submarine springs and coastal karst aquifers: a review." Journal of Hydrology 339(1-2): 79-92.
Fleury, P., B. Ladouche, Y. Conroux, H. Jourde and N. Dörfliger (2009). "Modelling the hydrologic functions of a karst aquifer under active water management–the Lez spring." Journal of Hydrology 365(3-4): 235-243.
Fleury, P., J.-C. Maréchal and B. Ladouche (2013). "Karst flash-flood forecasting in the city of Nîmes (southern France)." Engineering Geology 164: 26-35.
Fleury, P., V. Plagnes and M. Bakalowicz (2007b). "Modelling of the functioning of karst aquifers with a reservoir model: Application to Fontaine de Vaucluse (South of France)." Journal of hydrology 345(1-2): 38-49.
Gaume, E., V. Bain, P. Bernardara, O. Newinger, M. Barbuc, A. Bateman, L. Blaškovičová, G. Blöschl, M. Borga and A. Dumitrescu (2009). "A compilation of data on European flash floods." Journal of Hydrology 367(1-2): 70-78. Goudie, A. S. and N. J. Middleton (2001). "Saharan dust storms: nature and consequences." Earth-Science Reviews
56(1–4): 179-204.
Jourde, H., A. Lafare, N. Mazzilli, G. Belaud, L. Neppel, N. Dörfliger and F. Cernesson (2014). "Flash flood mitigation as a positive consequence of anthropogenic forcing on the groundwater resource in a karst catchment." Environmental earth sciences 71(2): 573-583.
Jouves, J., S. Viseur, B. Arfib, C. Baudement, H. Camus, P. Collon and Y. Guglielmi (2017). "Speleogenesis, geometry, and topology of caves: A quantitative study of 3D karst conduits." Geomorphology 298: 86-106.
Jungerius, P. D. and M. J. ten Harkel (1994). "The effect of rainfall intensity on surface runoff and sediment yield in the grey dunes along the Dutch coast under conditions of limited rainfall acceptance." CATENA 23(3–4): 269-279. Lamarque, T. (2014). Etablissement dʼune courbe de tarage des débits du cours dʼeau du Las, Spélé-H20: 103 (in
french).
Lang, M., T. Ouarda and B. Bobée (1999). "Towards operational guidelines for over-threshold modeling." Journal of hydrology 225(3-4): 103-117.
Lenzi, M. A. and L. Marchi (2000). "Suspended sediment load during floods in a small stream of the Dolomites (northeastern Italy)." CATENA 39(4): 267-282.
López-Tarazón, J. A., R. J. Batalla, D. Vericat and J. C. Balasch (2010). "Rainfall, runoff and sediment transport relations in a mesoscale mountainous catchment: The River Isábena (Ebro basin)." CATENA 82(1): 23-34. López-Tarazón, J. A., R. J. Batalla, D. Vericat and T. Francke (2012). "The sediment budget of a highly dynamic
mesoscale catchment: The River Isábena." Geomorphology 138(1): 15-28.
Martin, J.-M., F. Elbaz-Poulichet, C. Guieu, M.-D. Loÿe-Pilot and G. Han (1989). "River versus atmospheric input of material to the mediterranean sea: an overview." Marine Chemistry 28(1–3): 159-182.
Masson, O., D. Piga, R. Gurriaran and D. D’Amico (2010). "Impact of an exceptional Saharan dust outbreak in France: PM10 and artificial radionuclides concentrations in air and in dust deposit." Atmospheric Environment 44(20): 2478-2486.
Meriano, M., K. W. Howard and N. Eyles (2011). "The role of midsummer urban aquifer recharge in stormflow generation using isotopic and chemical hydrograph separation techniques." Journal of hydrology 396(1-2): 82-93. Meybeck, M., L. Laroche, H. H. Durr and J. P. M. Syvitski (2003). "Global variability of daily total suspended solids
and their fluxes in rivers." Global and Planetary Change 39(1-2): 65-93.
Moraetis, D., D. Efstathiou, F. Stamati, O. Tzoraki, N. P. Nikolaidis, J. L. Schnoor and K. Vozinakis (2010). "High-frequency monitoring for the identification of hydrological and bio-geochemical processes in a Mediterranean river basin." Journal of Hydrology 389(1): 127-136.
Nadal-Romero, E., D. Regüés and J. Latron (2008). "Relationships among rainfall, runoff, and suspended sediment in a small catchment with badlands." CATENA 74(2): 127-136.
Nicolau, R., Y. Lucas, P. Merdy and M. Raynaud (2012). "Base flow and stormwater net fluxes of carbon and trace metals to the Mediterranean sea by an urbanized small river." Water Research 46(20): 6625-6637.
Pellerin, B. A., W. M. Wollheim, X. Feng and C. J. Vörösmarty (2008). "The application of electrical conductivity as a tracer for hydrograph separation in urban catchments." Hydrological Processes: An International Journal 22(12): 1810-1818.