Relatedness and Population Differentiation in a Colonial
Butterfly, Eucheira socialis (Lepidoptera: Pieridae)
ADAM H. PORTER,1 HANSJURG GEIGER,2 DESSIE L. A. UNDERWOOD,3
JORGE LLORENTE-BOUSQUETS,4 AND ARTHUR M. SHAPIRO3
Ann. Entomol. Soc. Am. 90(2): 230-236 (1997)
ABSTRACT Eucheira socialis (Westwood) occurs above 1,800 m in mountains throughout Mexico and has a remarkable suite of autapomorphies, including communal larval nests and a mean primary sex ratio of 70% males. We gathered allozyme data for 31 loci from individuals within nests within populations and used hierarchical F statistics to assess population structure and relatedness at these levels. Allozyme variation was far lower than reported in most Lep-idoptera, and was absent from the populations sampled from southern Mexico. Among 5 sample sites distributed throughout Mexico, differentiation was high (FST = 0.54), which is
consistent with a history of interrupted gene flow. At lower hierarchical levels in the variable populations, we found significant excess heterozygotes within nests (F]N = —0.15) and
evi-dence for structuring within subpopulations (Fls — 0.015, significantly greater than F!N).
Av-erage relatedness among nestmates was rNS = 0.28, which is significantly less than r = 0.5.
This is probably caused largely by interchange among nests on multinest trees.
KEY WORDS hierarchical genetic structure, relatedness, Wright F statistics, larval nest
KNOWN LOCALLY AS the mariposa del madrono or tzauhquiocuilin (Hoffmann, 1911), Eucheira soci-alis (Westwood, 1834) has been considered an oddity by lepidopterists since its larval nests were first described by von Humboldt (1811, p. 454). Populations are found only above 1,800 m in the mountains of Mexico, and detailed accounts of its natural history have been published only recently (Diaz Batres and Boudinot 1986, Kevan and Bye 1991, Underwood 1994). Females appear to mate only once, and they lay most of their eggs in single clutches of 50-400 (Underwood 1994) on the un-dersides of leaves of madrone trees, especially Ar-butus xalapensis H.B.K. (Ericaceae). Upon hatch-ing, the larvae of each clutch construct a communal silken nest on the leaf, and this is ex-panded in the 4th stadium to enclose the end of the twig in an opaque silken bag of papery texture, from which larvae emerge processionally at night to feed. They pupate inside the nest, hanging ver-tically by the cremaster. All other pierids attach themselves by an additional silken girdle. Up to 20% of the emerging adults show deformities as a result of expanding their wings inside the nest
•Department of Biological Sciences, Bowling Green State Uni-versity, Bowling Green, OH 43403-0212. E-mail: aport-er@opie.bgsu.edu
2
Zoologisches Institut, Universitiit Bern, Baltzerstrasse 3, CH-3012 Bern, Switzerland.
3Section of Evolution and Ecology, University of California,
Da-vis, CA 95616.
4Museo de Zoologia, Facultad de Ciencias, UNAM, Apdo.
Post-al 70-399, 04510 Mexico, D.F., Mexico.
(Diaz Batres and Boudinot 1986), and these adults are not likely to reproduce. The adults are weak fliers with grossly simplified sexual behaviors, and mating takes place in the vicinity of the nests (Un-derwood 1992); nests are not reused by later gen-erations. The proboscis is nonfunctional and often fails to anneal properly. Adults are sexually dimor-phic: females have reduced compound eyes and slightly reduced wing venation; males fly somewhat better and have exceptionally large eyes. Any of these traits is unusual for butterflies, and they are especially remarkable in combination.
Eucheira socialis nests have male-biased primary sex ratios (D.L.A.U., unpublished data), with males comprising on average 70% of the larvae in clutch-es. Preliminary studies suggest a partial division of labor in the construction of the nest and the main-tenance of silken trails. On a per-individual basis, males do most of this work (D.L.A.U., unpublished data). Furthermore, a significant proportion of penultimate instars stop feeding, decline, and die once the nest is fully constructed, and these larvae are almost always males (D.L.A.U., unpublished data). This results in an adult sex ratio of 56-65% males, still significantly greater than 1:1 (Kevan and Bye 1991; D.L.A.U., unpublished data). In other taxa, limited "altruism" of this sort is often associated with high levels of relatedness (Hamil-ton 1967, Frank 1987, Thornhill 1993), and high relatedness is likely, given the natural history of E.
socialis. 0013-S746/97/0230-0236$02.00/0 © 1997 Entomological Society of America
Fig. 1. Sample populations of £. socialis in Mexico. (1) El Palmito, Sinaloa; (2) El Madrono, Durango; (3) Valle de Bravo, Mexico; (4) Pedregal de Chichinautzin, Morelos; (5) Palillos, Zimapan, Hidalgo.
In this article, we use allozyme data to look for patterns of genetic structure in E. socialis popu-lations. In particular, we investigate the degree of geographic differentiation among populations throughout Mexico and, within populations, the degree of relatedness within larval nests.
Materials and Methods
Larval nests of 2 E. socialis subspecies were sampled from populations in the following locali-ties in Mexico: E. socialis westwoodi Beutelspach-er, 10 km W El Palmito, Sinaloa (near the Durango border) (6 nests); El Madrono, Durango (29 nests); and E. socialis socialis, Cerro de Bravo, near Valle de Bravo, Mexico state (4 nests); Pedregal de Chi-chinautzin, Morelos (3 nests); and Palillos, Zima-pan, Hidalgo (3 nests) (Figure 1). Nests with pen-tultimate and ultimate instar larvae were taken from trees, kept with madrone (Arbutus xalapen-sis) foliage in individual bags, and hand-carried to the laboratory in Davis, CA. They were reared to maturity on Arbutus menziesii Pursh., the native Californian species, and, upon emergence, samples of adults were frozen and stored at — 80°C. Sam-ples from reared nests were transported on dry ice to Bern, Switzerland, for electrophoretic analysis; some nests with pupae were sent directly from Mexico City to Bern; and the remainder were an-alyzed in Davis. Voucher material is deposited in the Bohart Museum at the University of California, Davis.
The following enzyme systems yielded a total of 31 scorable loci: Aat-1, -2 (EC 2.6.1.1), Acp (EC 3.1.3.2), Ak-1, -2, -3 (EC 2.7.4.7), Aid (EC
4.1.2.13), Arg (EC 2.7.3.3), Est (EC 3.1.1.1), Fum -1, -2 (EC 4.2.1.2), Gapd (EC 1.2.1.12), a-Gpd (EC 1.1.1.8), Gpd (EC 1.1.1.49), Gpi (EC 5.3.1.9), Hk-1, - 2 , -3 (EC 2.7.1.1), Idh-1, -2 (EC 1.1.1.42), Mdh-1, -2 (EC 1.1.1.37), Me-1, -2 (EC 1.1.1.40), Pep (EC 3.4.11.-), 6-Pgd (EC 1.1.1.43), Pgm (EC 2.7.5.1), Pk (EC 2.7.1.40), and Sod-1,
—2, —3 (EC 1.15.1.1). Electromorphs were scored for mobility relative to standard alleles from Pieris brassicae, a method chosen for consistency with other studies of electrophoretic variability in the family Pieridae (Geiger 1981; Geiger and Scholl 1985; Geiger and Shapiro 1986, 1992; Porter and Geiger 1995).
We used hierarchical F statistics (Wright 1978, Weir and Cockerham 1984) to describe allozyme variation. F statistics summarize the extent to which populations deviate from Hardy-Weinberg genotypic proportions. Populations in Hardy-Weinberg equilibrium proportions have F = 0. Populations with excesses of homozygotes have F > 0 to a maximum of F = 1; those with hetero-zygote excesses have F < 0 to a minimum of F = — 1. A population may be hierarchically organized as a group of subpopulations, whereupon F in the total population, denoted FIT, may be
hierarchi-cally partitioned to describe deviations from Har-dy-Weinberg expectations on different geographic scales. The partitioning is (1—FIT) = (1—Fts) (1—
FST) (Wright 1951, 1978), where FIS describes the
average of deviations from Hardy-Weinberg pro-portions within the subpopulations, and FST
de-scribes the component of overall deviation pro-duced by gene frequency differences among subpopulations. Other hierarchical levels are often inserted as we describe below. On local scales, within subpopulations, deviations from Hardy— Weinberg expectations arise from nonrandom mat-ing, and FIS may be positive or negative. At larger
scales, only positive values (aside from sampling variation) may arise in FST, when the
subpopula-tions have different allele frequencies. This Wah-lund effect is easiest to imagine in the extreme case where subpopulations are fixed for different alleles, yielding a complete deficiency of hetero-zygotes in the total population. As such, FST is a common statistic describing average differentiation among subpopulations.
Historically, F statistics have been derived from 3 perspectives: as the degree to which alleles iden-tical-by-descent are distributed within and among individuals (/of Mal£cot 1969) and populations (G of Nei 1973); by path analysis as correlations be-tween alleles in uniting gametes (i.e., within indi-viduals) within and among subpopulations (F of Wright 1951, 1978); and from a nested analysis of variance model describing the pattern in which to-tal allelic variation is partitioned among subpopu-lations, among individuals within subpopusubpopu-lations, and between pairs of alleles within (diploid) indi-viduals (Cockerham 1969, 1973; Weir and Cock-erham 1984). Although the derivations yield the
same analytical result and their various interpre-tations are biologically equivalent, the 3rd ap-proach lends itself most readily to statistical treat-ment of data because degrees of freedom can easily be incorporated at several sampling levels (Weir and Cockerham 1984, Weir 1990).
Because of the hierarchical structure of F statis-tics, additional levels may readily be included in analyses, representing, for example, subdivisions of large subpopulations into demes (Wright 1978) or grouping of subpopulations into intraspecific geo-graphical or taxonomic units (Porter 1990, Chesser et al. 1993). In this study we investigate differen-tiation at 3 hierarchical levels: among subpopula-tions (FST), among larval nests within
subpopula-tions (FNs), and among individuals within nests
within subpopulations (FIN). The partitioning is
thus (1-Fn.) = (1-FIN) (1-FNS) (1-FST). These
hi-erarchical levels may be collapsed to yield (1—FrT)
= (1-FIN) (1-FNT) and (1-FIT) = (1-FIS) (1-FST)
as above, and we also draw inferences from Ft s.
We used Weir and Cockerham s (1984) statistical estimators for F statistics, derived from the unbi-ased hierarchical variance components a, b\, b2,
and c, as defined in their article. These estimators are = 1 " bx + c' FI S= / = 1 -FI T = F = 1 -h FNS = 1 -?x + b2 + c ' c a + bi + b2 + c' + c \ + b2 rN T — Vi — i a + b2 a + bx + b2 + c' 5)1 z a+bi+bz + c'
where dx, 62, f, and F follows their notation.
Sin-gle-locus estimates were combined over loci and alleles using a weighted average, and error esti-mates were obtained by the "jackknife" resampling method (Weir and Cockerham 1984).
Behavioral observations indicate that E. socialis nests are primarily family groups when eggs are laid (Underwood 1992). A deviation from the ap-pearance of "Hardy-Weinberg" proportions among larvae within nests (FIN) in this study is thus
a measure of the deviation from Mendelian ratios within putative family groups. FIN would be
ex-pected to increase with 3 factors that lead to ho-mozygote excesses: multiple paternity, coalescence of nests on the same trees, and the extent of mul-tifemale clutches. As described below, relatedness (r) is the more appropriate statistic for interpreting
this level of differentiation. Differentiation among individuals within subpopulations (FIS) will not be
influenced by these 3 factors, but may be influ-enced instead by nonrandom mating in the sub-population. Given the natural history of E. socialis (Kevan and Bye 1991, Underwood 1992, 1994), the appearance of nonrandom mating seems more likely to arise statistically, from an inadvertent pooling of local genetic neighborhoods within the sampled subpopulations, rather than sexually, from actual mate-choice behaviors influencing consan-guineous mating.
It is possible to estimate the rate of gene ex-change among subpopulations using M ^ ( I / F S T ~~ l)/4 (Slatkin 1987, Cockerham and Weir 1993), where M is the effective number of individuals ex-changed among subpopulations per generation. For neutral loci, differentiation among subpopu-lations (FsT) is produced by genetic drift and is
counteracted by gene flow. Balancing selection on allozymes probably plays a negligible role in sub-population differentiation unless the subpopula-tions are quite large (Porter 1990, Porter and Geig-er 1995). The estimation of gene flow requires that drift and gene flow be near equilibrium. If they are not, the direction of the bias depends on whether contact among subpopulations is of pri-mary or secondary origin. When they are out of equilibrium because of the interruption of gene flow, gene flow (M) will be overestimated, and this is especially so in large populations or over geo-graphic regions, because genetic drift will act more slowly therein (Porter and Geiger 1995).
Relatedness statistics are comparative in nature, and apply to populations of grouped individuals rather than to particular groups taken separately (Hamilton 1964, Grafen 1985). The relatedness statistic r is defined as the degree to which indi-viduals within groups deviate from the average ge-notype of their group, as compared with their de-viation from the average genotype of the population (Hamilton 1971, Grafen 1985, Queller and Goodnight 1989). The groups may be arbi-trarily chosen and, in this study, groups are nests. Like F statistics, relatedness statistics may be par-titioned hierarchically (Pamilo 1984). When doing so, the subscript notation is not exactly like that of F statistics. The average relatedness of nestmates (individuals within nests) within subpopulations is rNS, whereas the inbreeding coefficient at this level
is FIN.
We estimated relatedness among nestmates us-ing Hamilton's (1971, appendix II) fonnula
2F, rNT
-NT
1 + F,IT
This is difficult to interpret when subpopulations differ in allele frequency because it compares dif-ferences among nestmates to difdif-ferences from the average allele frequency of the total population. So in addition, following Pamilo (1984, equation 16),
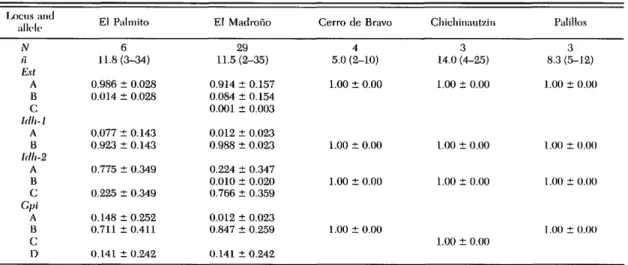
Table 1. Nests per site (N), mean ± SD per nest sample sizes (n) and allele frequencies in each E. socialis sub population for the polymorphic loci
lx)cus and allt-le IV H Esl A B c: Idh-1 A B hlh-2 A B C Cpi A B c: D El Palmito 6 11.8(3-34) 0.986 ± 0.028 0.014 ± 0.028 0.077 ± 0.143 0.923 ± 0.143 0.775 ± 0.349 0.225 ± 0.349 0.148 ± 0.252 0.711 ± 0.411 0.141 ± 0.242 El Madrono 29 11.5 (2-35) 0.914 ± 0.157 0.084 ± 0.154 0.001 ± 0.003 0.012 ± 0.023 0.988 ± 0.023 0.224 ± 0.347 0.010 ± 0.020 0.766 ± 0.359 0.012 ± 0.023 0.847 ± 0.259 0.141 ± 0.242 Cerro de Bravo 4 5.0 (2-10) 1.00 ± 0.00 1.00 ± 0.00 1.00 ± 0.00 1.00 ± 0.00 Chichinautzin 3 14.0 (4-25) 1.00 ± 0.00 1.00 ± 0.00 1.00 ± 0.00 1.00 ± 0.00 Palillos 3 8.3 (5-12) 1.00 ± 0.00 1.00 ± 0.00 1.00 ± 0.00 1.00 ± 0.00
Ranges of nest sample sizes are given in parentheses.
average relatedness among nests within subpopu-lations was estimated using
2FNS
1NS
1 + FIS"
These estimates of rNS and rNT are statistically
un-biased, to the extent that the ratio of 2 unbiased estimators is unbiased, because they are ratios of the unbiased F statistics we calculated above. We jackknifed over nests to estimate error of r because there were considerably more nests than polymor-phic loci. Queller and Goodnight (1989, equation 11) suggested a similar (Pamilo 1989) formula that appears generally less biased for small samples. We did not adopt it because it produces unrealistic es-timates if both the number of subpopulations an-alyzed is very small and their allele frequencies are very different, as occurred in our sampling regime. Only the 2 northern Mexico populations were suit-able for our within-population relatedness esti-mates because the other populations lacked genet-ic variation, leading to undefined estimates of r in them.
Results
Genetic Differentiation. Only the loci Aat-1, Est, Gpi, and Idh-1 showed allozyme
polymor-phism within or among populations (Table 1), and these were only polymorphic in the 2 E. s. wes-twoodii populations. This resulted in heteroyzgos-ities of H = 0.03 and H = 0.04 in these popula-tions. Heterozygotes occurred in both sexes, indicating that these loci are autosomal. The 3 populations from southern Mexico, currently placed taxonomically as E. socialis socialis, were homozygous at the 31 loci sampled, with hetero-zygosities of H = 0.0. This is the lowest overall level of polymorphism (%P = 13%) yet recorded for any butterfly species. These heterozygosity sta-tistics should be interpreted with caution, however, because our methods were not designed to ran-domly sample individuals within subpopulations.
Hierarchical inbreeding coefficients considering all subpopulations are shown in Table 2. FST is
quite high (P < 0.001), indicating virtually com-plete isolation of subpopulations. If this is con-verted to a gene flow estimate, then M —0.21 (0.11-0.40, 95% CI) individuals exchanged among subpopulations per generation. This is just above the range of values seen when genetically isolated, sympatric sibling species are compared, and some-what lower than most cases of subspecific differ-entiation (Porter 1990). The lack of genetic diver-sity in the E. s. socialis subpopulations makes further interpretation of genetic structure
prob-Table 2. Hierarchical F statistics for all E. socialis subpopulations, using the formulae of Weir and Cockerham (1984) (see Materials and Methods)
F statistic F s T FN T F,T ^NS F\S Level Among subpopulations Among nests Among individuals
Among nests within subpopulations Among individuals within subpopulations
Among individuals within nests within subpopulations
Value 0.543 0.613 0.555 0.152 0.026 -0.148 SD 0.081 0.072 0.094 0.006 0.031 0.029 Standard deviations are derived from jackknifing over loci.
Table 3. F statistics considering only the E. s. westivoodi subpopulations from northern Mexico, where sufficient variance in allele frequency exists to permit more detailed analysis
F
statistic Level Value SD *35 P<
FN T F I T FNS F\s Fw Among subpopulations Among nests Among individuals
Among nests within subpopulations Among individuals within subpopulations
Among individuals within nests within subpopulations
0.262 0.369 0.273 0.145 0.015 -0.151 0.024 0.024 0.026 0.007 0.010 0.009 10.762 15.223 10.370 20.811 1.569 -16.370 0.001 0.001 0.001 0.001 0.2 NS 0.001 Standard errors are taken over nests using a jackknife algorithm, and 2-tailed significance levels are derived from t tests against the null hypothesis that F = 0.
lematic, and only the E. s. westwoodi subpopula-tions are included in the analyses below.
F statistics considering only the Durango and Sirialoa subpopulations are shown in Table 3. FIN
is significantly negative, indicating an excess of het-erozygous larvae in nests, and this value remains consistently low across loci when analyzed sepa-rately. FIS is not significantly different from zero.
However, it is appropriate here to compare FIS to
FIN rather than zero, whereupon we find that FIS
is significantly higher (t70 = 74.1, P < 0.0001), in-dicating an overall excess of homozygotes relative to the within-nest genotypic proportions. This sug-gests that there is likely to be spatial structure within the subpopulations, despite relatively con-tinuous madrone habitat within our localities. This appears consistent with low female dispersal rates observed in mark-recapture experiments in natural populations (D.L.A.U., unpublished data).
Relatedness. Using only the Durango and Sin-aloa subpopulations, where sufficient genetic vari-ation was available, we found relatedness among nestmates within subpopulations to be rNS = 0.285
± 0.012. This is significantly lower than r = 0.5 (% = -17.41; P < 0.0001), the relatedness ex-pected between full siblings in an outbreeding population.
As a post-hoc test to determine whether the low relatedness within nests was attributable to nest coalescence, we repeated the analysis for the El Madrono subpopulation alone. Using data from all nests, we found rNT = 0.272 ± 0.01. We found
relatedness of nestmates within trees was rNtr =
0.177 ± 0.04, significantly lower than the overall relatedness (t35 = 5.31, P < 0.001). This suggests that nest coalescence is likely to play an important role in driving down average relatedness. Unfor-tunately, our sampling records do not permit us to look at relatedness within nests that were the sole occupants of trees.
Discussion
The genetic structure of Eucheira socialis is marked by limited polymorphism but strong dif-ferentiation among populations, with excess het-erozygotes and moderate levels of relatedness among nestmates within subpopulations. These
patterns are related to several aspects of both adult and larval natural history, discussed below.
Population Structure and Adult E. socialis Behavior. E. socialis are weak fliers. Females ap-pear to mate once early in life and lay virtually all their eggs in a single clutch soon after mating (Un-derwood 1992). Adult dispersal is likely to be only several hundred meters at most (D.L.A.U., unpub-lished data), and under an isolation-by-distance model of population structure, numerous genetic neighborhoods would fit into each of the patches of madrone found in our study areas. Our nests in the Durango and Sinaloa sites were spread over =5 ha within a madrone patch, and the difference between our FIN and FiS values (Table 3) qualita-tively reflects the within-subpopulation differenti-ation that strong isoldifferenti-ation by distance is expected to produce.
At larger geographic scales, gene flow among sampled E. socialis localities is probably restricted by 2 factors in addition to weak flight capabilities. First, madrone habitats are limited to elevations > 1,800 m, and they have been separated by exten-sive inhospitable regions since at least Pleistocene times. Second, there is strong karyotypic differ-entiation among northern and southern E. socialis populations (A.M.S. and S. R. Snow, unpublished data) that would probably act as postzygotic bar-riers should distant populations ever encounter one another naturally. Data are currently limited, but karyotypic differentiation appears correlated geographically with the minor morphological dif-ferences (A.M.S. and S. R. Snow, unpublished data) used to separate northern and southern pop-ulations into subspecies (Beutelspacher 1984, Diaz Batres and Boudinot 1986). The low gene flow (M) estimate indicates that these E. socialis subpopu-lations have probably long been separated and are now evolving relatively independently of one an-other. Indeed, if they have been slowly diverging by genetic drift since achieving their current rang-es, then drift and gene flow may not yet have equil-ibrated, and our calculated value of M may be an overestimate. These subspecies may prove to be separate biological species upon closer inspection of intermediate localities. The high FST value
re-futes the hypothesis (Peigler 1993) that the current geographic range was achieved relatively recently
by commerce among indigenous peoples, who re-portedly used the nests for paper in pre-Colum-bian times and who continue to eat the pupae (Kevan and Bye 1991; unpublished observations).
In contrast to E. socialis, other studies of butterfly population genetic structure, conducted at compa-rable geographic scales, show very little differenti-ation among populdifferenti-ations. In the Pieridae, Geiger and Shapiro (1992) and Porter and Geiger (1995) report low FST values despite high heterozygosities
for Pieris napi (L.)-group taxa in California and Eu-rope. This is associated with high dispersal rates of these butterflies (A. H. P., unpublished data). Sim-ilar work on Pieris rapae (L.) (Vawter and Brussard 1984) yields essentially the same picture, but asso-ciated in part with recent range expansion. Other butterfly species also have very low values of F$j, for example Limenitis weidemeyerii W. H. Edwards (Porter 1990), Euphydryas chalcedona (Doubleday) (McKechnie et al. 1975, Porter 1990), Coenonym-pha tullia (Miiller) (Porter and Geiger 1988), and the migratory Danaus plexippus (L.) (Eanes and Koehn 1978) (all Nymphalidae). Euphydryas editha (Boisduval) has one of the highest values, at F§T = 0.2 (McKechnie et al. 1975, Porter 1990). It is also interesting to note that die eastern tent caterpillar, a lasiocampid moth, has low levels of FST (Costa and
Ross 1994) across eastern North America, similar to those of "normal" butterflies, rather than showing the high differentiation seen in E. socialis on a sim-ilar geographic scale. E. socialis has by far the high-est Fsj values reported in die Lepidoptera, even if only the 2 geographically close Durango and Sinaloa populations are considered. This is consistent with observations of limited dispersal capabilities in this species.
Eucheira socialis and Similarly Colonial Lep-idoptera. The eastern tent caterpillar, Malacosoma americanum (E), has a natural history superficially similar to that of E. socialis, with communal larval nests constructed by siblings from a single clutch (Costa and Ross 1993), and larval trails from the nest to patches of edible leaves (Fitzgerald and Wilier 1983). Within-nest variation in M. ameri-canum (Costa and Ross 1993) indicates that relat-edness begins high, at rNS =0.5 among early-instar
nestmates, but nest coalescence and exchange among nests drives relatedness down to rNS = 0.38
by the later instars. The saturniid moth Anisota senatoria J. E. Smith also lives communally, but does not construct nests. It shows reduced relat-edness (rNS = 0.31) in late instar larval groups
(Porter et al. 1997), and nest coalescence and ex-change appears to be involved. We also have ob-served nest coalescence and exchange of individ-uals among nests in E. socialis. Judging from the comparison of relatedness among all nests (rNT) to
that among nests within trees (rNtr) at El Madrono,
larval movement among nests appears to have a similarly strong homogenizing effect on population genetic structure. However, our follow-up analysis does not rule out the possibility that occasional
multiple mating and egg dumping on clutches of other females also contributes in minor ways to reduced relatedness. M. americanum and other co-lonial Lepidoptera have 1:1 sex ratios, and in gen-eral share few of the remarkable traits character-istic of E. socialis.
Heterozygote Excesses. The significant hetero-zygote excesses (FJN) within nests at all 4 poly-morphic loci are difficult to explain without invok-ing natural selection, although the mechanism(s) remains obscure. Field observations indicate that the nests are derived primarily from single clutches laid by females (Underwood 1992), and that fe-males probably mate only once before ovipositing. Females do occasionally lay small numbers of eggs on the clutches of other females (D.L.A.U., un-published data), and nests on a single tree appear to exchange members or coalesce, but these phe-nomena all lead to heterozygote deficiencies much in the way that pooling differentiated subpopula-tions yields homozygote excesses in the total pop-ulation.
Limited Polymorphism. E. socialis, especially the subspecies E. s. socialis, has among the lowest levels of polymorphism yet reported in the Lepi-doptera; only Yponomeuta rorellus Hiibner (Ypon-omeutidae) has values in this range (0.0 < // ^ 0.015 [Menken 1987]).
Acknowledgments
We are indebted to Arturo Franco-Gaona, Armando Luis, Dave Whitacre, and Beth Jakob for collecting as-sistance; L. Frauchiger and V. Siegfried for help with gels; F. Ayala and A. Scholl for graciously providing space in their laboratories; and Beth Jakob, Steve Vessey, Carlos Cordero, Carl Schaefer, and 2 anonymous reviewers for fruitful discussions and comments on previous drafts of the manuscript. We thank Harry Kaya for examining mul-tiple larval samples for potential pathogens and the late S. Richard Snow for help with the cytology. U. S. Animal and Plant Health Inspection Service (APHIS) permit numbers were 57-24-85 and 57-35-92 (926862). This study was supported in part by grants from the University of California's UC Mexus program to A.M.S. and J.L.-B., National Geographic Society (3700-87) to A.M.S., and DGAPA-UNAM (IN-200394) to J.L.-B.
References Cited
Beutelspacher, C. R. 1984. Una nueva subespecie du Eucheira socialis Westwood (Lepid6ptera: Pieridae) de Mexico. An. Inst. Biol. Univ. Nac. Auton. Mex., Ser. Zool. 54: 111-118.
Chesser, R. K., O. E. Rhodes, Jr., D. W. Sugg, and A. Schnabel. 1993. Effective sizes for subdivided populations. Genetics 135: 1221-1232.
Cockerham, C. C. 1969. Variance of gene frequencies. Evolution 23: 72-84.
1973. Analysis of gene frequencies. Genetics 74: 679-700.
Cockerham, C. C , and B. S. Weir. 1993. Estimation of gene flow from F-statistics. Evolution 47: 855-863. Costa, J. T. Ill, and K. G. Ross. 1993. Seasonal de-cline in intracolony genetic relatedness in eastern tent
caterpillars: implications for social evolution. Behav. Ecol. Sociobiol. 32: 47-54.
1994. Hierarchical genetic structure and gene flow in macrogeographic populations of the eastern tent cat-erpillar (Malacosoma americanum). Evolution 48: 1158-1167.
Diaz Batres, M. E., and J. Boudinot. 1986. Eucheira
socialis westwoodi Beutelspacher, 1984: contribution a sa systematique. Rev. Fr. Entomol. 3: 135-143. Eanes, W. F., and R. K. Koehn. 1978. An analysis of
genetic structure in the Monarch butterfly, Danaus plexippus L. Evolution 32: 784-797.
Fitzgerald, T. D., and D. E. Wilier. 1983. Tent-build-ing behavior of the eastern tent caterpillar Malacoso-ma americanum (Lepidoptera: Lasiocampidae). J. Kans. Entomol. Soc. 56: 20-31.
Frank, S. A. 1987. Demography and sex ratio in social spiders. Evolution 41: 1267-1281.
Geiger, H. J. 1981. Enzyme electrophoretic studies on the genetic relationships of pierid butterflies. I. Eu-ropean taxa. J. Res. Lepid. 19: 181-195.
Geiger, H. J., and A. Scholl. 1985. Systematics and evolution of holarctic Pierinae (Lepidoptera): an en-zyme electrophoretic approach. Experientia 41: 24— 29.
Geiger, H. J., and A. M. Shapiro. 1986. Electropho-retic evidence for speciation within the nominal spe-cies Anthocharis sara Lucas (Pieridae). J. Res. Lepid. 25: 15-24.
1992. Genetics, systematics and evolution of holarctic
Pieris napi species group populations (Lepidoptera, Pieridae). Z. Zool. Syst. Evolutionforsch. 30: 100-122. Grafen, A. 1985. A geometric view of relatedness. Oxf.
Surv. Evol. Bio. 2: 28-89.
Hamilton, W. D. 1964. The genetical evolution of so-cial behavior, I. J. Theor. Biol. 7: 1-16.
1967. Extraordinary sex ratios. Science (Wash. D.C.) 156: 477-488.
1971. Selection of selfish and altruistic behavior in some extreme models, pp. 57-91. In J. F. Eisenberg and W. S. Dillon [eds.], Man and beast: comparative social behavior. Smithsonian Institution Press, Wash-ington, DC.
Hoffmann, C. C. 1911. Humboldts Nachrichten iiber die in Mexico einheimischen seidenspinnenden Rau-pen, unter spezeiller Bearbeitung des von ihm er-wahnten Madrono: Falters Eucheira socialis Westw. Fauna Exotica 12: 1-33.
Kevan, P. G., and R. A. Bye. 1991. The natural his-tory, sociobiology, and ethnobiology of Eucheira so-cialis Westwood (Lepidoptera: Pieridae), a unique and little known butterfly from Mexico. Entomologist 110: 146-165.
Malecot, G. 1969. The mathematics of heredity, D. M. Yermanos [translator]. Freeman, San Francisco. McKechnie, S. W., P. R. Ehrlich, and R. R. White.
1975. Population genetics of Euphydryas butterflies. I. Genetic variation and the neutrality hypothesis. Ge-netics 81: 571-594.
Menken, S. B. J. 1987. Is the extremely low hetero-zygosity level in Yponomeuta rorellus caused by bot-tlenecks? Evolution 41: 630-637.
Michod, R. E. 1993. Inbreeding and the evolution of social behavior, pp. 74-96. In N. W. Thornhill [ed.], The natural history of inbreeding and outbreeding: theoretical and empirical perspectives. University of Chicago Press, Chicago.
Nei, M. 1973. Analysis of gene diversity in subdivided populations. Proc. Natl. Acad. Sci. U.S.A. 70: 3321-3323.
Pamilo, P. 1984. Genotypic correlation and regression in social groups: multiple alleles, multiple loci and subdivided populations. Genetics 107: 307-320. 1989. Estimating relatedness in social groups. Trends
Ecol. Evol. 4: 353-355.
Peigler, R. S. 1993. Wild silkmoths of the world. Bull. Entomol. Soc. Am. 39: 151-161.
Porter, A. H. 1990. Testing nominal species bound-aries using gene flow statistics: the taxonomy of two hybridizing admiral butterflies (Limenitis: Nymphali-dae). Syst. Zool. 39: 131-148.
Porter, A. H., and H. J. Geiger. 1988. Genetic and phenotypic population structure of the Coenonympha tullia complex (Lepidoptera: Nymphalidae: Satyrinae) in California: no evidence for species boundaries. Can. J. Zool. 66: 2751-2765.
1995. Limitations to the inference of gene flow at re-gional geographic scales—an example from the Pieris napi group (Lepidoptera: Pieridae) in Europe. Biol. J. Linn. Soc. 54: 329-348.
Porter, A. H., S. J. Cadaret, S. A. Johnson, H. Mi-zohata, A. I. Benedetter, C. L. Bester, J. L. Bor-ash, S. D. Kelly, G. S. Buehner, and M. L. Sher-man. 1997. Relatedness and gregariousness in the orange-striped oakworm, Anisota sanatoria (Lepidop-tera: Saturniidae). J. Lepid. Soc. 51: (in press). Queller, D. C , and K. F. Goodnight. 1989.
Estimat-ing relatedness usEstimat-ing genetic markers. Evolution 43: 258-275.
Slatkin, M. 1987. Gene flow and geographic structure of natural populations. Science (Wash. D.C.) 236: 787-792.
Thornhill, N. W. 1993. The natural history of inbreed-ing and outbreedinbreed-ing: theoretical and empirical per-spectives. University of Chicago Press, Chicago. Underwood, D. 1992. Factors influencing oviposition
behavior in the Mexican pierid butterfly, Eucheira so-cialis, on its host plant, Arbutus xalapensis (Erica-ceae). Ph.D. dissertation, University of California, Da-vis.
1994. Intraspecific variability in host plant quality and ovipositional preferences in Eucheira socialis (Pieri-dae: Lepidoptera). Ecol. Entomol. 19: 245-256. Vawter, A. T., and P. F. Brussard. 1984. Allozyme
variation in a colonizing species: the cabbage butterfly Pieris rapae (Pieridae). J. Res. Lepid. 22: 204-216.
von Humboldt, A. 1811. Essai politique sur le royau-me de la Nouvelle Espagne, vol. 4. F. Schoell, Paris. Weir, B. S. 1990. Genetic data analysis. Sinauer,
Sun-derland, MA.
Weir, B. S., and C. C. Cockerham. 1984. Estimating F-statistics for the analysis of population structure. Evolution 38: 1358-1370.
Westwood, J. O. 1834. Description of the nest of a gregarious butterfly from Mexico. Trans. R. Entomol. Soc. Lond. 1: 3 8 ^ 4 .
Wright, S. 1951. The genetical structure of popula-tions. Ann. Eugen. 15: 323-354.
1978. Evolution and the genetics of populations, vol. 4. Variability within and among natural populations. University of Chicago Press, Chicago.
Received for publication 9 July 1996; accepted 24 Sep-tember 1996.