Original article
Leanness and squamous cell oesophageal cancer
S. Gallus,
1C LaVecchia,
1'
2F. Levi,
3L. Simonato,
4L. Dal Maso
5& S. Franceschi
6'istituto di Ricerche Farmacologiche 'Mario Negri', 2Istituto di Statistica Medica e Biometna, Untversila degli Studi di Milano, Milan. Italy:
^Registre vaudois des tumeurs, Institut universilaire de medecine sociale et preventive. Lausanne, Switzerland; *Servizio di Epidemiologia del Tumori, Registro dei Tumor i del Veneto, Padua; 'Centra di Riferimento Oncologico. Aviano (Pordenone). Italy; *International Agency for Research on Cancer, Lvon, France
Summary
Background: Squamous cell oesophageal cancer is one of the
few neoplasms inversely related to body mass index (BMI). However, it is not clear whether this is due to cancer-related weight loss or to other correlates of leanness.
Patients and methods: 395 incident, histologically confirmed
cases of squamous cell oesophageal cancer and 1,066 controls, admitted for acute, non-neoplastic diseases, in Italy and Swit-zerland. Odds ratios (ORs) were derived from multiple logistic regression, including terms for education, tobacco, alcohol, non-alcohol energy, fruit and vegetable intake.
Results: The ORs for the lowest vs. the highest quartile
of BMI in the year before diagnosis were 2.0 in men, 1.6 in
women, and 1.9 (95% confidence interval: 1.3-2.9) in both sexes combined. The association with leanness was stronger in heavy smokers, but was not accounted for by smoking and drinking, nor by differences in diet. Weight change in the decade prior to diagnosis showed no linear association with risk. However, cases were not leaner than controls at age 30 (OR = 0.6 for the lowest BMI quartile) and 50 (OR = 1.1).
Conclusions: Leanness appears to be an indicator of
squa-mous cell oesophageal carcinogenesis. However, low BMI in the distant past was unrelated to oesophageal cancer risk.
Key words: body mass index, drinking, oral cancer, oesopha-geal cancer, smoking
Introduction
Tobacco smoking and alcohol drinking account for over 80% of oesophageal cancers in developed countries. However, dietary and nutritional factors (including a diet low in fruit and vegetables, and high in saturated fats) have also been related to squamous cell oesopha-geal cancer [1,2].
Among nutritional aspects, leanness has been asso-ciated with increased oesophageal cancer risk in studies from North America [3, 4] and in a case-control study conducted in the 1980's in northern Italy [5]. Similar inverse relations with measures of body mass have been observed for oral and pharyngeal cancer or oral leuko-plakias in studies from the US [6], Europe [5], China [7], and India [8].
In the present paper, we were able to consider data on body weight at various ages and subsequent oesopha-geal cancer risk using data from a case-control study conducted in Italy and Switzerland, and thus addressing the question of leanness as a potential early indicator of squamous cell oesophageal carcinogenesis. This is of specific interest, since oesophageal adenocarcinoma, in contrast, has been directly related to overweight and obesity [4, 9, 10].
Patients and methods
Between 1992 and 1997. a case-control study of oesophageal cancer was conducted in the provinces of Pordenone, Milan, and Padova in northern Italy, and (up to 1999) in the Swiss Canton of Vaud [2, 11]
Cases considered in the present report were individuals admitted to the major teaching and general hospitals in the areas under study with incident, histologically confirmed squamous cell cancer of the oeso-phagus, diagnosed no longer than one year before the interview and with no history of cancer of other sites. A total of 395 individuals were enrolled, 351 men and 44 women, whose median age was 60 years (range fronT?4 to 77). Response rate for the cases was over 95%. Thirty-one additional cases of adenocarcinoma of the oesophagus were not considered in the main analyses.
Controls were patients admitted to the same hospitals as the above cases for a wide spectrum of acute, non-neoplastic conditions, not related to smoking or alcohol consumption and long-term modifica-tion of diet. Controls were frequency-matched with cases on quin-quennia of age. sex and study center. To compensate for the rarity of oesophageal cancer in women, a control-lo-case ratio of about five was chosen for females, as opposed to about two for males. Less than 5% of the identified controls refused or were unable to participate. The control group comprised 1.066 subjects, 875 men and 191 women, whose median age was 60 years, ranging from 30 to 77. Twenty-nine percent of controls were admitted for traumas, 36% for other non-traumatic orthopedic conditions. 12% for acute surgical conditions and 23% for other miscellaneous illnesses, including eye. nose. ear. skin or dental disorders.
Similar structured questionnaires and coding manuals were used in each center, and all interviewers were centrally trained and routinely supervised. The questionnaires included information on socio-demo-graphic characteristics, such as education and occupation, lifetime
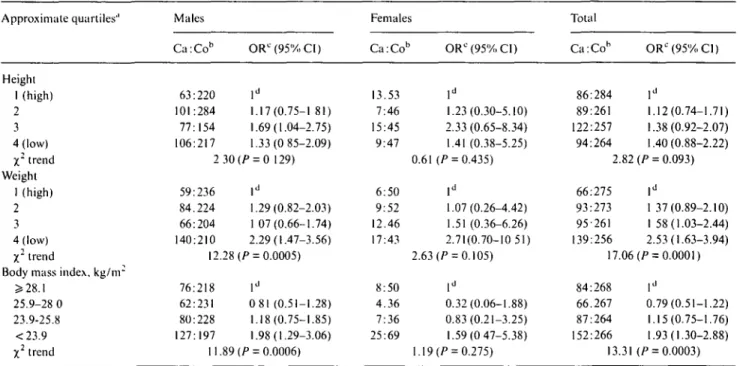
Table I. Distribution of 395 cases of squanious cell oesophageal cancer and 1,066 controls, odds ratios (ORs) and corresponding 95% confidence
intervals (CD according to various anthropometric factors and gender; Italy and Switzerland, 1992-1999. Approximate quartiles'' Height 1 (high) 2 3 4 (low) X2 trend Weight 1 (high) 2 3 4 (low) X2 trend
Body mass index, k g / n r ^ 28.1 25.9-28 0 23.9-25.8 <23.9 X2 trend Males Ca:Cob 63:220 101:284 77:154 106:217 2 59:236 84.224 66:204 140:210 12 76:218 62:231 80:228 127:197 11 ORC(95%CI) ld 1.17(0.75-1 81) 1.69(1.04-2.75) 1.33(0 85-2.09) 30 (P = 0 129) ld 1.29(0.82-2.03) 1 07(0.66-1.74) 2.29(1.47-3.56) .28 (/> = 0.0005) ld 0 81 (0.51-1.28) 1.18(0.75-1.85) 1.98(1.29-3.06) .89 (P = 0.0006) Females Ca:Cob 13.53 7:46 15:45 9:47 0.61 6:50 9:52 12.46 17:43 2.63 8:50 4.36 7:36 25:69 1.19 ORC (95%, CI) ld 1.23(0.30-5.10) 2.33 (0.65-8.34) 1.41 (0.38-5.25) (P = 0.435) ld 1.07(0.26-4.42) 1.51 (0.36-6.26) 2.71(0.70-10 51) (P = 0.105) ld 0.32(0.06-1.88) 0.83(0.21-3.25) 1.59(0 47-5.38) (P = 0.275) Total Ca:Cob 86:284 89:261 122:257 94:264 2.82 66:275 93:273 95-261 139:256 17.06 84:268 66.267 87:264 152:266 13.31 ORC(95%»C1) ld 1.12(0.74-1.71) 1.38(0.92-2.07) 1.40(0.88-2.22) (P = 0.093) ld 1 37(0.89-2.10) 1 58(1.03-2.44) 2.53(1.63-3.94) (P = 0.0001) ld 0.79(0.51-1.22) 1.15(0.75-1.76) 1.93(1.30-2.88) (P = 0.0003)
u Quartiles cutpomts for height were 178, 172, 169 cm in males; 166, 162. 158 cm in females; 176. 171, 166 cm in the overall dataset. For weight 85, 78. 71 kg in males: 74. 67. 59 kg in females; 84. 76. 69 kg in the overall dataset.
b The sum does not add up to the total because of some missing values.
c Estimates from logistic regression, conditioned for age. center and. when indicated, sex, and including terms for education, tobacco, alcohol, non alcohol energy, fruit and vegetable intake.
' Reference category.
smoking and alcohol-drinking habits, and a validated food frequency section. Study subjects were asked to report their height and weight in the year before cancer diagnosis or interview (in controls). Self-reported values were validated by means of available medical records
For the Italian centers, additional measures were elicited: weight at 30 and 50 years and highest (outside pregnancy) and lowest weight in adult life, perceived body size at 12 years of age (i.e., thinner than, same as, heavier than peers), the circumferences of waist, measured 2 cm above the umbilicus, and hip, measured at the maximal protru-sion. Waist-to hip ratio (WHR) was derived from these measures.
Body mass index (BMD was computed as weight in kilograms divided by height in square meters. Change in weight was computed as the differences between weight at diagnosis or interview (for controls) and weight at age 30 for subjects with age at diagnosis less than 55, and at age 50 for subjects with age at diagnosis 55 years or above.
Approximate quartiles of height, weight, and WHR were defined on the distribution of controls, and separately for men and women The distribution of BMI was similar in men and women, and the same cut-off points were used for the two genders Odds ratio (OR) and 95% confidence interval (CD were computed using conditional multiple logistic regression models [12], A marked excess of current smokers, especially heavy smokers, and heavy alcohol drinkers was found in cases of oesophageal cancer as compared to controls [13]. All the regression models were conditioned for quinquennia of age. study center and sex. and included terms for non alcohol energy intake, alcohol drinking ( < 2 I . 21-48, > 4 9 drinks/week), tobacco smoking (never smoker, ex-smoker, smoker of 1-14,15-24. ^ 25 cigarettes/day). vegetable and fruit intake.
Results
Table 1 shows the distribution of 395 cases of squamous
cell oesophageal cancer and 1,066 control subjects
accord-ing to height, weight, and BMI, in separate strata of sex,
and the corresponding ORs. Cases tended to be shorter
than controls, but the inverse association with height
was not significant. The ORs for the lowest quartile of
height compared to the highest one were 1.3 for men,
1.4 for women, and 1.4 (95% CI: 0.9-2.2) for both sexes
combined. An inverse association between weight, or
BMI, and oesophageal cancer risk emerged for both
men and women. The ORs for the lowest quartile of
weight compared to the highest one were 2.3 for men,
2.7 for women, and 2.5 for both sexes combined. The
corresponding values for BMI were 2.0 for men, 1.6 for
women, and 1.9 for both sexes combined. In the absence
of allowance of vegetables and fruits, the OR for the
lowest quartile of BMI was 2.1 (95% CI: 1.4-3.1). The
trends in risk were significant for weight and BMI in
men only and in the overall dataset. The OR for the
lowest vs. highest quartile (i.e., <0.90 vs. JsO.97) of
WHR in both sexes combined was 2.1 (95% CI:
1.2-3.8). With reference to the 31 adenocarcinomas, the OR
for subjects with BMI <25.9 vs. ^25.9 was 0.81 (95%
CI: 0.39-1.66).
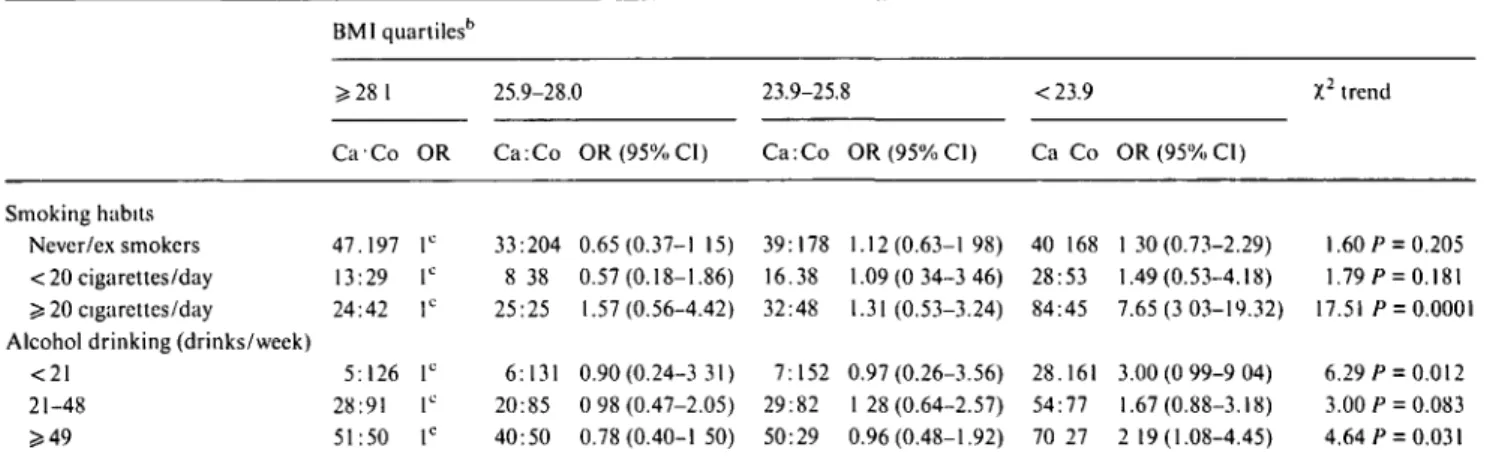
The effect of BMI at diagnosis or interview in
sepa-rate strata of cigarette smoking and alcohol drinking is
examined in Table 2, in men and women combined.
Among never and ex smokers, and moderate smokers,
BMI was not significantly related to cancer risk (OR for
the lowest quartile = 1.3 and 1.5 respectively).
Con-versely, a strong inverse association emerged among
heavy smokers (OR = 7.7; 95% CI: 3.0-19.3). Alcohol
Table 2. Odds ratios (ORs)a and corresponding 95% confidence intervals (95% CI) of squamous cell oesophageal cancer according to body mass index (BMI) in separate strata of alcohol drinking and smoking. Italy and Switzerland, 1992-1999.
Smoking habits Never/ex smokers < 20 cigarettes/day 5:20 cigarettes/day Alcohol drinking (drinks/week)
<21 21-48 ^ 4 9 BMIquartilesb > 28 1 Ca-Co 47.197 13:29 24:42 5:126 28:91 51:50 OR lc lc lc lc lc lc 25.9-28.0 Ca:Co 33:204 8 38 25:25 6:131 20:85 40:50 OR(95%CI) 0.65(0.37-1 15) 0.57(0.18-1.86) 1.57(0.56-4.42) 0.90(0.24-3 31) 0 98 (0.47-2.05) 0.78 (0.40-1 50) 23.9-25.8 Ca:Co 39:178 16.38 32:48 7:152 29:82 50:29 OR(95%CI) 1.12(0.63-1 98) 1.09(0 34-3 46) 1.31 (0.53-3.24) 0.97 (0.26-3.56) 1 28 (0.64-2.57) 0.96(0.48-1.92) <23.9 Ca Co 40 168 28:53 84:45 28.161 54:77 70 27 OR(95%CI) 1 30 (0.73-2.29) 1.49(0.53-4.18) 7.65(3 03-19.32) 3.00 (0 99-9 04) 1.67(0.88-3.18) 2 19(1.08-4.45) X2 trend 1.60 P = 0.205 1.79 p = 0.181 17.51 /> = 0.0001 6.29 f = 0.012 3.00 P = 0.083 4.64 P = 0.031 u Estimate from logistic regression, conditioned for age, center and sex. and including terms for education, non alcohol energy, fruit and vegetable intake, and, in turn, alcohol and tobacco.
b In some strata the sum does not add up to the total because of a few missing values. c Reference category.
drinking, however, did not consistently nor significantly
modify the relation between BMI and risk of squamous
cell oesophageal cancer: the ORs for the lowest BMI
quartile were 3.0 in subjects reporting <21 drinks per
week, 1.7 in those reporting 21 to 48, and 2.2 in those
reporting ^ 49 drinks per week.
In Table 3 the relation between the risk of squamous
cell oesophageal cancer, BMI at different ages, and
weight change is examined in the Italian data-set only.
Cases were not thinner than controls at ages 12, 30, and
50; ORs for the lowest vs. the highest BMI level were 0.9
(95% CI: 0.6-1.4), 0.6 (0.4-1.0), and 1.1 (0.7-1.8)
respec-tively. Weight change in the decade prior to diagnosis
showed no linear association with oesophageal cancer
risk, since the ORs were below unity both for weight loss
(OR = 0.6) and for weight gain (OR = 0.5).
Discussion
The present findings support the observation that
lean-ness is an indicator of squamous cell oesophageal cancer
risk, independently from major recognised risk factors
for oesophageal cancer, including tobacco, alcohol and
related dietary factors [3-5]. The inverse relation was of
similar magnitude when weight, BMI or WHR were
considered. No significant association with BMI was
observed in the few cases of adenocarcinoma although
the point estimate was below unity in leaner subjects,
confirming previous observations [4, 9, 14, 15].
The strength of this study lies in the availability of a
measure of (non alcohol) energy intake, which indicates
that the lower BMI in cases could not be explained by
reduced energy intake in the few years before diagnosis
[16]. It is, therefore, unlikely that the association is
explained by decreased food intake prior to oesophageal
cancer diagnosis. Nor it can be explained in terms of
obvious confounding effects of social class or dietary
Table 3 Distribution of 303 cases of squamous cell oesophageal
cancer and 739 controls according to measures of body mass index (BMI) at various ages, and corresponding odds ratios (ORs) with 95% confidence intervals (CI). Italy. 1992-1997.
Variable
Perceived body size at age 12 Heavier than peers Same
Thinner than peers X2 trend BMI at age 30, kg/nr1' ? 2 5 1 23 4-25.0 21-23 3 <21 8 X2 trend BMI at age 50. kg/m2d >27.4 25.2-27.3 23.2-25.1 <23.2 X2 trend Weight changec Decrease Equal Increase X2 trend Oesopha-geal cancer 77 125 101 77 67 69 59 58 64 64 76 64 79 150 Controls 190 290 259 180 183 171 188 170 160 160 163 154 109 464 OR"(95%CI) lb 1.05(0.70-1.57) 0 92(0.60-1.41) 0.17 (P = 0.683) lb 0.73(0.46-1.16) 0.83(0.52-1 33) 0.63(0.39-1.03) 2.55(^ = 0.111) lb 1.23(0.74-2.03) 1.10(0.66-1.84) 1.10(0.67-1.82) 0.05 (P = 0.822) 0.61 (0.37-1 01) lb 0.49(0.32-0.74) 2.97 (P = 0 085) a Estimates from logistic regression, conditioned for age. sex and center, and including terms for education, tobacco, alcohol, non alcohol energy, fruit and vegetable intake
b Reference category.
c Subjects aged 30 years or more. Subjects aged 50 years or more.
e In the decade before diagnosis/interview. The sum does not add up to the total because of missing values.
factors, since all these covariates had only a modest
influence on multivariate risk estimates.
A potential source of selection bias was the use of
hospital controls. However, when asking about body
weight, our interviewers specifically investigated cases
and controls about their weight in the year before
hospi-tal admission, and medical records were checked for this
purpose. Some of the diagnoses of controls have been
associated with either reduced (e.g., fractures) or
in-creased BMI (e.g., arthritis, cataract) [17, 18]. However,
the association was observed at separate analysis across
various diagnostic categories of controls, and the
distri-butions of height and weight in the comparison group
were similar to those from population surveys in Italy
[19] and Switzerland [20].
The inverse association between BMI and
oesopha-geal cancer was observed in smokers and drinkers and
was stronger in heavy smokers, confirming previous
observations on oral and pharyngeal as well as
oeso-phageal cancer [5, 21]. Alcohol drinking and tobacco
smoking, in fact, can contribute to lowering weight in
oesophageal cancer cases, and several studies showed
reduced body weight - but increased energy intake - in
drinkers as compared to nondrinkers [22-24].
Leanness in the few years before diagnosis may be
associated with decreased intake of protective nutrients
or with increased intake of unfavourable ones [2, 25].
However, intake of vegetable and fruit was not
appre-ciably correlated with measure of BMI (correlation
co-efficient, r = 0.10 for vegetables and r - 0.14 for fruit).
Further allowance for total energy (a possible correlate
of leanness) or vegetables and fruit (two of the major
favourable indicators of oesophageal cancer risk in this
population [25]) did not appreciably modify the
associa-tion observed, and inclusion of all these factors in the
logistic models may well represent an overadjustment.
Weight change in the decade before diagnosis was
not consistently related to oesophageal cancer risk.
Leanness, however, appears to be an indicator rather
than a determinant of the process of oesophageal
carci-nogenesis [26], since this study included information on
lifetime history of body mass, and BMI was not related
to risk several years before diagnosis of oesophageal
cancer. This apparently contrasts with the results of a
companion study on oral and pharyngeal cancer [21],
for which leanness in the distant past remained a strong
determinant of risk.
Acknowledgements
This work was supported by a financial contribution
from the Italian Association for Cancer Research and
the Italian Swiss League Against Cancer. The authors
thank Mrs Judy Baggott and M. Paola Bonifacino for
editorial assistance.
References
1. Negri E. La Vecchia C, Franceschi S et al. Attributable risk for oesophageal cancer in Northern Italy. Eur J Cancer 1992; 28A: 1167-71.
2. Franceschi S, Bidoli E, Negri E et al. Role of macronutrienls, vitamins, and minerals in the aetiology of squamous-cell carci-noma of the oesophagus. Int J Cancer 2000; 86: 626-31. 3. Pottern LM, Morris LE, Blot WJ, Ziegler RG. Esophageal cancer
among black men in Washington DC. I. Alcohol, tobacco, and other factors. J Natl Cancer Inst 1981; 67: 777-83.
4. Chow W-H, Blot WJ, Vaughan TL et al. Body mass index and risk of adenocarcinomas of the esophagus and gastric cardia. J Natl Cancer Inst 1998,90: 150-5.
5. D'Avanzo B, La Vecchia C, Talamini R, Franceschi S. Anthropo-metnc measures and risk of cancers of the upper digestive and respiratory tract. Nutr Cancer 1996; 26: 219-27.
6 Kabat GC. Chang CJ, Wynder EL. The role of tobacco, alcohol use. and body mass index in oral and pharyngeal cancer. Int J Epidemiol 1994:23: 1137-44.
7. Zheng T, Boyle P, Willett WC et al. A case-control study of oral cancer in Beijing, People's Republic of China. Associations with nutrient intakes, foods and food groups. Eur J Cancer B Oral Oncol 1993, 29B: 45-5.
8. Hashibe M. Sankaranarayanan R. Thomas G et al. Alcohol drinking, body mass index and the risk of oral leukoplakia in an Indian population. Int J Cancer 2000; 88: 129-34.
9. Gammon MD, Schoenberg JB. Ahsan H et al. Tobacco, alcohol, and socioeconomic status and adenocarcinoma of the esophagus and gastric cardia. J Natl Cancer Inst 1997: 89: 1277-84. 10. Zhang ZF. Kurtz RC, Sun M et al. Adenocarcinoma of the
esophagus and gastric cardia: Medical conditions, tobacco, alco-hol, and socioeconomic factors. Cancer Epidemiol Biomarkers Prev 1996; 5: 761-8.
11. Levi F, Pasche C, Lucchini Fet al. Food groups and oesophageal cancer risk in Vaud, Switzerland. Eur J Cancer Prev 2000; 9. 257-63.
12. Breslow NE, Day NE. Statistical Methods in Cancer Research, Vol. I. The Analysis of Case-control Studies. IARC Scientific Publication, Lyon: International Agency for Cancer Research 1980: 32.
13. Zambon P, Talamini R, La Vecchia C et al. Smoking, type of alcoholic beverage and squamous-cell oesophageal cancer in northern Italy. Int J Cancer 2000; 86: 144-9.
14. Levi F, Randimbison L, Lucchini Fet al. Epidemiology of adeno-carcinoma and squamous cell adeno-carcinoma of the oesophagus. Eur J Cancer Prev 2001; 10: 1-6.
15. Brown LM, Swanson CA, Gridley G et al. Adenocarcinoma of the esophagus: Role of obesity and diet. J Natl Cancer Inst 1995; 87- 104-9.
16. Albanes D. Caloric intake, body weight, and cancer: A review. Nutr Cancer 1987; 9: 199-217.
17. Negri E, Pagano R, Decarli A, La Vecchia C Body weight and the prevalence of chronic diseases. J Epidemiol Commun Health
1988; 42: 24-9.
18. Zang EA, Wynder EL The association between body mass index and the relation frequencies of diseases in a sample of hospital-ized patients. Nutr Cancer 1994, 21: 247-61.
19. Pagano R, La Vecchia C. Overweight and obesity in Italy, 1990-91. Int J Obesity 1994; 18.665-9.
20. Wiestlisbach V, Paccaud F. Rickenbach M, Gutzwiller F. Trends in cardiovascular risk factors (1984-1993) in a Swiss region: Results of three population surveys. Prev Med 1997; 26. 523-33. 21. Franceschi S, Dal Maso L, Levi Fet al. Leanness as early marker
of cancer of the oral cavity and pharynx. Ann Oncol 2001; 12: 331-6
22. Pagano R, Negri E, Decarli A, La Vecchia C. Smoking and weight in the 1983 Italian National Health Survey. Int J Obes 1987; 11: 333-8.
23. Hellersledt WL, Jeffery RW, Murray DM. The association be-tween alcohol intake and adiposity in the general population. Am J Epidemiol 1990; 132: 594-610.
24. Colditz GA, Giovannucci E, Rimm EB et al. Alcohol intake in relation to diet and obesity in women and men. Am J Clm Nutr
1991; 54: 49-55.
25. Bosetti C, La Vecchia C.Talamini R et al. Food groups and risk of squamous cell esophageal cancer in Northern Italy. Int J Cancer 2000; 87; 289-94.
26. Day NE, Brown CC. Multistage models and primary prevention of cancer. J Natl Cancer Inst 1980, 64: 977-89.
Received 14 November 2000: accepted 23 March 2001.
Correspondence to
Dr S. Gallus
Istituto di Ricerche Farmacologiche'Mario Negri' Via Eritrea, 62
20157 Milano Italy