Improved diffusing wave spectroscopy based on the automatized determination of
the optical transport and absorption mean free path
Chi Zhang1, Mathias Reufer2,†, Danila Gaudino2 and Frank Scheffold1,*
1Department of Physics, University of Fribourg, Fribourg 1700, Switzerland 2LS Instruments AG, Fribourg 1700, Switzerland
Diffusing wave spectroscopy (DWS) can be employed as an optical rheology tool with numerous appli-cations for studying the structure, dynamics and linear viscoelastic properties of complex fluids, foams, glasses and gels. To carry out DWS measurements, one first needs to quantify the static optical properties of the sample under investigation, i.e. the transport mean free path l* and the absorption length la. In the
absence of absorption this can be done by comparing the diffuse optical transmission to a calibration sample whose l* is known. Performing this comparison however is cumbersome, time consuming, and prone to mis-takes by the operator. Moreover, already weak absorption can lead to significant errors. In this paper, we demonstrate the implementation of an automatized approach, based on which the DWS measurement pro-cedure can be simplified significantly. By comparison with a comprehensive set of calibration measure-ments we cover the entire parameter space relating measured count rates (CRt, CRb) to (l*, la). Based on this approach we can determine l* and l
a of an unknown sample accurately thus making the additional
mea-surement of a calibration sample obsolete. We illustrate the use of this approach by monitoring the coars-ening of a commercially available shaving foam with DWS.
Keywords: diffusing wave spectroscopy, microrheology, linear viscoelasticity, light scattering
1. Introduction
Diffusing wave spectroscopy (DWS) is a modern optical technique derived from dynamic light scattering (DLS), allowing the measurements of thermally driven dynamics in strongly scattering media (Maret and Wolf, 1987; Pine et al., 1988; Pine et al., 1990). One of the most significant advantages of this technique is that it allows the measure-ment of the dynamics over a large range of time scales (10−7 to 10 s) and at much shorter length scales (down to ~ 1 nm) than traditional single light scattering experiments (Scheffold and Schurtenberger, 2003; Weitz and Pine, 1993; Zhu et al., 1992). Moreover, DWS can be used to perform non-invasive microrheology, extracting rheologi-cal properties on the micron srheologi-cale without making actual contact to the sample (Furst and Squires, 2017; Mason and Weitz, 1995; Waigh, 2016). Since it was developed in the late 1980’s, DWS has been widely used in the study of soft matter, such as colloidal suspensions, microgels, emulsions, foams, and biological media (Lee et al., 2013; Li et al., 2005; Palmer et al., 1999; Scheffold, 2002; Scheffold et al., 2010).
Since the samples studied with DWS are turbid, one
needs to calculate the intensity autocorrelation function of the multiple scattered light. This can be done by consid-ering the diffuse propagation of photons along paths of different lengths s. Each path length s contributes to the intensity correlation function in a defined way and its weight is determined by the path length distribution. It has been shown that, for a given cuvette size and geometry, the path length distribution only depends on the transport mean free path l* of the sample and the absorption length la (Pine et al., 1988). Using the diffusion equation to model the transport of light in an opaque medium, analytic expressions for the DWS intensity correlation function in dependence of (l*, la) and of the thermally driven colloidal
dynamics can be obtained. For the case of bead motion in a viscous or viscoelastic matrix the internal dynamics is given by the particle mean square displacement (MSD) (Weitz and Pine, 1993). Therefore, to extract the dynamic properties of the sample, one first needs to quan-tify the static, ensemble averaged optical properties (l*, l
a)
of the sample. Since the dynamics of the target sample is not known, this is normally done by comparing the optical properties of the sample with another sample whose l* is
either known, can be calculated or most often can be mea-sured. For example, with the commercial DWS-RheoLab instrument (LS Instruments, Switzerland), an extra sample denoted the ‘calibration standard’ has to be measured prior to the actual measurement of interest. This calibration standard must have similar turbidity (i.e. similar l*) as the
target sample and its dynamics must be known. Typically,
Δr2( )t
〈 〉
# This paper is based on an invited lecture presented by the corresponding author at the 17th International Symposium on Applied Rheology (ISAR), held on May 25, 2017, Seoul.
*Corresponding author; E-mail: [email protected] †Co-corresponding author; E-mail: [email protected]
http://doc.rero.ch
Published in "Korea-Australia Rheology Journal 29 (4): 241–247, 2017"
which should be cited to refer to this work.
for monodisperse particles with known diameter 2R dis-persed in water = 6DBt where DB is the known Brownian diffusion coefficient of the particles. Currently, the instrument first measures l* of the calibration standard
by fitting the correlation function. Then comparing the transmission count rate of the two samples, the instrument then can determine l* for the target sample, with an accuracy
of approximately 5-10% [Technical note, LS Instruments]. However, in some cases, the target sample could be absorbing at the incident laser wavelength. For this case, additional knowledge about the sample absorption length la is required to extract e.g. the MSD. Until now it was not possible to determine the absorption length la with the commercial instrument and therefore the rheological prop-erties of absorbing, or colored, samples could not be accu-rately characterized.
In this paper, we implement an automatized calibration of the DWS measurement procedure. With this approach, we can determine not only the transport mean free path l* directly but also the absorption length la of the sample, by simply measuring the photon count rate of both the light scattered in transmission and backscattering geometry. In this way, the calibration step as well as the preparation of the calibration standard will be no longer needed. This allows us to perform DWS experiments more conve-niently and extend the range of application of quantitative DWS and DWS microrheology to absorbing samples, as long as la >> l*.
2. Methods
The photon count rate of light in the transmission CRt and backscattering geometry CRb are easily measurable. Here we denote with CRb = CRb,VH + CRb,VV the sum of the count rates measured independently for the polarization preserving (VV) and the cross polarized (VH) detection channel. Therefore, if we can derive an unambiguous mathematical relation between (CRt, CRb) and (l*, la), we
will be able to quantify l* and la by simply measuring the photon count rates. Numerically we expect this approach to work even if this relationship is very complicated for a specific experimental configuration (finite cuvette width, residual surface reflectivity and so on).
We begin by summarizing again the most important concepts governing light transport and intensity fluctua-tions and correlafluctua-tions in the frame of DWS which can be obtained by summing over the contribution from all pho-tons arriving at the detector via different optical paths. Denoting P(s) as the probability that the photon follows the path s in the absence of absorption, we can write the field correlation function with absorption as (Weitz and Pine, 1993)
(1)
where τ = 1/k02D0 is the characteristic decay time and C is
the normalizing constant. For simplicity, we consider Brownian motion but the same equations apply more gen-erally to other dynamic processes such as bubble rear-rangements in foams or tracer bead motion in a viscoelastic medium, for the latter t/τ is simply replaced by / 6, where k0= 2πn/λ (laser wavelength λ) denotes the wav-enumber in the scattering medium with a refractive index n. The field correlation function g1(t) is obtained from the
measured intensity correlation function g2(t) in the com-mon way using the Siegert relation g2(t) = 1 +β . The
instrument specific coherence factor β ~ 0.9 is obtained experimentally by extrapolation .
The first exponential term in Eq. (1) describes the pho-ton loss due to possible absorption, and the second expo-nential sums up the decay of correlation due to multiple interactions with scattering particles. Both terms are weighted by the probability that the light follows a path of length s. It has been shown that if the incident laser beam is expanded to fill the full surface of the sample (flat cell geometry, thickness L), we can write the correlation func-tion in transmission as (Weitz and Pine, 1993)
(2)
and for the backscattering direction as
(3)
where Ct, Cb are the normalizing constants which ensure g1(t = 0) = 1, and z0 describes the distance inside the
sam-ple where the light propagation can be considered as dif-fusive. The latter can be roughly estimated as z0≈ l*. In
these equations, Δ = (6t/τ + 3l*/la)1/2 denotes the sum of the particle displacements and the absorption contribution. The normalizing constants Ct, Cb are related to the
trans-mission and backscattering count rate as discussed later in the text. For an ideal, non-absorbing sample, i.e. , always Ct, Cb = 1.
Next, we treat the transmission case explicitly. The backscattering case can be derived in the same way. Since DWS only can be applied in the diffusive limit L > l*, the measured transmission count rate recorded at some scat-tering angle, not too far from the normal, is proportional to the total transmission T (total transmitted flux). We denote the transmission rate of an ideal non-absorbing sample as Tideal (l*). When some absorption is present (quantified by the absorption length la), the transmission coefficient of this sample then can be written as
Δr2( )t 〈 〉 g1( ) = t 1 C ----0 ∞
∫
P s( )e–s/lae2 t/τ( ) s/l * ( ) – ds k02 〈Δr2( )t 〉 g12( )t t→0 g1( ) = t 1 Ct ---L/l*+4/3 z0/l3+2/3 --- sinh z0 l* ----Δ ⎝ ⎠ ⎛ ⎞ + 2 3 ---Δcosh z0 l* ----Δ ⎝ ⎠ ⎛ ⎞ 1 4 9 ---Δ2 + ⎝ ⎠ ⎛ ⎞sin L l* ---Δ ⎝ ⎠ ⎛ ⎞ + 4 3 ---Δcosh L l* ---Δ ⎝ ⎠ ⎛ ⎞ ---g1( ) = t 1 Cb ---sinh Δ L l* --- z0 l* ----– ⎝ ⎠ ⎛ ⎞ + 2 3 ---Δcosh Δ L l* --- z0 l* ----– ⎝ ⎠ ⎛ ⎞ 1 4 9 ---Δ2 + ⎝ ⎠ ⎛ ⎞sinh L l* ---Δ ⎝ ⎠ ⎛ ⎞ + 4 3 ---Δcosh L l* ---Δ ⎝ ⎠ ⎛ ⎞ ---la→∞http://doc.rero.ch
. (4)
Comparing Eq. (4) with Eq. (1) in the limit of t = 0, we can easily see that
(5) where the normalizing constant Ct (l*, la) can be expressed as a function of l* and la using Eq. (2) (for t = 0). It is worth pointing out that here ‘ideal’ stands for the asymp-totic case of a nonabsorbing sample contained in an infinitely wide cuvette and illuminated by an incident plane wave. However, in reality, the width of the cuvettes is finite. Here, we use cuvettes of internal width 9.5 mm shown in Fig. 1. Thus, some loss of the photons on both sides of the cuvette is inevitable. Such photon loss can be treated equal to being absorbed. To characterize such pho-ton loss, we introduce a new parameter la0 as the ‘photon loss length’ of the cuvette, which is an inherent property of the cuvette and is found to be independent of the sam-ple contained within. Using a nonabsorbing samsam-ple whose l* is known, la0 can be obtained by fitting the measured correlation function with Eq. (2), with la0 as the only adjustable parameter. We found in our experiments that measurements of nonabsorbing samples with different l* gave similar la0 when the same cuvette thickness L was used, which confirms that treating the photon loss due to the cuvette geometry as suggested is feasible. The values for la0 we find are of the order of 30-40 mm, independent of l* and only weakly dependent on L. We note that this empirical observation is probably related to the recent observation that the mean path length in multiple light scattering of waves is independent of l* (Pierrat et al., 2014). While beyond the scope of this article, we plan to address this interesting question in more detail in future work.
Now, let us consider the case of a non-absorbing sample with known l*. The count rate of both CRt and CRb can be easily measured with DWS. By measuring the CR for samples with different l*, an empirical relation between
the CR and l* can be established. We denote as CRt0 (l*, la0) and CRb0 (l*, la0) the l* dependent count rate in a cuvette with a finite la0 obtained independently.
After these general remarks, we now turn our attention to the implementation of the automatized calibration pro-cedure. Consider CRt and CRb as the transmission and backscattering count rate measured by DWS for the target sample (l*, la). Substituting CRt0 (l*, la0) and CRb0 (l*, la0) into Eq. (5), we can obtain the following equations
, (6)
(7)
where R is the backscattering rate and la' (1/la' = 1/la0 + 1/ la) is the total photon absorption (or loss) of the target sample. Ct and Cb can be easily expressed as functions of l* and l
a with Eqs. (2) and (3), for t = 0. CRt0 (l*, la0) and
CRb0 (l*, la0) also can be expressed as function of l* and la empirically, as discussed above (details in the next sec-tion). Therefore, l* and l
a can be obtained by solving Eqs.
(6) and (7) numerically.
3. Experiments and Result
To determine the empirical relations CRt0 (l*, la0) and CRb0 (l*, la0) and to verify the automatized calibration approach, we perform a set of DWS-Experiments (λ = 687 nm) on suspensions of polystyrene latex spheres (PS) using a commercial DWS instrument (DWS RheoLab III, LS Instruments, Switzerland), shown in Fig. 2. Mono-disperse PS particles are Mono-dispersed in 2 mM water based SDS (sodium dodecyl sulfate) solution to prevent aggre-gation. In our experiments, particles with diameter 910 nm and 190 nm are both studied to exclude any possible influ-ence of the particle size. Absorption is introduced by add-ing different amounts of green food dye. We checked that this food dye does not adsorb to the PS particle surface. The absorption of the dye was characterized with a simple transmission intensity measurement of the dye solvent (no particles). The transmission intensity of such solvent can be well described by the Beer-Lambert law:
(8)
where I0 is the transmission intensity using pure water
with the same cuvette thickness L, k is the absorption coefficient, and c is the concentration of the dye (mL/µL). By measuring the transmission intensity at the same wave-length as for the DWS experiment using a UV-VIS spec-trometer, we found the absorption coefficient of the dye is k = 1.37 × 10⁻³ mL/mm·µL. Therefore, the absorption length of a sample can be calculated as la = 1/(k · c).
For establishing the empirical relation of CRt0 (l*, l a0) and
CRb0 (l*, la0), for a given cuvette thickness L, we first used
non-absorbing samples with both 910 nm and 190 nm par-ticles. For each cuvette thickness, seven samples with dif-ferent volume fractions (for each particle size) were measured, covering L/l* from less than 5 to more than 80. Since the volume fraction of particles is known, we can calculate l* of the sample using Mie scattering theory as
implemented in ref. (Ochoa, 2004), in the following denoted as l*mie. As shown in Fig. 3, with the same cuvette thickness, the count rates for particles with the same ratio L/l*, but different size, are basically indistinguishable (hence they are presented using the same symbols), except for cases when L/l* is smaller than five. Only for the L = 1 mm data (black open squares) in the upper panel, one can
T l(*, la) = Tideal( ) l* 0 ∞
∫
P s( )e–s/lads T l(*, la) = TidealCt(l*, la) CRt CRt0(l*, la0) --- = T l *, l a′ ( ) T l(*, la0) --- = Ctl *, l a′ ( ) Ct(l*, la0) ---CRb CRb0(l*, la0) --- = R l *, l a′ ( ) R l(*, la0) --- = Cb l *, l a′ ( ) Cb(l*, la0) ---log – It I0 ---⎝ ⎠ ⎛ ⎞ = k c L⋅ ⋅http://doc.rero.ch
see that the count rate starts to divide into two branches (upper: 910 nm; lower: 190 nm) when l*mie is around 200 µm. We did not further explore these differences since accurate DWS measurements are normally restricted to samples with L/l* > 5 (Kaplan et al., 1993). For L/l* < 5 deviations from the diffusion approximation are expected but a detailed analysis of this regime is beyond the scope of our work. The measurements however provide a good estimate for the lower limit L/l* > 5 where our approach can be applied safely.
Next we establish the empirical relation CRt0 (l*, la0) and
CRb0 (l*, la0) for each cuvette thickness L. To this end, we fit the measured data with the following empirical equa-tions.
, (9)
(10)
where A, B, and D are the fitting parameters. As shown in Fig. 3, Eqs. (9) and (10) describe the data well.
We are now ready to apply the automatized calibration, since CRt0 (l*, l
a0) and CRb0 (l*, la0) as function of (l*, la0) are
known. We test the accuracy of our approach with sam-ples whose l* and la are known. To this end, we prepare our sample with the green dye solution instead of pure water, Fig. 1. For each cuvette thickness, at least 4 volume fractions are measured with at least 4 well controlled dye concentrations, covering la from about 5 mm to more than 200 mm. By measuring the count rate in transmission and backscattering, we quantify l* and la, following the approach just described. Here we compare the experimen-tal values to the known reference values: l* from the Mie
calculator, or la calculated from the known dye
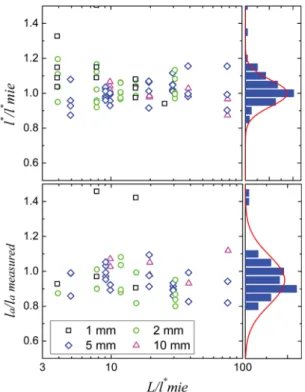
concen-tration using la = 1/(k · c). As shown in Fig. 4, the exper-imentally determined l* and la show no systematic
dependence on neither cuvette thickness L nor L/l* over the region of interest. Fitting the corresponding probability distribution to a Gaussian distribution, the accuracy with respect to determining l* and la is approximately 8% and 14%, respectively, in the region of 5 < L/l* < 100. Com-pared to the previous calibration method, which only can be applied to non-absorbing samples, the auto-calibration approach has similar accuracy with respect to determining l*. Moreover, our approach can characterize, at the same
time, the absorption length la, which was not possible with
the conventional calibration method.
Finally, we verified again, using only non-absorbing samples, whether there exists a direct influence of the par-ticle size on our results that may lead to a hidden system-atic error. We compare the experimentally determined values with l*
mie, now independently for the d = 910 and
CRt0(l*, la0) = At(l*+Btl*2+Dtl*3) CRb0(l*, la0) = Ab l*Db ---e1.9 3l */B b –
Fig. 1. (Color online) Polystyrene particles, diameter 910 nm, in cuvettes with inner thickness L = 5 mm, width 9.5 mm (100-OS, Hellma, Germany). The concentration of green dye, from left to right, is 0, 5 µL/mL, 10 µL/mL, 20 µL/mL, 40 µL/mL, and 80 µL/mL, corresponding to an absorption length of infinity, 146 mm, 73 mm, 36.5 mm, 18.8 mm, and 9.4 mm, respectively. The transport mean free path is 0.55 mm in all cases.
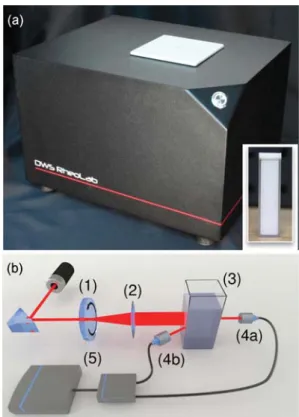
Fig. 2. (Color online) Diffusing wave spectroscopy setup. (a) Commercial DWS instrument (DWS RheoLab III, LSInstru-ments, Switzerland). The inset shows the foam sample contained in a L = 5 mm cuvette before loading the cuvette in the instru-ment. (b) Optical configuration: A coherent light source (Laser, Cobolt, Sweden, λ = 687 nm) is directed to the surface of a ground glass diffuser (2) mounted on a stepper motor. The speckle beam created by the diffuser is used to illuminate a sam-ple cuvette containing the samsam-ple of interest (3). Single mode fiber receivers (4a and 4b) collect the scattered light either in transmission or backscattering and direct it to a single photon counting module and digital correlator (5).
d = 190 nm samples. As shown in Fig. 5, l* shows no
sys-tematic dependence on the particle size in the region of interest. Fitting its probability distribution to a Gaussian distribution, the accuracy is about 5% in the region of 5 < L/l* < 100, slightly better than to the whole set of data
including absorbing samples.
4. Application Example: Coarsening of a
Com-mercial Shaving Foam
To illustrate the use of our approach we have applied the new routine to monitor the coarsening of a commercially available shaving foam (Gillette, USA) with DWS. The experimental device, optical configuration and the foam sample are shown in Fig. 2. Foams are dense assemblies of gas bubbles separated by reflecting liquid thin films that meet at the connections known as the plateau borders. Due to the familiar coarsening of the bubbles due to gas exchange across the film interfaces and subsequent bubble rearrangements we expect both an evolution in the relax-ation time τ and an increase of l* (Durian et al., 1991a). If
one assumes that the size distribution of the foam bubbles remains the same, one can relate directly the transport mean free path l* to the mean bubble radius . The pro-portionality can be derived from the self-similar
coarsening of the foam.
The measurements are done by loading a standard L = 5 mm thickness glass cuvette, width 9.5 mm, with Gillette foam. The DWS RheoLab instrument is operated in dual
R 〈 〉 l*∝〈 〉R
Fig. 4. (Color online) l* (upper) and l
a (lower) characterized with the auto-calibration approach compared with the known value. Each cuvette thickness L is presented with different colors as shown in the legend. The probability distributions are shown with corresponding histogram on the right side of the graphs. Exper-imental measures are presented with blue bars and the fittings to a Gaussian distribution are shown with solid lines.
Fig. 3. (Color online) Count rate of non-absorbing sample mea-sured in transmission (upper) and backscattering (lower) with particle size of both 910 nm and 190 nm. Each cuvette thickness L is presented with a different color as shown in the legend. Symbols denote the experimental data and solid lines show the best fit to the data based on Eqs. (9) and (10).
Fig. 5. (Color online) l* of the non-absorbing sample character-ized with the auto-calibration approach compared with the known value. The data of 910 nm diameter particles is shown in black and of 190 nm particles in red. The probability distribution is shown with a histogram on the right side of the graphs. Exper-imental measures are presented with blue bars and its fitting to a Gaussian distribution is shown with a solid line.
multi-tau/echo mode with a total measurement time of approximately 300 seconds for each run. The time interval between two runs is about 630 s. In every run, the Rhe-oLab first characterizes l* and la based on the
experimen-tally determined count rates CRb, CRt and subsequently the correlation function g1(t) in transmission is recorded. In contrast to earlier pioneering DWS experiments on sim-ilar foams (Durian et al., 1991a), using the new automa-tized approach, there is no need to repeat the measurement for several different L to extract l* and verify that la >> L. This notably reduces the measurement time for the present example and similar time savings are expected for all slowly evolving samples where both the internal dynamics and (l*, la) evolve with time. In addition, the new
algo-rithm simplifies the experiment and leads to more accurate results. This is particularly useful for DWS users not deeply familiar with the optics of diffuse light scattering
experimentation, since they can now determine the key parameters l* and la with ease.
As reported previously we find that g1(t) decays nearly
exponentially, indicating a single relaxation process. We obtain the relaxation time τ from a fit of Eq. (1) to g1(t).
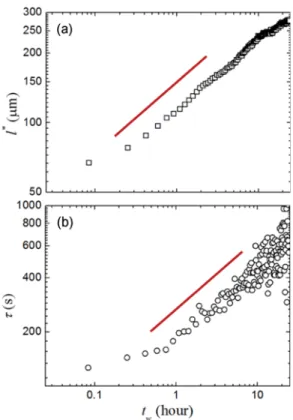
The results both for l* and τ as a function of the waiting time tw are shown in Fig. 6. The results obtained are in overall agreement with previous, more detailed, DWS studies of the foam coarsening process (Cohen-Addad and Höhler, 2001; Durian et al., 1991a; Durian et al., 1991b; Sessoms et al., 2010). This example, taken from a single run of the instrument, demonstrates that DWS can now be an even more convenient tool to monitor slowly evolving complex fluids.
5. Conclusions
In this paper, we present an automatized calibration approach to diffusing wave spectroscopy (DWS) measure-ments. The successfully implemented auto-calibration approach improves the accuracy and simplifies the mea-surement procedure significantly. With this approach, we are now able to determine the transport mean free path l* and the absorption length la of the sample, by simply mea-suring the count rate of the transmission and backscatter-ing in a commercial instrument. In this way, previously required additional time consuming calibration steps, which usually also required careful preparation of a cali-bration and/or cuvettes with different path lengths L, are now obsolete.
Our control experiments show that this auto-calibration approach is practical and accurate. It is robust against scat-tering from particles of different size and can work over a wide range of optical densities L/l*. We demonstrate that the automatized calibration provides an accuracy of around 8% and 5% on determining l*, for absorbing and non-absorbing samples, respectively. Moreover, it allows us to also determine the absorption length la, which
pre-viously was not possible, with an accuracy of about 14%.
Acknowledgements
This project was financially supported by the CTI (Inno-vation promotion agency of the Swiss Confederation) under grant 19278.1 PFNM-NM.
References
Cohen-Addad, S. and R. Höhler, 2001, Bubble dynamics relax-ation in aqueous foam probed by multispeckle diffusing-wave spectroscopy, Phys. Rev. Lett. 86, 4700-4703.
Durian, D.J., D.A. Weitz, and D.J. Pine, 1991a, Multiple light-scattering probes of foam structure and dynamics, Science 252, 686-688.
Fig. 6. (Color online) Time evolution of the transport mean free path l* and the relaxation time τ of a Gillette shaving foam, con-tained in a L = 5 mm cuvette, continuously monitored by DWS over more than 10 h. The absorption length extracted using the new routine is found to be nearly infinite (la >> 10L, i.e. beyond the detection limit) indicating the absence of absorption within the sample as expected given the familiar white appearance of shaving foam. As noted earlier the optical transmission and thus , the mean bubble radius, scales as a power law. Equally the characteristic relaxation time τ increases as a power law for times larger than about 20 min. For more details see refs. (Cohen-Addad and Höhler, 2001; Durian et al., 1991a; Durian et al., 1991b; Sessoms et al., 2010).
T∝l*/L l*∝〈 〉R
Durian, D.J., D.A. Weitz, and D.J. Pine, 1991b, Scaling behavior in shaving cream, Phys. Rev. A 44, R7902-R7905.
Furst, E.M. and T.M Squires, 2017, Microrheology, Oxford Uni-versity Press, Oxford.
Kaplan, P.D., M.H. Kao, A.G. Yodh, and D.J. Pine, 1993, Geo-metric constraints for the design of diffusing-wave spectroscopy experiments, Appl. Optics 32, 3828-3836.
Lee, J.Y., J.W. Hwang, H.W. Jung, S.H. Kim, S.J. Lee, K. Yoon, and D.A. Weitz, 2013, Fast dynamics and relaxation of colloidal drops during the drying process using multispeckle diffusing wave spectroscopy, Langmuir 29, 861-866. Li, J., G. Dietsche, D. Iftime, S.E. Skipetrov, G. Maret, T. Elbert,
B. Rockstroh, and T. Gisler, 2005, Noninvasive detection of functional brain activity with near-infrared diffusing-wave spectroscopy, J. Biomed. Opt. 10, 044002.
Maret, G. and P.E. Wolf, 1987, Multiple light scattering from dis-ordered media. The effect of Brownian motion of scatterers, Z. Phys. B-Condens. Mat. 65, 409-413.
Mason, T.G. and D.A. Weitz, 1995, Optical measurements of fre-quency-dependent linear viscoelastic moduli of complex fluids, Phys. Rev. Lett. 74, 1250-1253.
Ochoa, L.F.R., 2004, Structure, Dynamics and Photon Diffusion in Charge-stabilized Colloidal Suspensions, Ph.D Thesis, Uni-versité de Fribourg.
Palmer, A., T.G. Mason, J. Xu, S.C. Kuo, and D. Wirtz, 1999, Diffusing wave spectroscopy microrheology of actin filament networks, Biophys. J. 76, 1063-1071.
Pierrat, R., P. Ambichl, S. Gigan, A. Haber, R. Carminati, and S.
Rotter, 2014, Invariance property of wave scattering through disordered media, Proceedings of the National Academy of Sci-ences 111, 17765-17770.
Pine, D.J., D.A. Weitz, J.X. Zhu, and E. Herbolzheimer, 1990, Diffusing-wave spectroscopy: Dynamic light scattering in the multiple scattering limit, J. Phys. France 51, 2101-2127. Pine, D.J., D.A. Weitz, P.M. Chaikin, and E. Herbolzheimer,
1988, Diffusing wave spectroscopy, Phys. Rev. Lett. 60, 1134-1137.
Scheffold, F., 2002, Particle sizing with diffusing wave spectros-copy, J. Dispersion Sci. Technol. 23, 591-599.
Scheffold, F., P. Díaz-Leyva, M. Reufer, N.B. Braham, I. Lynch, and J.L. Harden, 2010, Brushlike interactions between thermo-responsive microgel particles, Phys. Rev. Lett. 104, 128304. Scheffold, F. and P. Schurtenberger, 2003, Light scattering probes
of viscoelastic fluids and solids, Soft Mater. 1, 139-165. Sessoms, D.A., H. Bissig, A. Duri, L. Cipelletti, and V. Trappe,
2010, Unexpected spatial distribution of bubble rearrange-ments in coarsening foams, Soft Matter 6, 3030-3037. Waigh, T.A., 2016, Advances in the microrheology of complex
fluids, Rep. Prog. Phys. 79, 074601.
Weitz, D.A. and D.J. Pine, 1993, Diffusing-wave spectroscopy, In: Brown, W., eds., Dynamic Light Scattering: The Method and Some Applications, Oxford University Press, New York, 652-720.
Zhu, J.X., D.J. Durian, J. Müller, D.A. Weitz, and D.J. Pine, 1992, Scaling of transient hydrodynamic interactions in con-centrated suspensions, Phys. Rev. Lett. 68, 2559-2562.