LCA OF CHEMICALS
Life cycle assessment of fine chemical production: a case
study of pharmaceutical synthesis
Gregor Wernet&Sarah Conradt&Hans Peter Isenring& Concepción Jiménez-González&Konrad Hungerbühler
Received: 11 June 2009 / Accepted: 25 October 2009 / Published online: 9 February 2010
# Springer-Verlag 2010
Abstract
Background, aim, and scope Pharmaceuticals have been recently discussed in the press and literature regarding their occurrence in rivers and lakes, mostly due to emissions after use. The production of active pharmaceutical ingre-dients (APIs) has been less analyzed for environmental impacts. In this work, a life cycle assessment (LCA) of the production of an API from cradle to factory gate was carried out. The main sources of environmental impacts were identified. The resulting environmental profile was compared to a second pharmaceutical production and to the production of basic chemicals.
Materials and methods Detailed production data of a pharmaceutical production in Basel, Switzerland were used as the basis of this work. Information about the production of precursor chemicals was available as well. Using models
and the ecoinvent database to cover remaining data gaps, a full life cycle inventory of the whole production was created. Using several life cycle impact assessment methods, includ-ing Cumulative Energy Demand (CED), Global Warminclud-ing Potential (GWP), Eco-Indicator 99 (EI99), Ecological Scarcity 2006, and TRACI, these results were analyzed and the main sources of environmental burdens identified. Results Pharmaceutical production was found to have significantly more environmental impacts than basic chem-ical production in a kilogram-per-kilogram basis. Compared to average basic chemical production, the API analyzed had a CED 20 times higher, a GWP 25 times higher and an EI99 (H/A) 17 times higher. This was expected to a degree, as basic chemicals are much less complex molecules and require significantly fewer chemical transformations and purifications than pharmaceutical compounds. Between 65% and 85% of impacts were found to be caused by energy production and use. The fraction of energy-related impacts increased throughout the production process. Feedstock use was another major contributor, while process emissions not caused by energy production were only minor contributors to the environmental impacts.
Discussion The results showed that production of APIs has much higher impacts than basic chemical production. This was to be expected given the increased complexity of pharmaceutical compounds as compared with basic chem-icals, the smaller production volumes, and the fact that API production lines are often newer and less optimized than the production of more established basic chemicals. The large contributions of energy-related processes highlight the need for a detailed assessment of energy use in pharmaceutical production. The analysis of the energy-related contributions to the overall impacts on a process step level allows a comprehensive understanding of each process’ contribution to overall impacts and their energy intensities.
Responsible editor: Roland Hischier
Electronic supplementary material The online version of this article (doi:10.1007/s11367-010-0151-z) contains supplementary material, which is available to authorized users.
G. Wernet (*)
:
S. Conradt:
K. Hungerbühler Swiss Federal Institute of Technology (ETH Zurich), Institute for Chemical and Bioengineering,Wolfgang-Pauli Str. 10, HCI, 8093 Zurich, Switzerland e-mail: [email protected] H. P. Isenring F. Hoffmann-La Roche, Basel, Switzerland C. Jiménez-González
Sustainability and Environment, GlaxoSmithKline (GSK),
Five Moore Drive, P.O. Box 13398, CS-1152, Research Triangle Park, NC 27709, USA DOI 10.1007/s11367-010-0151-z
Conclusions Environmental impacts of API production were estimated in a cradle-to-gate boundary. The major contributors to the environmental impacts in aggregating methods were resource consumption and emissions from energy production. Process emissions from the pharmaceu-tical manufacturing plant itself were less of a concern in developed countries. Producers aiming to increase their sustainability should increase efforts to reduce mass intensity and to improve energy efficiency.
Recommendations and perspectives Pharmaceutical com-panies have increased their efforts to optimize resource efficiency and energy use in order to improve their environmental performance. The results of this study can be used as a first step to perform a full cradle to grave LCA of pharmaceutical production and use, which could include other important phases of the pharmaceutical product life cycle. To assess a commercial pharmaceutical, the results of API production have to be compared to the contributions of other ingredients and formulation.
Keywords Chemical production . Energy efficiency . Energy use . LCA of chemicals . Pharmaceuticals
1 Background, aim, and scope
The life cycles of pharmaceuticals have recently become a concern for many environmental scientists. Many pharma-ceutical compounds pass through the human and animal body, and these substances and their metabolites are more and more often encountered in the environment where they may have harmful effects (Buser et al.1999; Heberer2002; Loffler et al. 2005). In contrast, the production of pharmaceutical compounds has not been widely analyzed (Kummerer 2008). Few studies exist (Jiménez-Gonzalez 2000; Jiménez-Gonzalez et al.2004), and detailed produc-tion data on pharmaceuticals are not publicly available, as their production parameters are usually confidential. A full life cycle inventory (LCI) of a pharmaceutical product would, however, be very helpful to put the effects of use and disposal into context and to assess the environmental impacts of the production processes against other phases of the lifecycle, such as distribution, end-of-life, etc. Further-more, pharmaceuticals are among the most complex chemicals produced, and the available data on fine chemical production are very scarce in general. Some models for estimations of fine chemical production exist (Wernet et al. 2008, 2009), but no detailed LCI of a pharmaceutical has been published, although some life cycle impact assessment (LCIA) results have been made public on a comparative rather than absolute basis. The reasons for this are, besides the problems of confidentiality, the specialized processes involved in the production of pharmaceuticals and other
fine chemicals. They are produced not in continuous processes but in discreet batches, which may vary in size from batch to batch. They are commonly produced in multi-purpose plants (Szijjarto et al. 2008), sharing equipment and facilities between production lines. This makes energy inventories extremely difficult to obtain, as usage of steam and electricity is usually measured only on a building level. In addition, pharmaceuticals may be difficult to synthesize, but their benefits justify unusual costs and efforts to produce them. The chemistry of pharmaceutical production is, therefore, often specialized and resource intensive. Additionally, the large number of process steps may introduce large uncertainties due to error propagation over the production. This means that process models and estimations which result in acceptable errors over two or three process steps may not be applicable in fine chemical inventories as the total error would render the result meaningless.
The usually small production quantities in pharmaceuti-cal production also mean that often little effort is undertaken to optimize production. As production costs are generally outweighed by the costs of R&D or marketing (these often require up to 80% of the total development costs), the economic incentive to optimize production is lower than in the production of other chemicals. In addition, there is less time to increase the efficiency of the processes as time to market is crucial for pharmaceuticals. For these reasons, processes may be more resource intensive and less efficient than other, fully optimized processes. An additional factor is that pharmaceuticals often undergo formulation and purification processes after production to ensure product purity and that the pharma-cological function is maximized. These steps can also be very energy and resource intensive. As resource-intensive productions are often also environmentally problematic (Huijbregts et al. 2006), this raises the question of the impacts of pharmaceutical production. Mass-intensity analyses (Sheldon 1994) are sometimes carried out in the pharmaceutical industry. However, energy use and emissions are not commonly assessed from a life cycle perspective.
In this work, we analyzed the full synthesis of a pharmaceutical compound produced by F. Hoffmann-La Roche in Basel, Switzerland. This allowed us to do a full, “cradle-to-factory-gate” LCI of the production and thus a LCIA of the production. We determined the impacts of energy-related resource uses and emissions (e.g., for the production of steam or electricity) and were thus able to determine the relative impacts of energy production and use compared to, e.g., feedstock uses and process emissions. The results were compared to the internal cradle-to-gate LCI data of another active pharmaceutical ingredient (API). This was done to assess whether the production profile of the analyzed pharmaceutical is similar. The LCIA results
for this second substance had been previously published in the literature (Jiménez-Gonzalez et al.2004) although not in absolute terms. The inventory data of this second API were gathered using in-house methods (Curzons et al.2007; Jiménez-Gonzalez et al. 2004) and were re-evaluated for this work to ensure that the results of this study are comparable on a relative level.
The scope for this study was the production of the APIs from the cradle to the substance. Galenic formulation (final production steps of a pharmaceutical, e.g., preparation of the pill/solution or additional steps to improve API uptake in the body) was excluded; only the APIs themselves were assessed. All results were based on a functional unit of 1 kg of API. Further manufacture of the commercial products, use phase, and end-of-life are excluded.
The results of this article offer an additional insight on the production life cycle of pharmaceuticals, which up till now has not been discussed in this detail in the literature. They provide an idea of the magnitude of the environmen-tal life cycle impacts related to API production. They are, therefore, a useful help to LCA practitioners, especially in the fields of medication and health.
2 Materials and methods
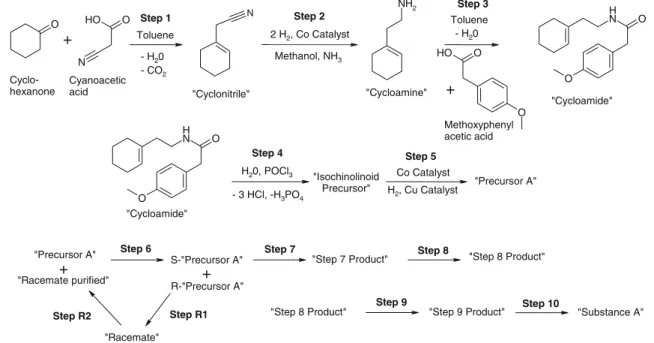
The name of the API is confidential; we, therefore, refer to it as“substance A” in this paper. It is produced in ten steps starting with cyanoacetic acid. The first five synthesis steps happen off-site; the remaining five of the production steps take place in a Roche plant in Basel, Switzerland. As A is a chiral substance, two additional production steps are required in Basel for the racemization of the unwanted enantiomer. Data on the production in Basel was extensive. Production documentation and measurements were provided, including results of a mass flow analysis. These allowed a precise determination of the mass flows for the seven production steps in the main plant in Basel. Flows to waste treatment facilities were also described. We used models for waste solvent distillation (Capello et al. 2007a, 2008) and incineration (The ecoinvent centre 2008a, b) as well as for waste water treatment (Jodicke et al. 2001; Köhler et al. 2007) to describe the treatment processes. These efforts were assisted by information about the specific waste treatment options employed by Roche. In particular, measurements were made to determine the concentration of A and intermediates in waste water after treatment, the results of which were made available. Energy flows were less well documented. The production equipment is used exclusively for the production of A, but A is produced in batches and the plant contains several other production lines. Use of steam and electricity was only estimated by Roche over the whole production and then allocated to all production steps in a
simplistic manner. Therefore, these data were not used and steam use was modeled instead of using specific models (Capello et al. 2007b) and thermodynamic calculations. All electricity processes are based on an average European production (UCTE-Union for the Coordination of Transmis-sion of Electricity). Results based on Swiss production were calculated but are not presented here, as the very distinct Swiss electricity mix makes comparison to average European chemical production difficult. All these efforts were assisted by the process engineers running the plant who offered valuable insights and guidance. Substance A is used in solution; therefore, the last steps include purification techni-ques but no galenic formulation.
Less data were available on the production of the precursor. The synthesis route was provided, but detailed measurements of mass and energy flows were not available. These reactions were described using publicly available data (Thieme Chemistry 2009; Ullmann's Encyclopedia of Industrial Chemistry 2006) and expert knowledge. The ecoinvent database (The ecoinvent centre 2008a) was used to supply data on starting materials and auxiliaries. Some materials, such as bromine, were not covered by the ecoinvent database. We gathered inventory data on these processes from public sources and used models to complete data gaps, e.g., bromine is generated by debromination of bromide-rich brine. A full overview of the synthesis process can be seen in Fig.1. Structural formulae are shown as long as confidentiality issues allowed it.
During the creation of all inventories, we followed a set of standards (Hischier et al.2004) to ensure consistency. As a last choice in cases of missing data, we chose standard estimations to comply with ecoinvent standards to ensure compatibility of the data. Ecoinvent’s pedigree matrix ap-proach (The ecoinvent centre2008b) was applied to describe uncertainties to allow an uncertainty analysis of the final results. As the production of APIs is a very specialized process, no by-products of value were generated during production— the only exception being steam, which was reused in the same processes as overall steam requirements were high. We were, therefore, able to avoid allocation problems.
Energy use can often be a major source of impacts in chemical production, and we wanted to examine whether the same is true for pharmaceutical products. We used an adapted version of the Brightway LCA model (Mutel and Kestenholz2008) to determine the impacts over the whole production life cycle that are caused directly or indirectly by the use and production of electricity, steam, and transport processes. This methodology was developed to specifically identify the fraction of the overall impacts due to energy use over the life cycle. All resource uses and emissions from energy processes (heat, steam, and electric-ity) and transport processes were identified by recursively parsing the ecoinvent database’s unit processes. All
upstream impacts of these energy-related processes were included as well. As the impacts of transport were minor (in the range of less than 1 to a few percent of the overall results), all results of the impact source analysis were aggregated into energy-related (i.e., due to production and use of electricity and steam and use of transport processes) and remaining impacts (these are mostly due to feedstock use and process emissions). Simply put, the energy-related impacts are the impacts of all energy use processes, including their upstream resource uses and emissions. Correspondingly, the remaining impacts represent the impacts of the production in a hypothetical scenario where transport, electricity, and heat are freely available without any requirements or negative impacts. This analysis provides decision-aid for the producing companies on which impacts they should focus on when improving the production. It may also help to identify potential screening indicators for shortcut methods in the future, which is important because data availability is an issue concerning pharmaceutical products.
To ascertain whether the impacts generated are some-what representative of API production, we compared them with the production inventory of substance B, an API produced by GlaxoSmithKline (GSK). Relative, but not absolute, LCIA results for API B have been published in the literature in 2004 (Jiménez-Gonzalez et al.2004). The original (confidential) LCI results, rather than the LCIA values published in 2004, were used for this study and were analyzed and slightly updated to ensure comparability to the assessment of A. A and B are unrelated in structure, use, and synthesis, with the exception that both are produced as pure enantiomers by means of an enantiomeric
separation. The production inventory of B was generated in-house by GSK and the absolute results are confidential, but an analysis of the composition of the environmental impacts allowed a comparison to A.
Several LCIA methods were chosen for the environmental assessment of the two substances. As the original inventory data are confidential, results for a large selection of LCIA methods were calculated and are presented here. In choosing the methods, we aimed to cover many important areas of environmental impacts as well as the demand for results of aggregating methods. Resource use was represented by the Cumulative Energy Demand (CED; Verein Deutscher Ingenieure 1997), a method assessing the primary energy demand of the production. This is a good indicator for chemical production in particular, as oil and gas are both the main energy source and the main material feedstock for chemical production. The Global Warming Potential (GWP; The Intergovernmental Panel on Climate Change 2007) addresses what may be the most discussed environmental issue of our time, and many studies require GWP data. Eco-indicator 99 (EI99; Goedkoop and Spriensma2000), the newer ReCiPe (Goedkoop et al.2009), IMPACT2002+ (Jolliet et al. 2003), Ecological Scarcity 2006 (ES2006; Frischknecht et al. 2006), and Tool for the Reduction and Assessment of Chemical and Other Environmental Impacts (TRACI) (Bare et al.2003,2006) are all methods that assess various environ-mental impacts. EI99, IMPACT2002+, and ReCiPe offer end-point results for a set of environmental damages and weighs results based on the decisions of a panel of experts. ES2006 is based on the“distance-to-political-target” principle, determin-ing the impact of processes based on how close they come to or exceed regulatory targets for emissions and resource uses. N O O H N O NH2 O O H O N H O O N H O O Toluene 2 H2, Co Catalyst Methanol, NH3 Cyclo-hexanone + Cyanoacetic
acid "Cyclonitrile" "Cycloamine" +
Methoxyphenyl acetic acid Toluene "Cycloamide" "Isochinolinoid Precursor" Co Catalyst H2, Cu Catalyst "Precursor A" - H20 - CO2 H20, POCl3 - 3 HCl, -H3PO4 "Cycloamide" "Precursor A" "Racemate purified" "Racemate" S-"Precursor A" R-"Precursor A"
"Step 7 Product" "Step 8 Product"
Step 7 Step R1 Step 8 Step R2 Step 6 + "Step 9 Product"
"Step 8 Product" Step 9 Step 10 "Substance A"
+
- H20
Step 1 Step 2
Step 3
Step 4 Step 5
Tool for the Reduction and Assessment of Chemical and Other Environmental Impacts (TRACI) assesses environmen-tal damages with a North American perspective and provides mid-point results. EI99 and ES2006 also offer aggregated, single-score results. These methods were selected to cover most areas of interest, often using various approaches, although other methods do exist (e.g., DeWulf et al. 2007; Rosenbaum et al.2008; Huijbregts et al.2008) and this list is not meant to be fully comprehensive. For the discussion of the results, the methods CED and EI99 were used for the most part. Although the ReCiPe method may well replace EI99 in the long term, we chose this method to discuss the results here as many LCA practitioners are familiar with it.
3 Results
The results show that both the resource use and the emission impacts of the production of the pharmaceutical A are quite high per functional unit, reflecting the extraordinary efforts required to produce the complex structure of the substance and for the enantiomeric separation. Monte Carlo simulations with 1,000 runs each were used to determine the uncertainties of the results using the pedigree matrix approach (The
eco-invent centre2008b), a system using data quality indicators to qualitatively assess the reliability of the results. In this system, results are judged to be more uncertain if the underlying data may not describe the actual production processes well. The CED of 1 kg of substance A is 1,430 MJ-eq/kg of substance A, and the GWP is 67.6 kg CO2-eq/kg product. Full results can be seen in Table1.
The inventory data of substance B allowed a relative comparison of the two production processes using EI99. In general, substance B required more resources and energy than substance A. From a chemical perspective, this was not surprising as the synthesis of B is more complex. A direct comparison of the data is possible, but it should be noted that data gathering and modeling methods were not coordinated. Especially inventory areas likely to rely on fewer measurements and on models (e.g., aqueous emis-sions and some air emisemis-sions) may be affected by systematic differences. Nevertheless, Fig. 2shows that the EI99 impact profiles share similarities. Both productions are very resource intensive, B even more so than A. Analyzing the results in further detail showed that the resource uses were almost entirely due to fossil fuel use. The human health impacts were mostly due to global warming and respiratory effects from inorganics.
Ecosys-LCIA method Result (standard deviation)
CED [MJ-eq/kg product] 1,430 (252)
GWP [kg CO2-eq/kg product] 67.6 (8.3)
Eco-Indicator 99 (H/A) total [points/kg product] 4.76 (0.92) Eco-Indicator 99 (H/A) human health [points/kg product] 1.67 (0.24) Eco-Indicator 99 (H/A) ecosystem quality [points/kg product] 0.36 (0.63) Eco-Indicator 99 (H/A) resources [points/kg product] 2.73 (0.47) Ecological Scarcity 2006 [Umweltbelastungspunkte/kg product] 100,000 (15,600) TRACI smog [kg NOx-eq/kg product] 0.115 (0.018) TRACI respiratory effects [kg PM2.5-eq/kg product] 0.113 (0.018) TRACI global warming [kg CO2-eq/kg product] 68.6 (9.7) TRACI ozone depletion [kg CFC-11-eq/kg product] 9.30E−6 (1.90E−6) TRACI non-carcinogenics [kg toluene-eq/kg product] 655 (300) TRACI eutrophication [kg N-eq/kg product] 0.152 (0.030) TRACI ecotoxicity [kg 2,4-D-eq/kg product] 98.1 (22.7) TRACI carcinogenics [kg benzene-eq/kg product] 0.124 (0.051) TRACI acidification [H+ mol-eq/kg product] 21.2 (3.5) ReCiPe (H/A) total [points/kg product] 7.01 (0.92) ReCiPe (H/A) human health [points/kg product] 2.78 (0.48) ReCiPe (H/A) ecosystem quality [points/kg product] 2.70 (0.33) ReCiPe (H/A) resources [points/kg product] 1.54 (0.18) IMPACT2002+ total [points/kg product] 2.3E−2 (3.2E−3) IMPACT2002+ resources [points/kg product] 9.4E−3 (1.8E−3) IMPACT2002+ human health [points/kg product] 5.9E−3 (8.1E−4) IMPACT2002+ ecosystem quality [points/kg product] 9.6E−4 (1.8E−4) IMPACT2002+ climate change [points/kg product] 6.7E−3 (7.8E−4) Table 1 Results of the life
cycle impact assessment of the pharmaceutical A
tem quality impacts are negligible for B and small (8%) for A. Half of these were land use impacts as an auxiliary for the synthesis of A was produced from starch. Measurements showed no emissions above the detection limit of A and any intermediates after waste water treatment and air emissions were minimal, which may explain the relatively low impacts. The use of the Brightway model allowed an analysis of the impact sources over the whole production life cycle of A, separated through the classification of individual processes into different categories. This separation is critical for chemicals, as oil and natural gas are both the major sources of energy and the major feedstocks for production. Transport impacts were minimal (less than 3% usually); therefore, transport and energy production and use were grouped together as “energy-related” impacts. All impacts due to these process types, including their upstream processes, were separated from the remaining impacts. Figure3 shows the fractions of energy-related impacts for
several methods as they develop over the synthesis of substance A. Energy-related impacts of A are high, over 65% for EI99 and ES2006 and over 80% for the CED and GWP. In addition, the energy-related fraction of impacts generally increases throughout the production. This effect is observable for several LCIA methods, especially the CED and GWP as well as the aggregating methods. Some impact categories, such as Tool for the Reduction and Assessment of Chemical and Other Environmental Impacts (TRACI) Acidification, can be dominated by the impacts of single processes. In these cases, no clear trend is observable. Overall, many categories of the analyzed methods show an increase in the fraction of energy-related impacts over the production.
Again, the EI99 results of substance A were compared to the results for substance B. Energy-related fractions of raw material use and emissions were provided by GSK. Figure 4a shows that the energy-related fraction of the impacts of the production of B are even higher for the GWP and ES2006 than those of A, about 20% lower for the CED and roughly equal for EI99.
40% 50% 60% 70% 80% 90% 100% 0 1 2 3 4 5 6 7 8 9 10
Process steps starting from cyanoacetic acid
Ener
gy-related impacts [%]
CED GWP 100a EI99 ES2006
Fig. 3 Relative impacts of energy production and use over the production of A for the CED, GWP, EI99, and ES2006. The fraction of energy-related impacts increases towards the end of the synthesis for all categories shown as well as for most other categories and methods 0% 10% 20% 30% 40% 50% 60% 70% 80% 90% 100% Substance A Substance B Eco-indicator 99 Score
Human Health Ecosystem Quality Resources
Fig. 2 Relative comparison of the Eco-indicator 99 (H/A) score composition of the two pharmaceuticals
0% 20% 40% 60% 80% 100% A B A B A B A B
CED GWP EI99 ES2006
Impacts
remaining impacts energy-related impacts
0% 20% 40% 60% 80% 100% A B A B A B Ecosystem Quality
Human Health Resources
Impacts
remaining impacts energy-related impacts
a
b
Fig. 4 a Energy-related fractions of the total impacts for A and B for the CED, GWP, EI99, and ES2006. b Energy-related and remaining impact composition of the EI99 scores relative to the total scores for A and B
Figure4bshows the EI99 subcategories and the energy-related fractions of these. The energy-energy-related fractions of the resources impacts are 70% for A and 59% for B. For human health impacts, 67% for A and 91% for B are energy-related, and for ecosystem quality, the energy-related impacts make up 36% for A and 59% for B. The relative contri-butions of human health and ecosystem quality impacts are higher for A than for B. By contrast, B has higher relative resource use impacts than A. This may be related to the higher absolute resource use required for B, which may dominate other impacts in a relative perspective. Among the non-energy-related impacts for substance A, the largest contributions are land use (required for an auxiliary) for ecosystem quality and the aqueous emissions of the production of phosphoric acid (required for one of the process steps at the plant in Basel) for human health. Unsurprisingly, the biggest resource impacts not related to energy production and use are due to feedstock requirements. For ES2006, resource use was only a minor factor. Nevertheless, the production impacts are mostly energy-related. The remaining impacts were due to process emissions. In the case of A, most of the remaining impacts occurred during the production of auxiliaries, which were based on ecoinvent data. This is in agreement with the emission measurements taken in the plant and waste treatment facility in Basel, where harmful emissions were minimal.
4 Discussion
The results of the detailed inventory analysis of A showed a vast difference in environmental impacts between basic chemical production and pharmaceutical synthesis. This is not surprising considering that API molecules are signifi-cantly more complex than basic chemicals. In addition, APIs require significantly more chemical transformations and purification and require more raw materials in the synthesis. For instance, bulk chemicals typically require between one and two chemical transformations, while pharmaceutical active ingredients usually require six or more, as shown in Table 2. Each transformation adds requirements and leads to material losses, as yields can be as low as 70% in fine chemical production. Among industrial chemists, the number of transformations is often
used as a rough indicator of the costs and complexities of a production line.
The uncertainties calculated with the pedigree matrix approach allow an assessment of the underlying data quality. The biggest source of uncertainties were the modeling of the precursor production, where no direct measurements were available, and the use of ecoinvent processes to model background processes. Nevertheless, uncertainties are well below the actual impact scores, usually by about an order of magnitude or a little less (see Table 1). Considering the use of direct industry measure-ments for the most critical steps of the production, uncertainties were expected to be reasonably low, giving the results a greater reliability.
The analysis revealed that the requirements and impacts of A’s production are much larger than for most chemicals. To put the results in context, a comparison with an analysis of 78 basic and mass-produced organic chemicals (Wernet et al., submitted) showed that the average CED of a basic
chemical production is only 5% of the CED of A’s
synthesis when analyzed per kilogram of product. Further-more, the average basic chemical production impacts are only 4% for the GWP, 6% for EI99, and 3% for ES2006 when compared to the production of A. For some individual Tool for the Reduction and Assessment of Chemical and Other Environmental Impacts (TRACI) impact categories, this percentage dropped to less than 1%. After discussions with plant managers from Roche and the comparison to substance B, the production of A was also judged to be a rather simple representative of current pharmaceutical synthesis. The experts agreed that many pharmaceuticals are even more complex in their production than substance A. This helps to put the results in Table 1 into perspective. The environmental impacts of the produc-tion of 1 kg of A are more than one and sometimes two orders of magnitude higher than those of an average basic chemical production. On the other hand, the production volumes of pharmaceuticals and other fine chemicals are much smaller than those of many basic chemicals (see Table2). Pharmaceuticals are usually produced in batches of only a few tons or even less than a ton per year. Therefore, these higher impacts per kilogram are not necessarily problematic when analyzed from a global perspective. This study aims more to increase the knowledge of
pharmaceu-Industry Annual
production (tons)
Estimated total waste—tons per annum
Typical no. of transformations
Years of development Oil refining 10E06–10E08 10 million Separations 100+ Bulk chemicals 10E04–10E06 5 million 1–2 10–50 Fine chemicals 10E02–10E04 0.5 million 3–4 4–7 Pharmaceuticals 10–10E02 0.1 million ≥6 3–5 Table 2 The production of
APIs in perspective (adapted from ACS2008)
tical and fine chemical production in general. In addition, it should raise awareness of the need to analyze these systems in a holistic manner in companies where a life cycle approach is not yet implemented, as our results of the detailed production analysis of substance A revealed that the vast majority of impacts in all impact categories are due to upstream emissions and resource uses. An environmental analysis of just the production plant in Basel would misrepresent the total environmental impacts of the produc-tion both in size and composiproduc-tion.
The analysis of the fraction of impacts related to energy production and use as well as transport revealed that energy-related impacts are very relevant. Moreover, 65% to 85% of the overall cradle-to-gate impacts of substance A in Fig. 3 are energy-related. This shows that modern regulatory efforts have succeeded in reducing harmful emissions from chemical production but highlights the additional need for a deeper analysis of energy use and efficiency. As steam is produced on-site in Basel, green-house gases emitted during steam production would be counted into the emission profile of the plant. However, other chemical sites may have different means of obtaining steam, including nearby but external sources. This would allow producers to shift emission burdens to other companies when analyzing the environmental performance on a smaller scope, e.g., plant level. Considering the importance of impacts from energy production, this means that a life cycle approach is necessary.
For substance B, energy is mostly used in the supply chain. Energy use in the plant itself is only a minor contributor (Jiménez-Gonzalez et al.2004). For substance A, energy use in the plant is more significant but still between 20% and 50% of the total energy use for most LCIA methods. It should be noted that energy-intensive processes such as distillation can often reduce the need for energy-demanding solvents. Therefore, the treatment meth-od may shift the burden of the energy required for either solvent production or recycling. The results demonstrate that mass-intensity analysis (Sheldon 1994) may be a valuable tool for the pharmaceutical industry but that an additional examination of energy use is helpful to accu-rately assess the full environmental impacts. LCA, being in effect an extension of mass intensity analysis, offers a more complete assessment.
Furthermore, a detailed analysis of Fig.3 could identify processes critical for energy use. For example, the overall CED increases in step 6, the enantiomeric separation. Most of the CED increase is due to energy requirements during the process; therefore, the fraction of energy-related CED impacts increases. However, most of the energy use is due to steam generated with natural gas, a very efficient process. Therefore, the GWP, which has reached a high plateau by step 4, is less affected. In general, the fraction of energy-related impacts
increases over the production cycle for all categories shown in Fig.3. As energy-related impacts are similarly important for substance B, this indicates that energy production and use are of high relevance in fine chemical production.
Looking at the detailed EI99 analysis in Fig. 4b, the distribution of the energy-related impacts can be deter-mined. The majority of the resource impacts for both substances are energy-related. In addition, energy-related impacts play a large role for human health impacts, mostly due to respiratory impacts and greenhouse gas emissions. The remaining resource impacts are due to the physical feedstock requirements of the production. The other remaining impacts in the human health and ecosystem quality categories are only relatively minor contributions to the overall environmental impact. This is noteworthy as the traditional areas of concern in chemical production, e.g., harmful chemical emissions from the chemical production plant, are included in these categories. While some concerns exist about emissions from production sites in developing countries where oversight is low (Kummerer 2008), pharmaceutical production in developed countries today is, therefore, less a concern due to process emissions and more due to indirect emissions and resource consump-tion related to energy producconsump-tion and use. However, this analysis does not imply that emissions to the environment are not relevant during later life-cycle stages.
As only the active ingredients were analyzed in this study, it should be noted that the final formulation of pharmaceuticals can include additional resource-intensive steps. Other materials for pharmaceuticals often make up the majority of the pharmaceutical by mass, but are generally much simpler to produce. Often, final steps take place in clean rooms, which are expensive to maintain. As the focus of this study was the chemical synthesis, only the production of 1 kg of API was assessed.
5 Conclusions
The LCIA results presented in Table 1 showcase the
environmental life cycle burdens of the production of a pharmaceutical active ingredient (API). The environmental life cycle impacts found are in line with the considerable efforts required for the complex synthesis and the com-plexity of pharmaceutical production, as compared to basic chemical production. A difference of up to and sometimes over two orders of magnitude between basic chemical and pharmaceutical production impacts should be expected based on the results of this study. The difference can be explained by the greater complexity of API molecules, the higher demands of the complex synthesis processes, and the shorter development times of APIs, allowing less time for optimization of the processes. Comparing impact categories
is subjective, but for most methods applied here the largest contributors to environmental burdens were the resource impacts and the emissions of greenhouse gases. For most of the methods used and categories analyzed, a majority (and sometimes up to 85%) of the impacts were directly or indirectly caused by energy use. Process emissions from chemical plants and transport were only minor contributors to the overall impacts. This leads to the conclusion that modern emission controls in developed countries are largely effective, at least barring major accidents. The environmental profiles of the two API systems analyzed were in general comparable, given the differences in complexity of the two materials and synthesis and the inherent uncertainty of the LCA estimations. Furthermore, the analysis suggests that optimizations in material and energy efficiency are the most effective ways of increasing the sustainability of modern fine chemical production.
The low required production volumes of pharmaceut-icals and their obvious benefits to society justify these environmental impacts, but nevertheless this study has led us to suggest to an increased optimization of materials and energy use in production. The results can assist environ-mentally beneficial process optimizations.
6 Recommendations and perspectives
Our analysis showed that pharmaceutical production is significantly more complex than basic chemical production. Even the two substances in this study showed large differ-ences in their absolute impacts, to a degree that using the data of one to approximate the other would lead to errors. This variation is explained by the significant differences in complexity of the molecule and the synthetic process and uncertainties in the LCA models. Additional LCA studies and publicly available LCI data are needed to improve LCA results of processes and products requiring fine chemicals.
While fine chemicals are often produced and used in lower quantities, their lower contribution in mass to consumer and industrial products should not lead LCA practitioners to neglect their importance. The data in this study may serve as a proxy to carry out a sensitivity analysis of environmental life cycle impacts of fine chemicals in other LCA studies to assess the relative importance of their impacts and to determine whether additional data have to be gathered.
In addition, although some cradle-to-gate assessments of API production systems have been completed to date, further research is needed both to specifically address the open questions on fine chemical production and for the eventual full cradle-to-grave LCA studies of pharmaceutical products, for which production data are vital. Additional production studies would help put into perspective the true
environ-mental life cycle of medicine production. Until this date, it is uncertain how much of the life cycle environmental impacts of medicine production can be attributed to the API and how much is contributed by downstream impacts.
Acknowledgments The authors would like to thank the Swiss Federal Office for the Environment (project no. 810.3189.004) and the Swiss Federal Office for Energy (project no. 101711) for their support on this project.
References
ACS (2008) American Chemical Society Green Chemistry Institute pharmaceutical roundtable. http://portal.acs.org/portal/acs/corg/ content?_nfpb=true&_pageLabel=PP_TRANSITIONMAIN& node_id=1422&use_sec=false&sec_url_var=region1&__uuid= 6e4e42c8-3b8f-47df-b03f-247e369debf7
Bare J, Norris G, Pennington D, McKone T (2003) TRACI—the tool for the reduction and assessment of chemical and other environmental impacts. J Ind Ecol 6:49–78
Bare J, Gloria T, Norris G (2006) Development of the method and U.S. normalization database for life cycle impact assessment and sustainability metrics. Environ Sci Technol 40:5108–5115 Buser HR, Poiger T, Muller MD (1999) Occurrence and environmental
behaviour of the chiral pharmaceutical drug ibuprofen in surface waters and in wastewater. Environ Sci Technol 33:2529–2535 Capello C, Hellweg S, Badertscher B, Betschart H, Hungerbuhler K
(2007a) Environmental assessment of waste-solvent treatment options. Part 1: the ecosolvent tool. J Ind Ecol 11:26–38 Capello C, Hellweg S, Hungerbühler K (2007b) The ecosolvent Tool.
http://www.sust-chem.ethz.ch/tools/ecosolvent
Capello C, Hellweg S, Hungerbuhler K (2008) Environmental assess-ment of waste-solvent treatassess-ment options—Part II: general rules of thumb and specific recommendations. J Ind Ecol 12:111–127 Curzons AD, Jiménez-Gonzalez C, Duncan AL, Constable DJC, CV
L (2007) Fast Life Cycle Assessment of Synthetic Chemistry (FLASC) tool. Int J LCA 12:272–280
DeWulf J, Bosch ME, De Meester B, Van der Vorst G, Van Langenhove H, Hellweg S, Huijbregts MAJ (2007) Cumulative exergy extraction from the natural environment (CEENE) a comprehensive life cycle impact assessment method for resource accounting. Environ Sci Technol 41:8477–8483
Frischknecht R, Steiner R, Braunschweig A, Egli N, Hildesheimer G (2006) Swiss ecological scarcity method: The New Version 2006 Goedkoop M, Spriensma R (2000) The eco-indicator 99: a damage orientated method for life-cycle impact assessment. Methodology report 2000a, Pre Consultants
Goedkoop M, Heijungs R, Huijbregts MAJ, De Shruyver A, Struijs J, Van Zelm R (2009) ReCiPe 2008—A life cycle impact assessment method which comprises harmonised category indicators at the midpoint and the endpoint level,http://www.lcia-recipe.net/
Heberer T (2002) Occurrence, fate, and removal of pharmaceutical residues in the aquatic environment: a review of recent research data. Toxicol Lett 131:5–17
Hischier R, Hellweg S, Capello C, Primas A (2004) Establishing life cycle inventories of chemicals based on differing data availabil-ity. Int J LCA 10:59–67
Huijbregts MAJ, Rombouts LJA, Hellweg S, Frischknecht R, Hendriks J, Van de Meent D, Ragas AMJ, Reijnders L, Struijs J (2006) Is cumulative fossil energy demand a useful indicator for the environmental performance of products? Environ Sci Technol 40:641–648
Huijbregts MAJ, Hellweg S, Frischknecht R, Hungerbuhler K, Hendriks AJ (2008) Ecological footprint accounting in the life cycle assessment of products. Ecol Econ 64:798–807
Jiménez-Gonzalez C (2000) Life cycle assessment in pharmaceutical applications. PhD thesis, North Carolina State University, Raleigh, NC
Jiménez-Gonzalez C, Curzons AD, Constable DJC, VL C (2004) Cradle-to-gate life cycle inventory and assessment of pharma-ceutical compounds. Int J LCA 9:114–121
Jodicke G, Fischer U, Hungerbuhler K (2001) Wastewater reuse: a new approach to screen for designs with minimal total costs. Comput Chem Eng 25:203–215
Jolliet O, Margni M, Charles R, Humbert S, Payet J, Rebitzer G, Rosenbaum R (2003) IMPACT 2002+: a new life cycle impact assessment methodology. Int J LCA 8:324–330
Köhler A, Hellweg S, Recan E, Hungerbühler K (2007) Input-dependent life-cycle inventory model of industrial wastewater-treatment processes in the chemical sector. Environ Sci Technol 41:5515–5522
Kummerer K (2008) Pharmaceuticals in the Environment. Springer, Berlin Loffler D, Rombke J, Meller M, Ternes TA (2005) Environmental fate of pharmaceuticals in water/sediment systems. Environ Sci Technol 39:5209–5218
Mutel C, Kestenholz M (2008) The Brightway LCA model.http:// brightwaylca.org
Rosenbaum RK, Bachmann TM, Gold LS, Huijbregts MAJ, Jolliet O, Juraske R, Koehler A, Larsen HF, MacLeod M, Margni M, McKone TE, Payet J, Schuhmacher M, van de Meent D, Hauschild MZ (2008) USEtox—the UNEP–SETAC toxicity
model: recommended characterisation factors for human toxicity and freshwater ecotoxicity in life cycle impact assessment. Int J LCA 13:532–546
Sheldon RA (1994) Consider the environmental quotient. Chemtech 24:38–47
Szijjarto A, Papadokonstadakis S, Fischer U, Hungerbühler K (2008) Bottom-up modelling of the steam consumption in multipurpose chemical batch plants focusing on identification of the optimiza-tion potential. Ind Eng Chem Res 47:7323–7334
The ecoinvent centre (2008a) Ecoinvent 2.01 database. http://www. ecoinvent.ch
The ecoinvent centre (2008b) Ecoinvent 2.01 Reports, Chapter 1: Overview and Methodology
The Intergovernmental Panel on Climate Change (2007) Fourth Report. Climate Change 2007.http://www.ipcc.ch/ipccreports/ar4-wg1.htm
Thieme Chemistry (2009) Römpp Online.http://www.roempp.com
Ullmann's Encyclopedia of Industrial Chemistry 2006: 7th Electronic Edition. http://www.mrw.interscience.wiley.com/ueic/. Wiley, Weinheim
Verein Deutscher Ingenieure (1997) VDI-richtlinie 4600: cumulative energy demand, terms, definitions, methods of calculation. Verein Deutscher Ingenieure, Düsseldorf
Wernet G, Hellweg S, Fischer U, Papadokonstantakis S, Hungerbuhler K (2008) Molecular-structure-based models of chemical inven-tories using neural networks. Environ Sci Technol 42:6717–6722 Wernet G, Papadokonstantakis S, Hellweg S, Hungerbuhler K (2009) Bridging data gaps in environmental assessments: modelling impacts of fine and basic chemical production. Green Chem 11:1826–1831