Impact of Swiss technology policy on firm
innovation performance: an evaluation based
on a matching approach
Spyros Arvanitis, Laurent Donzé and Nora Sydow
This paper investigates the impact of the promotional activities of the Swiss Commission of Technology and Innovation (CTI) on the innovation performance of the supported firms based on a matched-pairs analysis of 199 firms supported by the CTI in the period 2000–2002. CTI’s promotional activities significantly improved the innovation performance of the firms that they supported with respect to six different measures of innovation performance. This could be shown by four different matching methods. A further finding was that the magnitude of the impact correlated positively with the relative size of the financial support, as measured by the quotient of the volume of financial support to the volume of a supported firm’s own research and development expenditures.
HE IMPACT OF THE INNOVATION pro-motion policy of the ‘Commission of Tech-nology and Innovation’ (CTI), which is the most important government agency for the promo-tion of innovapromo-tion in Switzerland, was investigated in this study. The CTI mainly supports research and development (R&D) co-operation projects from all scientific fields by funding the public partner (a uni-versity or a public research institution) in such a co-operation, the private partner being an enterprise that agrees to contribute to this project at its own ex-pense by at least the amount of funds offered by the CTI (private contribution of at least 50%; the ‘bot-tom-up’ principle of support). The projects to be subsidized are selected by committees of experts that evaluate the applications by some criteria of
excellence. There have also been some recent pro-grammes for the promotion of specific technologies (e.g. MedTech, TopNano21), but this type of spe-cific support has always been of minor importance. The principle of indirect R&D support of good pro-jects, which are jointly proposed by a private and a public partner, is fundamental to the Swiss technol-ogy policy and, as a main promotional policy, to our knowledge, is unique in Europe.
Our main hypothesis was that: on average enter-prises that were supported by the CTI would show a significantly higher innovation performance, meas-ured through six innovation measures (e.g. sales, share of innovative products), than ‘structurally similar’ firms without such activities. To show this, we used matched-pairs analysis for a set of firms supported by CTI and the corresponding control groups for the period 2002–2004.
Matchingmethodsbasedondirectcomparisonsof participating and non-participating agents, which werefirstusedinlabourmarketevaluations,havealso beenappliedtoevaluatethetechnologyprogrammes of European countries (see Almus and Czarnitzki, 2003; Czarnitzki and Fier, 2002 (for Germany); PointnerandRammer,2005(forAustria);Görgand Strobl,2007(forIreland)).1Amajoradvantageofthe matchingmethodsratherthantheregressionapproach is that the matching is non-parametric. As such, it
T
Spyros Arvanitis is at KOF Swiss Economic Institute, ETH Zurich, 8092 Zurich, Switzerland; Email: arvanitis@kof.ethz.ch; Tel: +41 44 632 51 68; Fax: +41 44 632 13 52. Laurent Donzé is at the Faculty of Economics and Social Sciences, University of Fribourg, 1700 Friboug, Switzerland; Email: laurent.donze@ unifr.ch; Tel: +41 26 300 82 75; Fax: +41 26 300 97 81. Nora Sydow is at the Economic Research Department, Credit Suisse, 8070 Zurich, Switzerland; Email: nora.sydow@credit-suisse.com; Tel: +41 44 333 45 10; Fax: +41 44 333 56 79.
This study was supported financially by the Swiss Federal Office for Professional Education and Technology.
avoids the functional form restrictions implicit in runningaregressionofsometype.
Abriefdescriptionoftheapproachpursuedinthis paperisasfollows:weidentifiedthesubsidizedfirms intheperiod2000–2002fromtheCTIdatabase.We collectedinnovationdataforthepromotedfirms simi-lartothosealreadyexistingforasampleofinnovating firmsoftheSwissInnovationSurvey2002(Arvanitis
et al.,2004).Weestimatedthepropensityscoreswith respecttothelikelihoodofreceivinga CTIsubsidy. Wethen appliedfourdifferent matchingmethodsin ordertofindthestructurallysimilar‘twin’ firmsfor every subsidized firm. We tested the statistical sig-nificanceofthedifferenceofthemeansofsix differ-ent innovationmeasures ofthesubsidizedfirmsand the non-subsidized firms of the matched control group.Weconstructedasubsidyquotient:theamount ofR&DpromotiondividedbytheR&Dbudgetofthe firminthesameperiod.Wewereabletodistinguish between firmswith a high (higherthan the median) anda lowsubsidy quotient(lowerthan themedian), and carry out a statistical test on the difference of the differences of the means of the innovation variables of the subsidized firms and the matched non-subsidized firms.
Fortheperiod2002–2004wefoundthat(withone exception),forallsixinnovationmeasuresandforall four matching methods applied, the innovation per-formance of CTI-subsidized firms was on average significantly higher than that of the non-subsidized firms in the matched control group. Further, it was shownthatthepromotioneffectwas(withone excep-tion)dependentonthemagnitudeofthepromotion ra-tio(asmeasuredbytheratioofR&DsubsidiesbyCTI to a firm’s own R&D expenditure).
The new elements in our analysis were:
• the use of innovation data for the subsidized firms, collected by means of a survey;
• the use of four different matching methods that al-lowed us to test the robustness of our results; and • the investigation of the effect of promotion ratio
as measured by the ratio of R&D subsidies by CTI to a firm’s own R&D expenditure.
The paper is structured as follows: first, we present the conceptual framework of the study; secondly, we give an overview of similar studies. Thirdly, we deal with the data sources; fourthly, we present some in-formation on the patterns of CTI promotion in the reference period. Fifthly, we provide a detailed dis-cussion of our methodology for estimating the im-pact of CTI subsidies on the innovation performance of firms. We then discuss the results and provide a summary and some implications for technology policy.
Conceptual framework
Technology policy: public fiscal policies to support innovation
Most OECD countries use large amounts of public funds to support activities that are intended to en-hance innovation in the business sector. These funds are often used to provide direct support for private sector research and innovation. A further way of supporting private investment in innovation is through tax incentives for R&D expenditures (see Jaumotte and Pain, 2005 for a survey of the main fiscal policies to support innovation). The under-lying justification for public policies to support in-novation is provided by the economic argument that otherwise the private sector would invest less in in-novative activities than is socially desirable. The reasons for such ‘market failure’ that leads to under-investment in innovative activities could be: infor-mational imperfections, inforinfor-mational externalities due to knowledge spillovers, financial market fail-ures or shortages of highly qualified personnel (Nel-son, 1959; Arrow, 1962). Thus, public fiscal policies to support innovation are designed to alleviate par-ticular forms of market failure that would lead to under-investment. For example, programmes offer-ing financial support for small or young firms are in-tended to stimulate additional R&D and innovation in firms that would otherwise have difficulty funding themselves in the capital market. In practice, identi-fying the firm or project categories that should be subsidized requires difficult judgements to be made.
Swiss technology policy
There is a long tradition in Switzerland of refraining from directly funding business firms for innovation activities. In a comparison of industrialized countries only Japan and Luxembourg show a comparably low percentage of government financing for R&D (OECD, 2007). This tradition is based on a wide
Spyros Arvanitis is a senior researcher at the KOF Swiss Economic Institute and a lecturer in economics at the ETH Zurich. He is head of the research section on innovation economics at the KOF. Dr Arvanitis holds a doctorate in economics from the University of Zurich and a doctorate in chemistry from the ETH Zurich. He has published exten-sively on the economics of innovation, technology diffusion, determinants of the performance of firms, and market dynamics.
Luarent Donzé has been an associate professor at the Uni-versity of Fribourg, Switzerland since 2002. Before this ap-pointment he was a senior researcher at the KOF Swiss Economic Institute at the ETH Zurich. He teaches and re-searches on statistics and econometrics, especially on measures of economic inequality, the construction and maintenance of panels of firms, and matching methods. Nora Sydow has been at the Economic Research Depart-ment of Credit Suisse since 2008. Before this appointDepart-ment she was a researcher at the KOF Swiss Economic Institute at the ETH Zurich and responsible for the KOF Enterprise Panel. She holds a master’s degree from the University of St Gallen, Switzerland.
consensus not only among political actors but also among organizations representing business interests. According to the results of the Swiss Economic Sur-vey (Arvanitis et al., 2007), less than 10% of Swiss firms perceive a lack of public R&D promotion to be a strong, or very strong, obstacle to their innovation activities; this percentage has remained practically constant since 1990. As a consequence, only a few fiscal initiatives to support research and innovation at firm level have been launched in recent years. CTI is the government agency through which public funds are poured into the business sector. Besides the promotion of entrepreneurship through CTI’s start-up funding programme plus a mobilization ini-tiative called Venturelab, most of CTI funds are di-rected to financing ‘bottom-up’-initiated R&D projects from all scientific fields, CTI supporting the academic partner of the project. There have also been programmes for the promotion of specific technologies (e.g. MedTech, TopNano21) but this kind of specific support has always been of minor importance. The principle of indirect R&D support of good projects, which are jointly proposed by a private and a public partner, is fundamental to Swiss technology policy. To the best of our knowledge, it is unique in Europe as a main promotional policy.2
Methods of evaluation of measures of technology policy
Evaluating the outcomes of subsidized projects is difficult, both because of the difficulties in estimat-ing the wider social benefits that they generate and because of the difficulties in assessing what the ‘counter-factual’ would have been in the absence of public support. Typically, evaluations of outcomes, i.e. estimations of the impact of policy, proceed by means of an ex post assessment of the activities of the firms that have received subsidies. Such evalua-tions can be subject to selection-bias problems be-cause subsidized firms are not a random group. They are mostly selected because of the high quality of the proposed projects, that is, those projects that are the best candidates for funding are also the projects that would have the largest expected output in the ab-sence of funding.
There are several empirical strategies for mitigat-ing selection bias in the ex post evaluations, e.g. re-gression with controls for unobserved effects; regression with fixed effects or ‘difference in differ-ences’; selection models and matching methods based on direct comparisons of the participating and non-participating agents, i.e. on matched samples of treated and untreated entities (Klette et al., 2000; Jaffe, 2002; Arvanitis and Keilbach, 2002).
In this study we apply matching methods to evaluate the impact of R&D subsidies on the innova-tion performance of subsidized firms. A major ad-vantage of the matching methods over the regression approach is that the matching is non-parametric. As such, it avoids the functional form restrictions im-plicit in running a regression of some kind. Of course, this method also has shortcomings. First, a close similarity with respect to all observable char-acteristics that are believed to be correlated with the likelihood that a firm or a project would be selected for subsidies may fail to control fully for any selec-tion bias, given that in most cases only a restricted dataset of firm characteristics is available. Secondly, due to a lack of information, potential knowledge spillovers are not taken into consideration (this also happens when regressions are run). Theoretically, the only set-up for a support measure in order to avoid ex ante selection bias would be to undertake an evaluation by awarding grants (subsidies) ran-domly within a pool of actors who are judged suit-able for funding (Jaffe, 2002). But such a random mechanism for distributing subsidies also raises the issue of whether or not the social welfare would be lower if some projects with a high potential go with-out funding.
Empirical evidence on the effectiveness of technology policy
Recentoverviewsofthe empirical literaturesuggest thattheempiricalevidenceastotheeffectivenessof subsidies is not homogeneous (David et al., 2000; Hall and Van Reenen, 2000; Klette et al., 2000;
JaumotteandPain,2005),afindingalsoconfirmedby the meta-analysis by Garcia-Quevado (2004) which wasbasedontheresultsof39studiesofthe effective-nessofpublicsubsidies.Alloverviewsemphasizethe importance of the control variablesincluded in any empiricalassessment andthelevelofaggregationat whichastudyisconducted.Differenceswithrespect tothesetwofactorsseemtoexplainalargepartofthe differences found between empirical studies. Thus, for the assessment of a study, it is necessary to take these two factors into consideration.
Summary of similar studies
In this section of the paper, we review studies at firm level that aim to measure the impact of public fiscal support on some performance measure and apply
The principle of indirect R&D support
of good projects, which are jointly
proposed by a private and a public
partner, is fundamental to Swiss
technology policy. To the best of our
knowledge, it is unique in Europe as a
main promotional policy
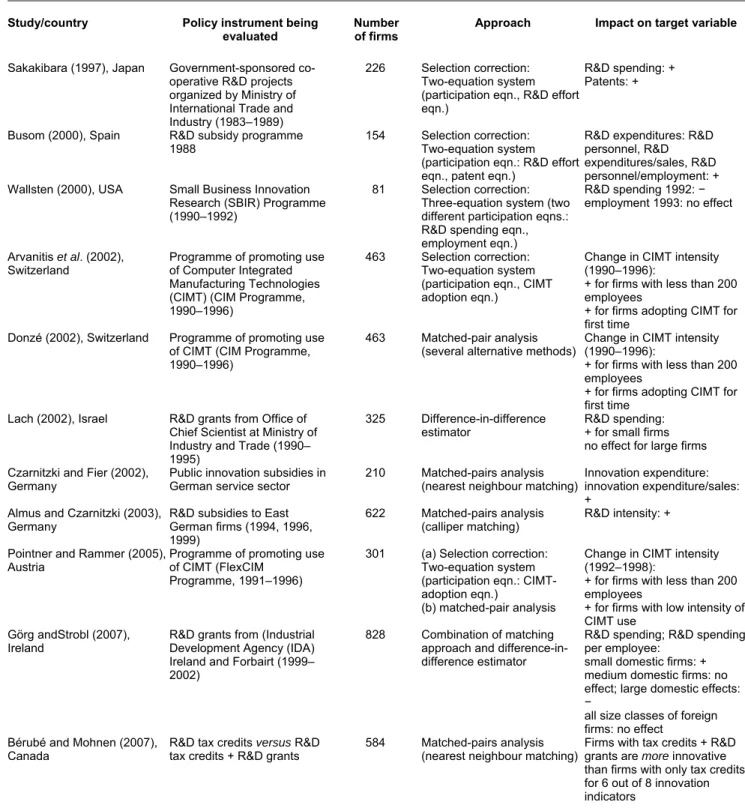
either matching approaches (as in this paper) or se-lection correction approaches. Most studies use con-temporaneous data on the states of subsidized and non-subsidized firms (as in this paper). Table 1 psents a summary of such studies. Seven of them re-fer to European countries (Austria, Germany, Ireland, Spain and Switzerland), six of them apply matching approaches and one of them only uses a selection correction approach. Moreover, the study for Ireland combines selection correction approach and matching method, that for Austria uses both ap-proaches. Finally, three of the non-European studies
(USA, Japan and Israel) use versions of the selection correction method, while the Canadian study is based on a matching approach and is the only study that compares the impact of two different policy in-struments. Six out of ten studies use R&D intensity, R&D expenditure or R&D personnel as the target variables of the promotional measures. For one study the target variable is innovation expenditure. The Canadian study uses eight different output-oriented innovation measures as target variables. Fi-nally, in three studies some technology diffusion measure is chosen as the goal variable. Most studies
Table 1. Summary of selected empirical studies
Study/country Policy instrument being evaluated
Number of firms
Approach Impact on target variable
Sakakibara (1997), Japan Government-sponsored co-operative R&D projects organized by Ministry of International Trade and Industry (1983–1989)
226 Selection correction: Two-equation system (participation eqn., R&D effort eqn.)
R&D spending: + Patents: +
Busom (2000), Spain R&D subsidy programme 1988
154 Selection correction: Two-equation system (participation eqn.: R&D effort eqn., patent eqn.)
R&D expenditures: R&D personnel, R&D expenditures/sales, R&D personnel/employment: + Wallsten (2000), USA Small Business Innovation
Research (SBIR) Programme (1990–1992)
81 Selection correction: Three-equation system (two different participation eqns.: R&D spending eqn., employment eqn.)
R&D spending 1992: − employment 1993: no effect
Arvanitis et al. (2002),
Switzerland Programme of promoting use of Computer Integrated Manufacturing Technologies (CIMT) (CIM Programme, 1990–1996)
463 Selection correction: Two-equation system (participation eqn., CIMT adoption eqn.)
Change in CIMT intensity (1990–1996):
+ for firms with less than 200 employees
+ for firms adopting CIMT for first time
Donzé (2002), Switzerland Programme of promoting use of CIMT (CIM Programme, 1990–1996)
463 Matched-pair analysis
(several alternative methods) Change in CIMT intensity (1990–1996): + for firms with less than 200 employees
+ for firms adopting CIMT for first time
Lach (2002), Israel R&D grants from Office of Chief Scientist at Ministry of Industry and Trade (1990– 1995)
325 Difference-in-difference
estimator R&D spending: + for small firms no effect for large firms Czarnitzki and Fier (2002),
Germany Public innovation subsidies in German service sector 210 Matched-pairs (nearest neighbour matching) analysis Innovation expenditure: innovation expenditure/sales: +
Almus and Czarnitzki (2003), Germany
R&D subsidies to East German firms (1994, 1996, 1999)
622 Matched-pairs analysis (calliper matching)
R&D intensity: +
Pointner and Rammer (2005),
Austria Programme of promoting use of CIMT (FlexCIM Programme, 1991–1996)
301 (a) Selection correction: Two-equation system (participation eqn.: CIMT-adoption eqn.)
(b) matched-pair analysis
Change in CIMT intensity (1992–1998):
+ for firms with less than 200 employees
+ for firms with low intensity of CIMT use
Görg andStrobl (2007),
Ireland R&D grants from (Industrial Development Agency (IDA) Ireland and Forbairt (1999– 2002)
828 Combination of matching approach and difference-in-difference estimator
R&D spending; R&D spending per employee:
small domestic firms: + medium domestic firms: no effect; large domestic effects: −
all size classes of foreign firms: no effect
Bérubé and Mohnen (2007),
Canada R&D tax credits versus R&D tax credits + R&D grants 584 Matched-pairs (nearest neighbour matching) analysis Firms with tax credits + R&D grants are more innovative than firms with only tax credits for 6 out of 8 innovation indicators
find a positive policy effect but in some cases only for small firms. The USA study is the only one, which finds a negative effect for R&D spending, meaning that subsidies were crowding out private R&D spending. Although all the studies in Table 1 refer to the firm as the analytical entity, a closer comparison of the results of these studies is not pos-sible due to large differences with respect to the variables taken into consideration in order to control for selection bias.
Database
Our information sources were:
• a list of the firm projects that were subsidized by the CTI in the period 2000–2002;
• additional information on the firms whose pro-jects were subsidized that was collected through a survey of the subsidized firms based on a short-ened version of the questionnaire used in the Swiss Innovation Survey 2002; and
• the data for firms that reported the introduction of innovations in the period 2000–2002 in the Swiss Innovation Survey 2002.
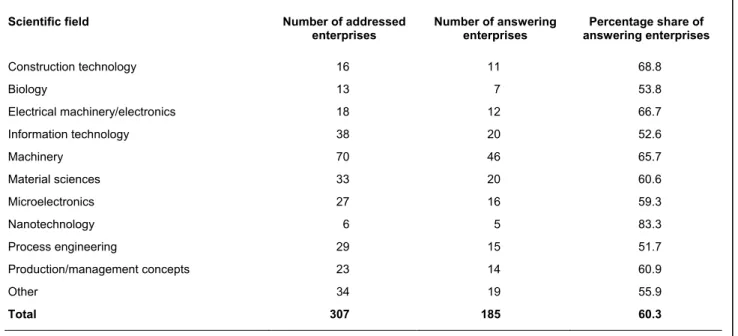
The CTI database contained information on 634 sub-sidized R&D projects that were finished between 1 January 2000 and 31 December 2002. There was in-formation on the scientific field of the project, the amount of the subsidy granted, and the name and address of the enterprises that conducted the subsi-dized projects. These firms made up our sample of subsidized firms. Start-ups, non-profit organizations and mergers were excluded from this sample be-cause their specific characteristics could be not iden-tified in our pool of control firms. Further, firms that had ceased to exist by December 2003 were also re-moved from the sample. The final sample contained 307 subsidized firms. These firms received a short-ened version of the questionnaire of the Swiss Inno-vation Survey 2002.3 185 firms completed the
questionnaire (see Table A1 in the Appendix to this paper for information on the response rates by scien-tific field). A further 14 subsidized firms were iden-tified among the participants of the Swiss Innovation Survey 2002. Hence, the sample we used for the study contained data on 199 firms (64.8% of the subsidized firms). Additional information on the de-terminants of the propensity scores (see section on Method) was collected through a telephone survey of the 122 subsidized firms that did not complete the postal survey. This additional information allowed us to estimate the propensity scores based on data for all 307 subsidized firms.
The 996 firms that participated in the Swiss Inno-vation Survey 2002 and reported the introduction of innovations in the period 2000–2002 built the pool of non-subsidized firms from which a control group was constructed (KOF panel database).
For the firms that finished their projects subsi-dized by the CTI during the first half of the period 2000–2002, i.e. until the middle of 2001, we reckon that they would still have had one-and-a-half years until the end of the reference period to realize some impact of these projects on their innovation per-formance (e.g. introduce new products); one-and-a-half years is an adequate time lag between R&D and realization of R&D outcomes for most industries and for incremental innovations. For the firms that com-pleted their subsidized R&D during the second half of the reference period, particularly in the year 2002, it is questionable, whether or not they would have had enough time until the end of 2002 to realize any additional innovation gains. 53% of projects were finished by the middle of 2001, 78% by the end of 2001. Hence, for the large majority of the projects there was enough time to have a measurable impact of R&D on their innovation performance. For the remaining 28% of the firms, it is possible that only part of the impact could be realized before the end of 2002. In this sense our estimations of the impact of CTI promotion would thus represent a lower bound on the possible effects.
Patterns of CTI promotion in period 2000–2002
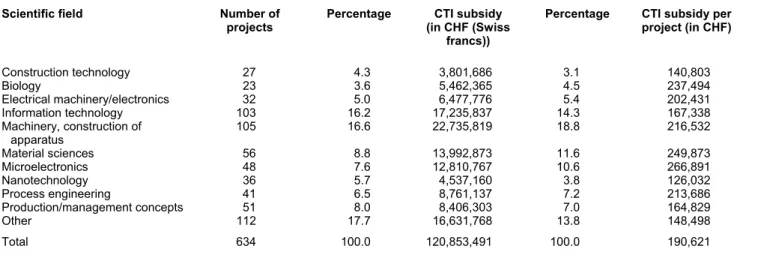
As already mentioned, in the period 2000–2002 634 R&D projects were supported by the CTI. Table 2 shows the scientific fields in which these projects were located and the amount of the subsidies granted by scientific field. The projects in the fields of ma-chinery and apparatus construction as well as infor-mation technology (software) amounted to about 33% of all projects and also received about 33% of the total subsidies. In general, the subsidies were rather broadly distributed among several scientific fields, which was in accordance with the general promotion policy of the CTI, based mainly on the ‘bottom-up’ principle of support. So-called future-oriented technologies such as biotechnology (3.6% of projects, 4.5% of subsidies) and nanotechnology (5.7% of projects, 3.8% of subsidies) do not seem to have been particularly promoted. In total, about 120 million Swiss francs (CHF) were invested in projects promoted by the CTI, i.e. CHF60 million per annum. The mean subsidy per project was CHF190,000. The mean amounts among scientific fields varied be-tween CHF167,000 for information technology and CHF267,000 for microelectronics. This means that including the firms’ contribution of at least the same amount as the CTI subsidy, about CHF400,000 was invested per project.
Table 3 shows the distribution of subsidies among firms by scientific field. Enterprises with more than one project were classified by the scientific field of the project with the highest subsidy. The share of firms with projects in machinery, apparatus con-struction and information technology is about 22%,
significantly lower than the respective share of pro-jects of these scientific fields. In contrast, material sciences are better represented among firms (about 24%) than among projects (about 12%).
The subsidized firms are further characterized by the industry affiliation and the number of employees in full-time equivalents (firm size). 52% of pro-moted firms belonged to mechanical and electrical machinery, electronics and instruments. This was the dominant group among subsidized firms in accor-dance with the importance of these capital goods in-dustries for Swiss manufacturing with respect to generated value added, employment and innovative-ness, even if it is rather over-represented. Chemical and pharmaceutical firms, which are on average the most innovative Swiss firms, are quite under-represented among the subsidized firms (4%), re-flecting the strong tendency of this branch of above-average investment in R&D. With the exception of wholesale trade the service sector is represented in the sample of the subsidized firms only by business services (computer services, engineering, business
consulting, etc., about 21%). Small firms with up to 50 employees have a share of about 55%, firms with more than 200 employees a share of only about 25%, firms with more than 500 employees a share of about 10%.
Both the distribution among industries and among firm size classes seem to be in accordance with the policy pursued by the CTI of promoting mainly small- and medium-sized enterprises in all sections of the economy; there is even a tendency to promote small- rather than medium-sized firms.
Method
Our main hypothesis is that the CTI support, particu-larly through financed research projects in co-operation with universities, would show on average a significantly higher innovation performance, as measured by output innovation measures (e.g. sales share of innovative products), than ‘structural simi-lar’ firms without such activities. We used several matching methods to demonstrate this.
In order to measure appropriately the influence of CTI subsidies on a firm’s innovation perform-ance (‘treatment effect’)4 we should be able to
measure the performance difference of the two ‘states’of afirm(subsidized by the CTI(‘treated’)/ non-subsidized by the CTI(‘non-treated’)), keeping all other things equal. In a cross-sectional frame-work, usually only one ofthese two possible states is observable:eithera firmis subsidizedorit isnot subsidized. Thus, in most cases it is not possible
to make a proper comparison of these states. Heckman et al.(1998) developed a methodologyto approximate this non-observable (‘counterfactual’) state of a certain firm with the observable same state of another firm which is ‘structurally similar’ tothe firstoneaccording toa seriesoffirm charac-teristics formally defined by a vector X. Thus, be-sides the group of firms, which are subsidized by CTI in a certain time period, we need a pool of
Table 2. Subsidized projects and volume of subsidy by scientific field 2000–2002
Scientific field Number of
projects Percentage CTI (in CHF (Swiss subsidy francs))
Percentage CTI subsidy per project (in CHF) Construction technology 27 4.3 3,801,686 3.1 140,803 Biology 23 3.6 5,462,365 4.5 237,494 Electrical machinery/electronics 32 5.0 6,477,776 5.4 202,431 Information technology 103 16.2 17,235,837 14.3 167,338 Machinery, construction of apparatus 105 16.6 22,735,819 18.8 216,532 Material sciences 56 8.8 13,992,873 11.6 249,873 Microelectronics 48 7.6 12,810,767 10.6 266,891 Nanotechnology 36 5.7 4,537,160 3.8 126,032 Process engineering 41 6.5 8,761,137 7.2 213,686 Production/management concepts 51 8.0 8,406,303 7.0 164,829 Other 112 17.7 16,631,768 13.8 148,498 Total 634 100.0 120,853,491 100.0 190,621
Source: CTI database, authors’ calculations
Table 3. Subsidized enterprises by scientific field 2000–2002
Scientific field Number of firms Percentage
Construction technology 11 5.5 Biology 7 3.5 Electrical machinery/electronics 12 6.0 Information technology 21 10.6 Machinery, construction of apparatus 23 11.6 Material sciences 48 24.1 Microelectronics 21 10.6 Nanotechnology 6 3.0 Process engineering 16 8.0 Production/management concepts 14 7.0 Other 20 10.1 Total 199 100.0
Notes: Enterprises with more than one project were classified by scientific field of project with highest subsidy
firms which are not subsidizedout of which ‘struc-turally similar’ firms are selected according to a ‘proximity’ criterion (control group). The compari-son of the two states for subsidized and non-subsidized firms is performed by comparing the means of the innovation performance variables for the ‘treated’ firms and the ‘twin’ ‘non-treated’ firms matched to the ‘treated’ ones according to a proximity criterion. The multi-dimensionality of
the matching problem (matching with respect to each singleelement ofa vector Xoffirm character-istics) can be reduced under certain conditions (Rosenbaum and Rubin, 1983) to a mono-dimensional (scalar) propensity score which com-prehends the entire information of all relevant characteristics.5
The state of a firm belonging to the group of the ‘treated’ firms is described by d = 1, the state of a ‘non-treated’ firm by d = 0. If Y1i is a vector of
inno-vation measures for the treated firm i [i∈(d = 1)] and
Y0i the corresponding vector for a firm j belonging to
the control group [j∈(d = 0)], which is the ‘twin’ firm to firm i, then the performance difference be-tween the two firms is defined as:
ΔY = Y1i − Y0i (1)
In a first step we estimated by a probit model the propensity scores P(X), i.e. we estimated the prob-ability of a firm having a research project subsidized by the CTI as a function of a vector X of firm char-acteristics As independent variables X we used: a variable characterizing a firm’s R&D activities (con-tinuous vs. occasional), the degree of exposure to in-ternational competition (export activities yes/no), age of firm (‘firm founded before 1996’), size of firm (dummy variables for six size classes), industry affiliation (dummy variables for three sub-sectors), geographical location (dummy variables for six geo-graphical regions) and language of the questionnaire (see Table A2 in the Appendix to this paper for the results of the probit estimates).
In a second step all firms were distributed to ad-justment cells according to the quintiles of the pro-pensity scores estimated by the equation in Table A2. The search for a ‘twin’ firm is then restricted only to the firms of the same adjustment cell, i.e. the quintile of propensity scores.
In a third step the ‘structurally similar’ firm inside an adjustment cell was identified for each treated firm. In order to test the robustness of our results, we used four different matching methods to identify the structurally similar firms out of the pool of the non-treated firms. According to the first method used in this study, nearest neighbour matching, the ‘twin’ firm j to firm i is one fulfilling the condition:
minij⎜Pi – Pj⎜ (2)
where Pi, and Pj are propensity scores for the firms i
and j, respectively. The treated firm can have a
higher or a lower propensity score than the non-treated one, therefore the absolute value of the dif-ference of the two propensity scores has to be considered.
The second method used in this study, calliper matching, is based on the same proximity measure as the nearest neighbour method which in this case is restricted up to a certain value ε (maximum admissi-ble difference of the propensity scores):
⎜Pi – Pj⎜ < ε(3)
Different adjustment cells can have different ε values. The ε values are dependent on the distribu-tion of the propensity scores inside an adjustment cell.
According to the third method, kernel matching, a weighted sum of all available control group firms inside an adjustment cell, not a single ‘twin’ firm as in the other two methods, is ascribed to every treated firm. The performance difference between the treated and the non-treated firms is now defined as:
(4)
where
ij
w
is the weighting factor(
∑
j d∈ ={ 0}wij =1;0≤wij ≤ ∀1, d)The weighting factor in equation (4) is defined as: (5) where
is the kernel6 at
the point
is the bandwidth of the kernel
The bandwidth was set specifically for every ad-justment cell. Also in this case the choice of the bandwidth was dependent on the distribution of the propensity scores in the adjustment cells.
The fourth and last method, the local linear
re-gression matching, is based on the same concept as
kernel matching. In this case all available observa-tions of the control group are also given a specific weight. This weight is high for small ‘distances’ be-tween a pair of firms, low for large ‘distances’ and also contains a linear term. The weighting factor is defined as follows: { } 1 0 0 i ij j j d
Y Y
w Y
∈ =Δ =
−
∑
{ 0} ij ij ik k d G w G ∈ = =∑
0 ( i k) N P P a ⎛ − ⎞ ⎜ ⎟ ⎜ ⎟ ⎝ ⎠ 0 ( i k) ik N P P G G a ⎛ − ⎞ = ⎜⎜ ⎟⎟ ⎝ ⎠ 0 Na
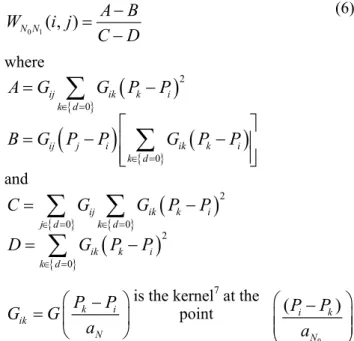
(6) where
and
is the kernel7 at the
point
In a fifth step, the means of the variables measuring innovation performance of the group of the treated firms and the group of the ‘twin’ non-treated firms were compared. We used six innovation vari-ables covering the output side of the innovation process:
• an ordinal measure of the technical importance of the introduced product and process innovations;8
• an ordinal measure of the economic importance of the introduced product and process innovations;9
• percentage reduction of average variable produc-tion costs due to process innovaproduc-tion;
• sales of new products new to the firm or to the market as a percentage of total sales;
• sales of significantly improved or modified (al-ready existing) products as a percentage of total sales; and
• sales of products new to the market worldwide. We use several innovation indicators in order to test the robustness of our results given that innovation is
a latent phenomenon and every single indicator measures only partly aspects of this complex phenomenon.
In a sixth and last step we calculated a subsidy
quotient for every subsidized firm by dividing the
amount of the granted subsidy by the total R&D ex-penditures in the period 2000–2002. This subsidy quotient measured the relative magnitude of the sub-sidy.10 We divided the subsidized firms into two
groups: one group with firms with a subsidy quotient higher than the median (‘high-subsidy’ firms) and a second one with firms with a subsidy quotient lower than the median (‘low-subsidy’ firms). Then, we cal-culated the difference of the means between subsi-dized and non-subsisubsi-dized firms separately for the ‘high-subsidy’ and the ‘low-subsidy’ firms. We tested if the difference in the former case was sig-nificantly larger than the difference in the latter case. If this was the case, we interpreted this result as em-pirical evidence that the impact of the CTI subsidies was positively correlated to the magnitude of the subsidy quotient. Hence, ‘high-subsidy’ firms would show a larger impact than the ‘low-subsidy’ ones.
Results of the matched-pairs analysis
Comparison of the innovation performance of subsidized firms depending on the subsidy quotient
Table 4 provides a qualitative summary of the re-sults of the comparison of the innovation perform-ance, as measured by six different indicators, of the subsidized and the non-subsidized firms for four different matching methods. We calculated the dif-ference of the means of the two categories of firms (subsidized, non-subsidized) for six innovation variables and four matching methods, i.e. for 24 dif-ferent cases. With one exception (‘importance of introduced innovations from an economic point of view’; ‘nearest neighbour’ method) we found that the subsidized firms showed a significantly higher
0 1( , ) N N A B W i j C D − = −
(
)
{ }(
)
(
)
{ } 2 0 0 ij ik k i k d ij j i ik k i k dA G
G P
P
B G P
P
G P
P
∈ = ∈ ==
−
⎡
⎤
=
−
⎢
−
⎥
⎢
⎥
⎣
⎦
∑
∑
(
)
{ } { }(
)
{ } 2 0 0 2 0 ij ik k i j d k d ik k i k d C G G P P D G P P ∈ = ∈ = ∈ = = − = −∑
∑
∑
k i ik N P P G G a ⎛ − ⎞ = ⎜ ⎟ ⎝ ⎠ 0 ( i k) N P P a ⎛ − ⎞ ⎜ ⎟ ⎜ ⎟ ⎝ ⎠Table 4. Summary of results with respect to receiving a subsidy for various matching methods
Variable Significantly higher means of subsidized than of non-subsidized firms (after matching)
Nearest
neighbour Calliper Kernel Local regression linear
Importance of introduced innovations from a technical point of view* Yes Yes Yes Yes Importance of introduced innovations from an economic point of view* No Yes Yes Yes Percentage reduction of average variable production costs due to process
innovation Yes Yes Yes Yes
Sales of significantly improved or modified (already existing) products as a percentage of total sales
Yes Yes Yes Yes
Sales of products new to firm or to market as a percentage of total sales Yes Yes Yes Yes Sales of products new to market worldwide as a percentage of total sales Yes Yes Yes Yes
Notes: *Originally ordinal variable measured separately for product and process innovations on a five-point Likert scale (1 = very small, 5 = very high). Mean values are used for product and process innovations. Statistical significance: 5% test level
innovation performance than non-subsidized firms (at the 5% test level). Hence, these results seem to be quite robust across various methods and innova-tion indicators. Having controlled for the size and age of the firms, sector affiliation, region, export propensity, and the existence of continuous R&D ac-tivities in the propensities equation, these perform-ance differences have to be traced with good reason to the main difference between the two groups of firms, namely having or not having received subsi-dies from the CTI in the reference period. For the ef-fectiveness of CTI promotion policy is the result for the six output-oriented innovation indicators of particular interest. Subsidized firms show a signifi-cantly higher innovation performance than structur-ally similar non-subsidized enterprises.
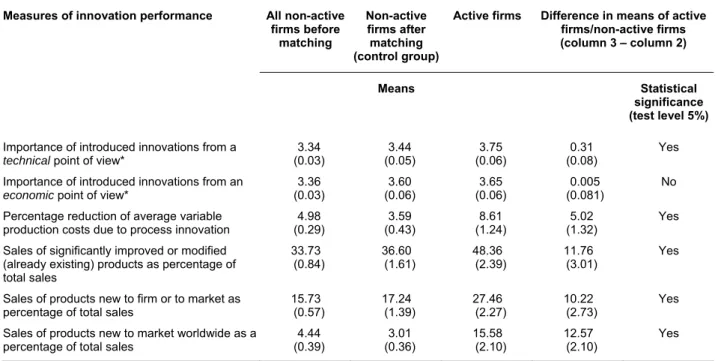
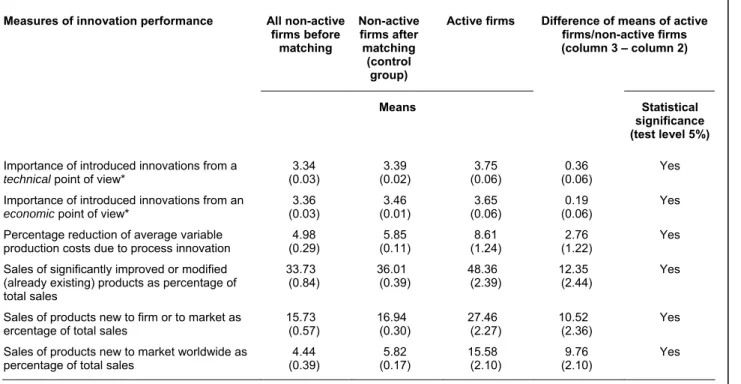
The detailed results in terms of figures for each innovation measure and each method are found in Tables A3–A6 in the Appendix. For example, col-umn 1 in Table A3 shows the mean value (score) for every innovation indicator for all available non-subsidized firms before matching. Column 2
presents the mean values for the matched non-subsidized firms, i.e. those firms that were se-lected (out of the pool of non-subsidized firms) by the matching method used (in this case: ‘nearest neighbour’ method) as ‘similar’ to the subsidized ones. The figures in the latter case are systematically larger than in the former case, reflecting the fact that firms with a high innovation performance are se-lected by the applied method to match subsidized firms that are expected to be highly innovative in or-der to obtain grants. Column 3 shows the corre-sponding figures for the subsidized firms. Column 4 shows the difference between the mean values for the subsidized firms (column 3) and the mean values of the matched non-subsidized firms (column 2). Finally, column 5 presents the results of tests of the statistical significance of the differences in column 4.
These results show that there are substantial dif-ferences in innovation performance. For the output-oriented indicators the differences vary significantly between only 9–11% for the qualitative self-assessment of the technical importance of the inno-vations introduced and a threefold to fivefold larger magnitude in the case of sales of products new to the market. A further interesting point, particularly for policy-makers, is that subsidized firms seem to be significantly more innovative especially in terms of new products than non-subsidized ones.
Comparison of the innovation performance of ‘high subsidy’ and ‘low subsidy’ firms
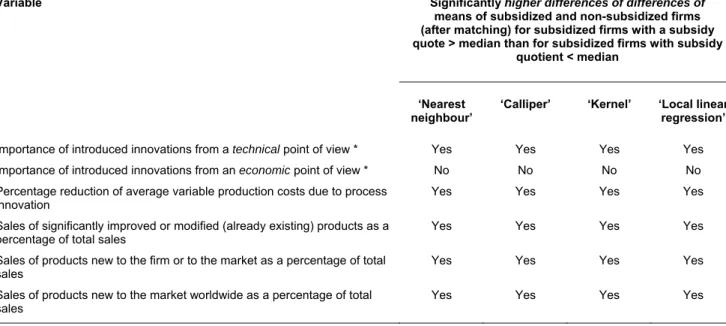
Table 5 contains a qualitative summary of the re-sults of the comparison of the differences of the innovation performance of ‘high-subsidy’ and
It is interesting to note, particularly
for policy-makers, that subsidized
firms seem to be significantly more
innovative, especially in terms of
new products, than non-subsidized
ones
Table 5. Summary of results with respect to the magnitude of the subsidy quotient for various matching methods
Variable Significantly higher differences of differences of means of subsidized and non-subsidized firms (after matching) for subsidized firms with a subsidy quote > median than for subsidized firms with subsidy
quotient < median
‘Nearest
neighbour’ ‘Calliper’ ‘Kernel’ ‘Local regression’ linear
Importance of introduced innovations from a technical point of view * Yes Yes Yes Yes Importance of introduced innovations from an economic point of view * No No No No Percentage reduction of average variable production costs due to process
innovation Yes Yes Yes Yes
Sales of significantly improved or modified (already existing) products as a percentage of total sales
Yes Yes Yes Yes
Sales of products new to the firm or to the market as a percentage of total
sales Yes Yes Yes Yes
Sales of products new to the market worldwide as a percentage of total sales
Yes Yes Yes Yes
Notes: *Originally ordinal variable measured separately for product and process innovations on a five-point Likert scale (1 = very small, 5 = very high). Mean values are used for product and process innovations. Statistical significance: 5% test level
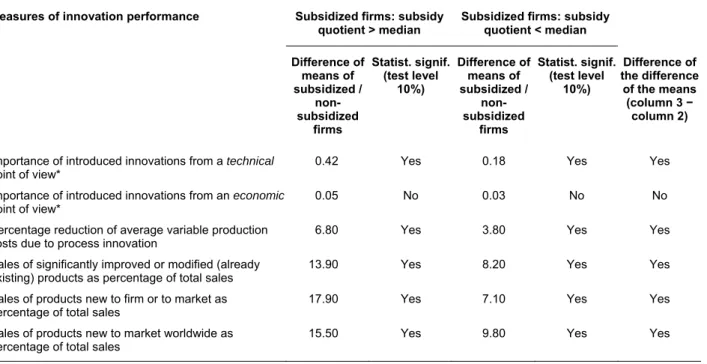
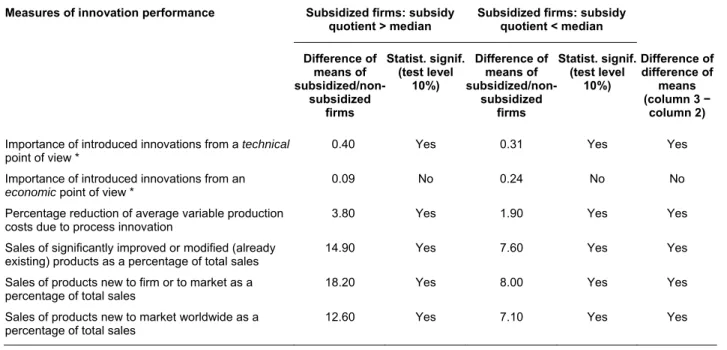
‘low-subsidy’ firms from that of the respective groups ofnon-subsidized firms.For fiveinnovation indicators we found that the difference of the means of the ‘high-subsidy’ andthe non-subsidized firms is significantly higher (at the 10% level) for all four matching methods than the respective dif-ferences for the ‘low-subsidy’ firms (i.e. signifi-cantly positive difference of the differences). Hence, for these cases we have some empirical evidencethatthe impactoninnovationperformance is dependent on the relative magnitude of the sub-sidy granted. The larger the amount of the subsidy relative to a firm’s own R&D investment, the stronger is the impulse for the innovation perform-ance of a firm. For one innovation variable (‘im-portance of introduced innovations from an
economic point of view’) we could not find any significant effect, meaning that relatively larger subsidiesdonotnecessarily resultina stronger ten-dency by subsidized ascompared tonon-subsidized firms to introduce innovations that are economi-cally important. It appears that larger subsidies re-sult in more technologically important innovations in subsidized firms than in non-subsidized firms. This isunderstandablegiventhat all subsidized col-laborations are between firms and universities that provide co-operating firms with knowledge that is primarily ofhigh technologicalvalue.This doesnot mean that higher subsidies cannot generate (addi-tional) economic success: according to our results the larger the subsidy (in relative terms), the larger the impact effect for a series of indicators that measure the economic success of innovation (sales shares of products with different grades of innova-tiveness, reductionincosts).
More detailed results in terms for figures for each innovation measure and each method can be found in Tables A7–A10 in the Appendix. For example, column 1 in Table A7 shows the differences be-tween subsidized firms with subsidy quotients
smaller than the median and the corresponding
matched non-subsidized firms. Column 2 presents the results with respect to the statistical significance of these differences. Columns 3 and 4 show the dif-ferences between subsidized firms with subsidy quo-tients larger than the median, column 4 refers to the statistical significance of these differences. Finally, column 5 reports on the results of tests of the statis-tical significance of the difference of the differences of the means. As we can see, the difference between subsidized and non-subsidized firms, for example, for the sales shares of products that are new world-wide for firms with small subsidy quotient increases from 7.10 percentage points to 12.60 percentage points for firms with large subsidy quotients. The re-spective increase for the sales shares of new prod-ucts (either new to the firm or new to the market) amounting to 18.20 − 8.00 = 10.20 percentage points as well as for significantly improved products (amounting to 14.90 − 7.60 = 7.30 percentage points) are even larger.
Conclusion
Based on a matched-pairs analysis of 199 firms sup-ported by the CTI in the period 2000–2002 and a control group of 996 firms that were not supported by the CTI, we found that the CTI promotion sig-nificantly improved the innovation performance of supported firms with respect to six different meas-ures of innovation performance. This could be shown by four different matching methods (with the exception of the nearest neighbour method for the indicator ‘importance of introduced innovations from an economic point of view’).
A further finding was that the magnitude of the impact correlated positively with the relative size of financial support as measured by the quotient of the volume of financial support to the volume of a sup-ported firm’s own R&D expenditures. The present analysis yields some information on three policy-related issues:
• the type of enterprises that received subsidies from the CTI;
• the effectiveness of CTI promotion policy; and • the relationship between subsidy quotient and
pol-icy effectiveness.
Theresultsofthestudyshowapositivepictureofthe CTI’spromotionpolicy.Subsidizedfirmsaremainly small- and medium-sized enterprises (perhaps too manymicro-firmsamongthem)whosepromotionis an explicit goal of CTI policy, the technological ori-entation of subsidized projects is quite broad, also covering currently fashionable fields such as bio-technology andnanotechnology. Further,subsidized firms represent a wide spectrum of manufacturing firms,theconcentrationonfirmsformachinery, elec-tronicsandinstrumentsreflectingthecurrentstructure of Swiss manufacturing. The ‘bottom-up’ principle appliedby the CTIfor allocatingfundsseems to be quiteeffective.Anadditionalpositiveelementisthat policyisnotjusteffectivebutitbecomesmore effec-tiveifthefinancialsupportisraised.Allthisisalsoin accordance with the generalprinciples ofthe Swiss technologypolicytendingtobe‘non-activist’, provid-ingprimarilyfortheimprovementofframework con-ditions for private innovation activities.
Even if a policy measure is successful from a mi-croeconomic point of view, it still remains an open question whether or not this policy measure is also relevant in macroeconomic terms. In the case of the CTI policy investigated in this paper, it is question-able if an amount of about CHF60 million in 2004 (meanwhile CHF100–150 million of additional R&D support per annum) could have a discernible impact on an economy that invested about CHF19 billion in R&D in 2004. A further open question is, of course, if some kind of ‘functional equivalent’ of this policy at a broader base, e.g. R&D tax incen-tives would do better, but such a discussion would be beyond the scope of this empirical paper.
Appendix
Table A1. Survey of subsidized enterprises: structure of answering enterprises by scientific field
Scientific field Number of addressed
enterprises Number of answering enterprises answering enterprises Percentage share of
Construction technology 16 11 68.8 Biology 13 7 53.8 Electrical machinery/electronics 18 12 66.7 Information technology 38 20 52.6 Machinery 70 46 65.7 Material sciences 33 20 60.6 Microelectronics 27 16 59.3 Nanotechnology 6 5 83.3 Process engineering 29 15 51.7 Production/management concepts 23 14 60.9 Other 34 19 55.9 Total 307 185 60.3
Table A2. Propensity of having a research project subsidized by CTI as function of various firm characteristics (probit estimation; dependent variable: research project subsidized by CTI in period 2000–2002, yes/no)
Firm characteristics Test level 5% Firm characteristics Test level 5%
Firm size: Sector:
20–49 employees -0.31 Traditional manufacturing -0.54
(0.11) (0.10)
50–99 employees -0.52 Traditional service industries -1.23
(0.13) (0.23)
100–199 employees -0.45 Modern service industries
(0.12) Region:
200–499 employees Region of Lake Geneva
500–999 employees Midlands region
1000 employees and over North western Switzerland -0.30
Other characteristics: (0.14)
Continuous R&D activities 0.40 Eastern Switzerland (0.10) Central Switzerland Export activities 0.43 Ticino
(0.11) Language of questionnaire:
Firm founded before 1996 -0.86 French 0.56
(0.14) (0.10)
German
N 1317
Adj. McFadden-R2 0.14
% concordance 76.50
Notes: Only coefficients of variables that were significant at the 5% level are reported All variables in table are dummy variables
Reference group for firm size: up to 19 employees
Reference sector: high-tech manufacturing; definition: high-tech manufacturing: chemistry, plastics, machinery, electrical machinery, electronics/instruments; modern service industries: banking/insurance, computer services; other business services; traditional manufacturing: food/beverage/tobacco, textiles, clothing/leather; wood processing, paper, printing, glass/stone/clay, metal, metalworking, watches, other manufacturing, energy; traditional service industries: wholesale trade, retail trade, transport/telecommunication, hotels/catering, personal services
Reference region: Zurich Reference language: Italian
Appendix (continued)
Table A3. Comparison of subsidized/non-subsidized enterprises, matched by ‘nearest neighbour’ method
Measures of innovation performance All non-active firms before matching Non-active firms after matching (control group)
Active firms Difference in means of active firms/non-active firms (column 3 – column 2)
Means Statistical
significance (test level 5%)
Importance of introduced innovations from a
technical point of view*
3.34 (0.03) 3.44 (0.05) 3.75 (0.06) 0.31 (0.08) Yes
Importance of introduced innovations from an
economic point of view* (0.03) 3.36 (0.06) 3.60 (0.06) 3.65 (0.081) 0.005 No Percentage reduction of average variable
production costs due to process innovation
4.98 (0.29) 3.59 (0.43) 8.61 (1.24) 5.02 (1.32) Yes
Sales of significantly improved or modified (already existing) products as percentage of total sales
33.73
(0.84) 36.60 (1.61) 48.36 (2.39) 11.76 (3.01) Yes
Sales of products new to firm or to market as
percentage of total sales 15.73 (0.57) 17.24 (1.39) 27.46 (2.27) 10.22 (2.73) Yes Sales of products new to market worldwide as a
percentage of total sales
4.44 (0.39) 3.01 (0.36) 15.58 (2.10) 12.57 (2.10) Yes
Notes: * Originally ordinal variable measured separately for product and process innovations on a five-point Likert scale (1 = very
small, 5 = very high)
Mean values are used for product and process innovations
Number of non-subsidized firms = 996; number of subsidized firms = 199 Standard errors are in brackets under the means
Two-tailed t-test used for difference of means
Table A4. Comparison of subsidized/non-subsidized enterprises, matched by ‘calliper’ method
Measures of innovation performance All non-active firms before matching Non-active firms after matching (control group
Active firms Difference of means of active firms/non-active firms (column 3 – column 2)
Means Statistical
significance (test level 5%)
Importance of introduced innovations from a technical point of view*
3.34 (0.03) 3.36 (0.02) 3.75 (0.06) 0.39 (0.06) Yes
Importance of introduced innovations from an
economic point of view* (0.03) 3.36 (0.01) 3.43 (0.06) 3.65 (0.06) 0.22 Yes Percentage reduction of average variable
production costs due to process innovation
33.73 (0.84) 36.32 (0.43) 48.36 (2.39) 12.04 (2.47) Yes
Sales of significantly improved or modified (already existing) products as a percentage of total sales
4.98
(0.29) (0.12) 5.71 (1.24) 8.61 (1.24) 2.90 Yes
Sales of products new to firm or to market as a
percentage of total sales 15.73 (0.57) 17.28 (0.27) 27.46 (2.27) 10.18 (2.34) Yes Sales of products new to market worldwide as a
percentage of total sales
4.44 (0.39) 5.94 (0.18) 15.58 (2.10) 9.64 (2.01) Yes
Notes: * See footnotes to Table A3 for key
Appendix (continued)
Table A5. Comparison of subsidized/non-subsidized enterprises, matched by ‘kernel’ method
Measures of innovation performance All non-active firms before matching Non-active firms after matching (control group)
Active firms Difference of means of active firms/non-active firms (column 3 – column 2)
Means Statistical
significance (test level 5%)
Importance of introduced innovations from a
technical point of view* (0.03) 3.34 (0.02) 3.39 (0.06) 3.75 (0.06) 0.36 Yes Importance of introduced innovations from an
economic point of view*
3.36 (0.03) 3.46 (0.01) 3.65 (0.06) 0.19 (0.06) Yes
Percentage reduction of average variable
production costs due to process innovation (0.29) 4.98 (0.11) 5.85 (1.24) 8.61 (1.22) 2.76 Yes Sales of significantly improved or modified
(already existing) products as percentage of total sales 33.73 (0.84) 36.01 (0.39) 48.36 (2.39) 12.35 (2.44) Yes
Sales of products new to firm or to market as ercentage of total sales
15.73 (0.57) 16.94 (0.30) 27.46 (2.27) 10.52 (2.36) Yes
Sales of products new to market worldwide as
percentage of total sales (0.39) 4.44 (0.17) 5.82 15.58 (2.10) (2.10) 9.76 Yes
Notes:* See footnotes to Table A3 for key
Table A6. Comparison of subsidized/non-subsidized enterprises, matched by ‘local linear regression’ method
Measures of innovation performance All non-active firms before matching Non-active firms after matching (control group)
Active firms Difference of means of active firms/non-active firms (column 3 – column 2)
Means Statistical
significance (test level 5%)
Importance of introduced innovations from a
technical point of view*
3.34 (0.03) 3.39 (0.02) 3.75 (0.06) 0.36 (0.06) Yes
Importance of introduced innovations from an
economic point of view*
3.36
(0.03) (0.01) 3.46 (0.06) 3.65 (0.06) 0.19 Yes Percentage reduction of average variable
production costs due to process innovation
4.98 (0.29) 5.85 (0.11) 8.61 (1.24) 2.76 (1.22) Yes
Sales of significantly improved or modified (already existing) products as percentage of total sales
33.73
(0.84) 36.01 (0.39) 48.36 (2.39) 12.35 (2.44) Yes
Sales of products new to firm or to market as
percentage of total sales 15.73 (0.57) 16.94 (0.30) 27.46 (2.27) 10.52 (2.36) Yes Sales of products new to market worldwide as a
percentage of total sales
4.44 (0.39) 5.82 (0.17) 15.58 (2.10) 9.76 (2.10) Yes
Notes:* See footnotes to Table A3 for key
Appendix (continued)
Table A7. Results with respect to magnitude of subsidy quotient for 2000–2002, calculated using ‘nearest neighbour’ method
Measures of innovation performance Subsidized firms: subsidy quotient > median
Subsidized firms: subsidy quotient < median Difference of means of subsidized / non-subsidized firms Statist. signif. (test level 10%) Difference of means of subsidized / non-subsidized firms Statist. signif. (test level 10%) Difference of the difference of the means (column 3 − column 2)
Importance of introduced innovations from a technical point of view*
0.42 Yes 0.18 Yes Yes
Importance of introduced innovations from an economic
point of view* 0.05 No 0.03 No No
Percentage reduction of average variable production costs due to process innovation
6.80 Yes 3.80 Yes Yes
Sales of significantly improved or modified (already
existing) products as percentage of total sales 13.90 Yes 8.20 Yes Yes Sales of products new to firm or to market as
percentage of total sales
17.90 Yes 7.10 Yes Yes
Sales of products new to market worldwide as
percentage of total sales 15.50 Yes 9.80 Yes Yes
Notes:* See footnotes to Table A3 for key
Table A8. Results with respect to magnitude of subsidy quotient (2000–2002) using ‘calliper’ method
Measures of innovation performance Subsidized firms: subsidy
quotient > median Subsidized firms: subsidy quotient < median
Difference of means of subsidized / non-subsidized firms Statist. signif. (test level 10%) Difference of means of subsidized/non-subsidized firms Statist. signif. (test level 10%) Difference of difference of means (column 3 − column 2)
Importance of introduced innovations from a technical point of view*
0.46 Yes 0.33 Yes Yes
Importance of introduced innovations from an
economic point of view*
0.13 No 0.26 Yes No
Percentage reduction of average variable production costs due to process innovation
4.10 Yes 1.90 Yes Yes
Sales of significantly improved or modified (already
existing) products as percentage of total sales 14.10 Yes 7.20 Yes Yes Sales of products new to firm or to market as
percentage of total sales
17.90 Yes 7.70 Yes Yes
Sales of products new to market worldwide as
percentage of total sales 12.60 Yes 7.20 Yes Yes
Notes:* See footnotes to Table A3 for key
Notes
1. See Bozeman (2000); Georghiou and Roessner (2000); and Feller (2007) for recent reviews of the central issues related to the evaluation of the effectiveness of technology programmes. See also Science and Public Policy (34(10), 679–752) dedi-cated to ‘New frontiers in evaluation’. Finally, see OECD (2006a) for an analysis more from the point of view of the policy-maker; Polt et al. (2001) for the role of framework
conditions for the evaluation of industry–university collabora-tions; and Polt and Streicher (2005) for the evaluation of large programmes such as the Framework Programmes of the Euro-pean Union.
2. For overviews of Swiss technology policy see OECD (2006b) and European Commission (2008). Lepori (2006) gives a long-term analysis of public research policy primarily with respect to universities and public research organizations. Griessen and Braun (2006) deal with the problems of political coordination of innovation policies in Switzerland.
Appendix (continued)
Table A.9. Results with respect to magnitude of subsidy quotient (2000–2002) using ‘kernel’ method
Measures of innovation performance Subsidized firms: subsidy quotient > median
Subsidized firms: subsidy quotient < median Difference of means of subsidized / non-subsidized firms Statist. signif. (test level 10%) Difference of means of subsidized/ non-subsidized firms Statist. signif. (test level 10%) Difference of the difference of means (column 3 − column 2)
Importance of introduced innovations from a technical
point of view * 0.39 Yes 0.30 Yes Yes
Importance of introduced innovations from an
economic point of view *
0.08 No 0.24 No No
Percentage reduction of average variable production
costs due to process innovation 3.60 Yes 1.70 Yes Yes
Sales of significantly improved or modified (already existing) products as percentage of total sales
14.40 Yes 7.60 Yes Yes
Sales of products new to firm or to market as
percentage of total sales 18.10 Yes 8.10 Yes Yes
Sales of products new to market worldwide as percentage of total sales
13.10 Yes 7.20 Yes Yes
Notes:* See footnotes to Table A3 for key
Table A.10. Results with respect to magnitude of subsidy quotient (2000–2002) using ‘local linear regression’ method
Measures of innovation performance Subsidized firms: subsidy
quotient > median Subsidized firms: subsidy quotient < median
Difference of means of subsidized/non-subsidized firms Statist. signif. (test level 10%) Difference of means of subsidized/non-subsidized firms Statist. signif. (test level 10%) Difference of difference of means (column 3 − column 2)
Importance of introduced innovations from a technical point of view *
0.40 Yes 0.31 Yes Yes
Importance of introduced innovations from an
economic point of view * 0.09 No 0.24 No No
Percentage reduction of average variable production costs due to process innovation
3.80 Yes 1.90 Yes Yes
Sales of significantly improved or modified (already
existing) products as a percentage of total sales 14.90 Yes 7.60 Yes Yes Sales of products new to firm or to market as a
percentage of total sales
18.20 Yes 8.00 Yes Yes
Sales of products new to market worldwide as a
percentage of total sales 12.60 Yes 7.10 Yes Yes