HAL Id: hal-02961176
https://hal-univ-rennes1.archives-ouvertes.fr/hal-02961176
Submitted on 19 Oct 2020HAL is a multi-disciplinary open access archive for the deposit and dissemination of sci-entific research documents, whether they are pub-lished or not. The documents may come from teaching and research institutions in France or abroad, or from public or private research centers.
L’archive ouverte pluridisciplinaire HAL, est destinée au dépôt et à la diffusion de documents scientifiques de niveau recherche, publiés ou non, émanant des établissements d’enseignement et de recherche français ou étrangers, des laboratoires publics ou privés.
Nonlinear Self-Confined Plasmonic Beams:
Experimental Proof
Tintu Kuriakose, Gilles Renversez, Virginie Nazabal, Mahmoud M. R. Elsawy,
Nathalie Coulon, Petr Němec, Mathieu Chauvet
To cite this version:
Tintu Kuriakose, Gilles Renversez, Virginie Nazabal, Mahmoud M. R. Elsawy, Nathalie Coulon, et al.. Nonlinear Self-Confined Plasmonic Beams: Experimental Proof. ACS photonics, American Chemical Society„ 2020, 7 (9), pp.2562-2570. �10.1021/acsphotonics.0c00906�. �hal-02961176�
fined Plasmonic Beams: Experimental Proof
Tintu Kuriakose, Gilles Renversez,
*
Virginie Nazabal, Mahmoud M. R. Elsawy, Nathalie Coulon,
Petr Němec, and Mathieu Chauvet
*
Cite This:ACS Photonics 2020, 7, 2562−2570 Read Online
ACCESS
Metrics & More Article Recommendations*
sı Supporting InformationABSTRACT: Controlling low power light beam self-confinement with ultrafast response time opens up opportunities for the development of signal processing in microdevices. The combina-tion of a highly nonlinear medium with the tight confinement of plasmonic waves offers a viable but challenging configuration to reach this goal. In the present work, a beam propagating in a plasmonic structure that undergoes a strongly enhanced self-focusing effect is reported for the first time. The structure consists of a chalcogenide-based four-layer planar geometry engineered to limit plasmon propagation losses while exhibiting efficient Kerr self-focusing at moderate power. As expected from theory, only TM-polarized waves exhibit such a behavior. Different exper-imental arrangements are tested at telecom wavelengths and compared with simulations obtained from a dedicated model. The
observed efficient beam reshaping takes place over a distance as low as 100 μm, which unlocks new perspectives for the development of integrated photonic devices.
KEYWORDS: nonlinear integrated plasmonics, self-confined waves, optical Kerr effect, chalcogenide glass, planar waveguides, modeling
T
he efficiency of nonlinear optical processes is well-knownto benefit from intense light. One way to achieve such high electromagneticfields at a low excitation level is to exploit light interactions with metal nanostructures. In that sense, the surface plasmon polariton (SPP)1 at a metal−dielectric interface, associated with both a collective oscillation of free charges in the metal and an extremely confined light wave, has been a key discovery. Since then, plasmonics has evolved into a flourishing research field2
thanks notably to the numerous developments on metamaterials.3,4 It was then natural to combine plasmonics and nonlinear optics to envision a variety of fascinating and original physical phenomena with great potential applications. Nonlinear plasmonics5 has thus grown significantly in recent years. Among other nonlinear phenom-ena, self-trapped beams, that can lead to spatial solitons,6have already been observed at very low optical power in non-standard nonlinear media such as photorefractive7,8 or liquid crystal9 but their slow formation times are not suitable for ultrafast signal processing. To the contrary Kerr spatial solitons10,11have a fast response but necessitates high optical power. Self-trapped plasmonic waves formed in Kerr-like nanostructures should authorize the use of lower power by exploiting enhanced nonlinear effects while allowing nonlinear optical components to be scaled down in size. The main possible uses of these nonlinear plasmonic waves would be in integrated optics devices where high speed, small footprint, and reduced power consumption are key factors.12,13
First descriptions of one-dimensional nonlinear self-trapped waves with potential to form plasmon-solitons at metal/ dielectric interfaces and nonlinear surface waves at dielectric/ dielectric interfaces were unveiled in the early eighties.14−17 The concept being to propagate a plasmon-polariton wave at a metal−nonlinear material interface in order to induce an exalted Kerr self-focusing effect giving rise to a self-trapped wave. Up to now, the problem has been tackled only theoretically, based on numerous analytical and numerical calculations.18−28 Despite this constant and comprehensive modeling development, no experimental evidence of self-trapped nonlinear plasmonic waves, including their stable forms, so-called plasmon-solitons in ref 18, has yet been revealed, despite almost four decades since the first publications on nonlinear surface waves.14,15 Among the practical challenges inherent to this plasmon assisted self-focusing demonstration are the large propagation losses associated with plasmons, the request for a strong Kerr Received: June 4, 2020
Published: August 17, 2020
Downloaded via UNIVERSITE DE RENNES 1 on October 19, 2020 at 08:05:35 (UTC).
coefficient, and the limitations due to the damage threshold intensity of the plasmonic structure.
In the present work, a four-layer slab component is designed and fabricated to support a SPP with moderate losses along with a strong Kerr nonlinear effect. This structure allows the first experimental observation of a self-confined nonlinear wave that combines a self-trapped wave and a SPP in a single wave. This nonlinear wave reveals a strongly enhanced self-focusing occurring over distances as short as 100 μm due to the plasmonic effect. The content of this Article is as follows: first, the structure design and fabrication steps are described. Second, nonlinear optical characterizations are presented. Third, the dedicated nonlinear propagation model is described. Finally, simulations are confronted to the experiments, and results are discussed.
■
DESIGN AND FABRICATION OF THE STRUCTURESA chalcogenide glass is chosen as the nonlinear medium since it exhibits a Kerr effect about 2 orders of magnitude stronger than silica thanks to the strong polarizability of the chalcogen elements while offering a fast temporal response with a femtosecond time scale due to its underlying mechanism based on electronic polarization.29 The origin of our nonlinear plasmonic component is a planar chalcogenide waveguide that possesses the suitable linear and nonlinear properties to form Kerr spatial solitons at near-infrared wavelengths.30,31A metal film is added for the propagating wave to trigger a plasmonic effect. However, a compromise has to be found between a tight light confinement provided by the plasmonic effect, which we want to exploit to efficiently exalt the Kerr effect, and the high propagation losses induced by the metal that would prevent the observation of the Kerr self-focusing.
The chosen solution is to insert a thin silica buffer layer between the metal and the nonlinear dielectric layer. The designed waveguide including its plasmonic structure (PS) derives from our previously published theoretical studies21,22
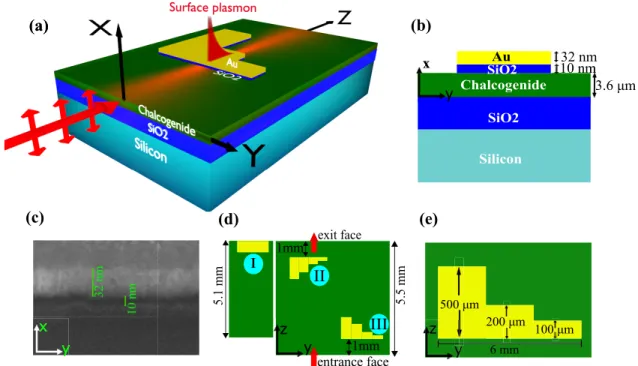
and from Finite Element Method (FEM) simulations (see section 3 of theSupporting Information). To be more specific, the Kerr layer is a 3.6μm thick Ge28.1Sb6.3Se65.6amorphous chalcogenidefilm32(Figure 1a,b andSupporting Information). This glass with a 2.16 eV bandgap and with a refractive index of 2.54 at 1.55 μm was chosen due to its large Kerr nonlinearity (n2= 5.5× 10⁻¹⁸ m2/W), moderate two-photon absorption coefficient (α2 = 0.43 cm/GW), a high damage threshold intensity evaluated to approximately 2.5 GW/ cm2,31,33
and a low photosensitivity.33 Note that the two-photon absorption at 1.55 μm is attributed to an Urbach’s absorption tail related to both thermal effects and static disorder.33 A silica buffer layer followed by a gold layer are then deposited on top of the chalcogenide material.
FEM simulations34,35have been performed to compute the nonlinear modes propagating in the structure in order to determine the optimum thicknesses for these top layers. It is important to note that the modes are calculated in nonlinear regime, that is, their amplitude is dependent on the magnitude of the self-focusing effect. These simulations showed that the silica buffer layer thickness d is the most critical parameter for the design, as expected from a previous work dealing with linear configurations36 and confirmed later for nonlinear waveguides.37 As shown in Figure 2a, for d = 30 nm, the fundamental optical modes propagating in the full structure are similar for TM and TE polarizations and resemble the guided mode profiles present without metal. To the contrary, for d = 10 nm, the TM mode clearly benefits from a strong localization at the chalcogenide/silica interface due to the plasmonic effect while the TE mode is nearly unaffected (Figure 2b andsection 4 of the Supporting Information). A 3-D distribution of the TM modes is depicted inFigures S1 and S2 of the Supporting Information. Simulations also show that a 10 nm buffer layer allows a decrease by a factor three of the propagation losses for the TM mode compared to a basic structure without silica buffer (seesections 3 and 4 of the Supporting Information). Figure 1.Description of the samples. (a) Artistic 3-D view of a sample. (b) Description of the cross section of the plasmonic structure. (c) SEM image of the Au/SiO2/ chalcogenide interfaces. (d) Schematic overall top view of the samples showing the three studied configurations denoted by
I, II, and III. (e) Detailed schematic top view of a staircase metallic pattern.
ACS Photonics pubs.acs.org/journal/apchd5 Article
https://dx.doi.org/10.1021/acsphotonics.0c00906 ACS Photonics 2020, 7, 2562−2570
The heterostructure fabrication was conducted in several steps. First, the 3.6 μm thick Ge28.1Sb6.3Se65.6 chalcogenide layer is deposited by RF magnetron sputtering method on an oxidized silicon wafer. Then a 10 nm silica buffer layer, followed by a 32 nm gold layer, is formed on top to give the structure depicted in Figure 1b. While challenging, the deposition of the very thin SiO2 layer is operated by a sputtering deposition technique. A 32 nm gold nanolayer is
configurations by choosing the position of the launched beam along the Y-axis. Specifically, three different PS locations were considered as described inFigure 1d. The first one is a rectangular plasmonic pattern, h = 660μm long, located at the exit face of a 5.1 mm long sample (configuration I). The two other configurations correspond to a 5.5 mm long sample with a staircase PS with three different h values equal to 100, 200, and 500μm, present either 1 mm before the exit face or 1 mm after the entrance face to form configurations II and III, respectively. The input and output faces of the samples are formed by cleaving the samples.
■
OPTICAL CHARACTERIZATIONSCharacterizations are performed with an optical parametric oscillator (Chameleon OPO from Coherent) set to 1550 nm and emitting 200 fs pulses at a repetition rate of 80 MHz (Figure 3a and Supporting Information). The beam is elliptically shaped and focused with a cylindrical lens and a microscope objective to give a 4μm (fwhm) focal spot along the X-axis at the entrance of the waveguide, while a 31 μm focal spot along the Y-axis is located 2 mm inside the sample in the linear regime (low intensity). Figure 3a shows the corresponding input beam profile at the entrance face of the waveguide. In the linear regime, the propagation beam is weakly diffracting along the Y-axis; as a consequence, the focal point position (along Y), relative to the PS location, has only a negligible influence in the studied behavior for the three configurations. Such a beam arrangement helps to prevent input facet damage in the high intensity regime. The beam profile at the output of the sample is imaged on a Vidicon camera with a×10 microscope objective. In the linear regime, the output beam reaches a fwhm of 41 μm along the Y-axis (Figure 3a). Note that the imaging system was chosen to analyze the beam size variation along the Y-axis due to the self-focusing effect, but it was not adequate to resolve the much smaller beam X-dimension. Note also that a careful beam Figure 2. Calculated intensity profiles along the X-axis of the
fundamental modes of same power Ptot = 513 W for TM (green
curves) and TE (magenta curves) polarizations and zoom-in near the silica/gold interface (insets). SiO2buffer thickness d is equal to 30 nm
(a) and 10 nm (b).
Figure 3.(a) Experimental setup for the observation of the self-confined nonlinear waves and intensity distribution of the input and output beams in the linear regime. HWP, half wave plate; PBS, polarizing beam splitter; Ch, chopper; CL, cylindrical lens; Obj, microscope objective; NDF, neutral densityfilters. (b−g) Intensity distribution of self-focused output beams for two input intensities without PS (b, c), with PS corresponding to configuration I for TM polarization (d, e), and for TE polarization (f, g).
alignment is performed to maximize the beam overlap with the fundamental mode of the planar waveguide and thus avoid excitation of higher-order modes. Input and output powers are monitored by power meters to deduce the coupling efficiency, the peak power, and the waveguide transmission. In the linear regime a 21% waveguide transmission is measured for both TM and TE polarizations when light propagates away from the metallized area. This transmitted power is consistent with a coupling efficiency of 28% and propagation losses of about 0.19 cm−1.
To unambiguously reveal the influence of the plasmonic effect on the beam focusing, we first characterize the self-trapping behavior in the absence of metallic layer, referred as without PS, along the beam path. These preliminary experiments can thus be considered as a reference. As shown in refs 30 and 31, similar chalcogenide slab waveguides can support spatial solitons at near-infrared wavelengths. In the tested sample we observe that, for an input intensity of 0.62 GW/cm2, a 30μm fwhm beam is obtained at the output face (Figure 3b). This size is close to the injected beam size of 31 μm, which indicates that diffraction is compensated by the nonlinear Kerr self-focusing effect to form a spatial soliton.6
A stronger focusing effect occurs if the input intensity is further raised. For an intensity of 1.17 GW/cm2, a 23 μm fwhm is obtained at the output (Figure 3c). Note that the very same behavior is observed independently of the polarization for a configuration without PS (see Figure S9 in the Supporting Information).
We then shift laterally the sample so that a PS is present on the trajectory of the launched beam. Configuration I described inFigure 1d isfirst considered with a PS length h of 660 μm. In the linear regime, the presence of this metallic structure located at the end of the waveguide does not modify the observed output beam distribution. The linear transmission is however reduced due to additional propagation losses compared to the situation without the PS. We deduce that under the PS the attenuation is 0.57 and 28 cm−1for TE and TM polarized light, respectively. The larger attenuation coefficient for the TM case is a first indication of the plasmonic effect. Subsequently, as the intensity is raised, a strong enhancement of the self-focusing behavior is observed at the output of the waveguide for TM waves. For instance, at an input intensity of 0.62 GW/cm2 (Figure 3d), the output beam is already much narrower (19 μm fwhm) than the injected one (31μm fwhm), while a higher intensity of 1.17 GW/cm2 leads to a very efficient trapping of the beam, as witnessed by an output beam of 12μm fwhm (Figure 3e). By comparing this result with the one obtained at the same intensity without PS (Figure 3c), we can deduce that the
plasmonic enhanced nonlinear effect induced by the 660 μm long PS focuses the beam from about 23 to 12μm fwhm. It is important to note that the exalted focusing is not observed for the TE polarization. Indeed, as shown inFigure 3f,g, the TE wave shows no improved self-focusing compared to the configuration without the PS (Figure 3b,c). This polar-ization-dependent behavior is a characteristic feature of the plasmonic effect. To exclude the possible influence of thermally induced self-focusing in the nonlinear regime, experiments are repeated with a mechanical chopper positioned after the light source to diminish the average power to 40% while keeping the same peak power (seesection 11 in the Supporting Information). No measurable change is observed compared to the behavior described in Figure 3, which excludes any significant role of a thermally induced nonlinearity.
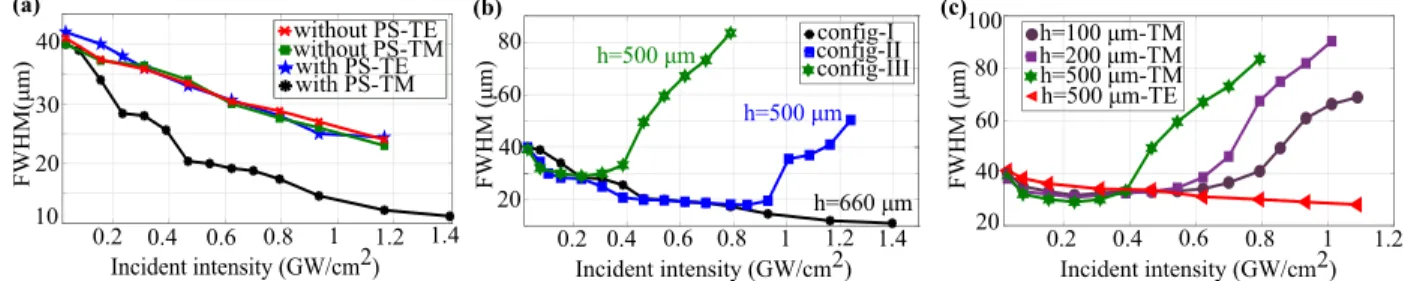
The experimentally demonstrated striking self-focusing enhancement due to the plasmonic effect is also evident in Figure 4a, where the measured output fwhm beam is plotted as a function of the input beam intensity for TE and TM polarizations with and without the PS. For the three arrangements for which the plasmonic effect is not present, that is, without or with PS for TE polarization and without PS for TM polarization, similar behaviors are observed. They are characterized by a gradual focusing with a nearly linear decrease of the beam width versus intensity. Remarkable features are observed for a TM polarized beam in the presence of a PS: (1) This plasmon-enhanced configuration always gives rise to an output fwhm beam smaller than for the other three configurations; (2) The focusing effect takes place at a faster pace for low intensity; (3) Three times less intensity is required compared to the cases without enhancement to obtain an output size of 31μm; (4) The fwhm evolves with a nonlinear trend and tends to saturate to a strongly focused beam of 11μm fwhm at 1.4 GW/cm2.
To gain a better understanding of the disclosed self-trapped plasmonic wave and its strong focusing, additional con fig-urations are tested. Wefirst study the influence of the position of the PS. Figure 4b compares the fwhm as a function of intensity for a 500μm long PS positioned either 1 mm before the exit face (Figure 1d, configuration II) or 1 mm after the input face (Figure 1d, configuration III) and the previously described case (configuration I) for a 660 μm long PS. At very low intensity, the beam undergoes a similar free diffraction in the different samples, regardless of the PS location, precluding any linear beam distortion from the PS. As soon as the intensity is raised, the output beam focuses sharply in accordance with the Kerr lens effect present in the PS. Figure 4. (a) Measured output beam fwhm as a function of input intensity for both TM and TE polarizations without PS and with a PS corresponding to configuration I. (b) Evolution of output beam fwhm as a function of input intensity for configurations I, II, and III for TM polarization. (c) Evolution of output beam fwhm for configuration III for PS lengths h of 500, 200, and 100 μm for TM polarization and for h of 500μm for TE polarization.
ACS Photonics pubs.acs.org/journal/apchd5 Article
https://dx.doi.org/10.1021/acsphotonics.0c00906 ACS Photonics 2020, 7, 2562−2570
weaker nonlinearity present after the PS and beam diffraction dominates. The diffracted beam is narrower in configuration II since the PS is only 1 mm from the output face and diffraction then occurs on a shorter distance compared to configuration III. The numerical model presented later in the manuscript confirms this assumption and gives a clearer picture of the phenomena. The observed higher input intensity threshold when the PS is further to the input face (Figure 4b, configuration II) is also expected. Indeed, diffraction overtakes self-focusing when the beam reaching the PS exceeds a threshold intensity. To attain this threshold, a higher input intensity is necessary when the PS is further to the input face to compensate for propagation losses occurring along the input-PS distance.
To analyze the impact of the length h of the PS, experiments are also conducted for PS lengths of 100 and 200 μm for configuration III (Figure 1d,e). The results are presented in Figure 4c, along with measurements made for h = 500μm and for the enhancement-free TE polarization. As the intensity increases, the PS self-focusing enhancement gives a minimum fwhm value before the spatial spreading occurs. The shorter the PS, the weaker the nonlinear focusing effect. The minimum beam size is reached at an intensity of about 0.24 GW/cm2, giving an output fwhm of 31.6, 30.7, and 29μm for 100, 200, and 500 μm PS length, respectively. As the intensity is increased further, beam spreading becomes dominant. This assumption of a beam widening dictated by diffraction authorizes an indirect evaluation of the spot size reached at the exit of the PS. Indeed, from the Gaussian beam theory, a 13 μm fwhm spot is expected to give a 70 μm fwhm over 4 mm distance, as observed inFigure 4c for TM-polarized beams for configuration III for an input intensity of 1.1 GW/cm2. This predicted spot size is consistent with the 12μm fwhm direct measurement shown in Figure 3e for configuration I for an input intensity of 1.17 GW/cm2. From the beam widening obtained in the high intensity regime inFigure 4c, we can also conclude that self-focusing is more efficient in long PS structures. For instance, a 70 μm output fwhm resulting from an assumed 13μm fwhm self-focused spot is induced by an input intensity of 0.7 GW/cm2for a 500μm long PS, while a 1.1 GW/cm2is requested for a 100μm long PS (Figure 4c). It is remarkable that even a PS as short as 100μm can induce a strong focusing.
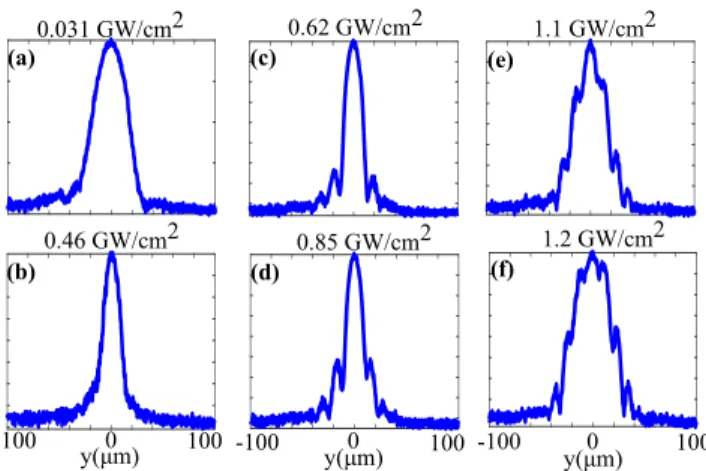
The analysis of the output beam profile provides crucial additional information that was not revealed by the fwhm measurements. InFigure 5, the output beam profile is plotted for six intensity values for a 500μm long PS corresponding to configuration II. The efficient focusing effect previously described forms at first a smooth profile beam with a weak pedestal (Figure 5b). This beam-cleaning feature is a characteristic of a spatial soliton regime. It thus may indicate that an intensity of 0.5 GW/cm2 triggers this regime for configuration II. As the intensity is further raised, the beam then enlarges and develops symmetric side lobes on both sides
of the main peak (Figure 5c−f). To gain more insight into the observed enhanced self-focusing phenomena, a numerical model presented in the following section has been developed.
■
SIMULATIONSThe numerical scalar model is based on a modified spatial nonlinear Schrödinger equation (SNLSE). This scalar model describes the transversefield profile along the Y-axis and its evolution versus propagation along the Z-axis.6,38It is adapted to take into account the modefield profile along the X-axis that is dependent on polarization, power or location along propagation in the full structure. An example of this x-dependence is illustrated inFigure 2for TE and TM modes. The field x-dependency does not explicitly appear in the SNLSE but is considered indirectly through the z-dependent modal properties (effective nonlinearity and propagation constants) that appear in the SNLSE. These modal parameters are obtained from the FEM-based simulations of the fundamental TE and TM modes associated with the different sections of the full structure34,35 (see sections 3−5 of the Supporting Information).
We consider that the structure is stepwise constant along the Z-axis. In each discretized segment of the propagation, the fundamental mode is first determined using our FEM mode solver mentioned above. The mode XY-distribution is thus determined together with its propagation constant in each segment.
It is worth to remind that only the transverse dimension along y is usually considered for Kerr spatial solitons in slab waveguides studies.38,39To also take into account the influence of the spatial field x-profile, we start from the nonlinear evolution equation where both x and y variables are considered. To obtain the final SNLSE involving only the transverse coordinate y and the propagation direction coordinate z, we proceed by analogy with ref 40, where the NLSE is derived in the temporal domain using a spatial integration in the cross section of the waveguide. In our study we limit the spatial integration on the nonlinear region of the X-axis only (denoted NL layer below) and we keep the dependency along the Y-axis. E(r, t) being the electricfield of the propagating wave, we also renormalize the investigated amplitude denoted by Ã(y, z) in order to get directly the optical intensity I when one takes its modulus squared: Figure 5.Measured output beam profile evolution as a function of incident intensity for configuration II, TM polarization, h = 500 μm.
ω β = ̂ − − + t F x A y z t z E r( , ) 1u 2 ( ( ) ( , )exp( i( 0 0 )) cc) (1) ε | ̃A y z | = |A y z | nc ( , )2 ( , )2 2 0 (2)
where cc means the complex conjugate and û is a unitary vector in the waveguide cross section giving the studied polarization. Ã(y, z) obeys the following SNLSE:
P P β α α ω η ∂ ̃ ∂ = ∂ ̃ ∂ − ̃ − ̃ | ̃ + ̃ | ̃ A y z z A y z y A y z A y z A y z n c A y z A y z ( , ) 2 ( , ) 2 ( , ) 2 ( , ) ( , ) ( , ) ( , ) x D 2 2 2 2 0 2 1 2 (3) with
∫
∫
η ≡ _ _ F x( ) dx F x( ) dx x D 1 NL layer 4 NL layer 2 (4) The 1D normalized profile F(x) is obtained from the 2D nonlinear profiles of the electromagnetic field of the fundamental mode in the considered segment computed with the FEM modal method. F(x) is the x profile obtained at y = 0 and normalized according to the formula∫−∞+∞F(x)2dx = 1. The one-dimensional integrals defining ηx1D are computed only over the nonlinear region. These integrals along with the propagation constantβ and the full field profiles are computed using our FEM mode solver.ηx1Dis called the opto-geometrical nonlinear factor. Before pursuing the description of the ηx1D quantity, it is needed to explain how the experimental value of the material nonlinear coefficient n2 has been obtained. In several cases, its value is derived from nonlinear propagation simulations using the 2D SNLSE where the transverse fwhm is computed and then compared to the measured ones as we have done in ref 31. However, the SNLSE in the latter reference did not take into account the field x-profile and consequently the factorηx1Dwas missing. This factorηx1Dthat only appears in the last term of (3) is similar to the η parameter described in the derivation of the nonlinear Schrödinger equation in the temporal domain for optical fibers by formula (5.26) in Okamoto’s book.41The main difference is that we integrate only along the x-dimension corresponding to the thickness of the nonlinear layer while the spatial integration is realized on the full 2D cross section of the HE11mode of a circular step-indexfiber in.41The values ofηx1D are computed using the nonlinear fixed power algorithm described in ref35for the studied structures. They are given in Table 1 in the Supporting Information, for the fundamental TE and TM modes with and without the PS. The TE mode without PS and TM mode without PS correspond to the cases used to evaluate the nonlinear coefficient n2 in ref 31. As a result, the previously provided n2takes into account the mode related quantityηx1Dfor the TE and TM cases without PS, its value is numerically evaluated to approximately 0.4. For the TM mode with PS,ηx1Dis between 3.15 and 3.51 times higher than for the other cases. This ratio ηx1D (TM with PS)/η
x 1D (TM without PS) is the key parameter of the plasmonic nonlinear reinforcement and will be called the effective nonlinearity enhancement factor. It slightly increases with the mode power, as shown in Table 1 in the Supporting Information. Consequently, the model gives an effective nonlinearity enhancement for the TM mode with PS at least 3-fold the ones without PS. We, however, found that an
effective nonlinearity improvement of 8 has to be set in order to quantitatively predict the above-described experimental results. We mainly attribute this discrepancy to our modeling approach and also to the potential nonlinear contribution of gold, as discussed later. Note also that this enhancement factor is low compared to plasmonic studies involving standing waves or localized resonances based on metallic nanostructures coupled to an electromagnetic field that can provide an enhancement factor above 100.2,5 It is important to point out that our experiment instead involves propagating plasmonic waves. In ref42, dealing with a quite similar configuration, but for a structure based on CS2 and silver nanoparticles, the authors computed an enhancement factor of 2, which is in the same range as ours. We would like to emphasize that, apart from this enhancement factor, other simulation parameters, notably linear and nonlinear absorption coefficients, are the ones determined experimentally in the previous sections. It is worth pointing out that the developed model also gives results in accordance with our experimental results for Gaussian beams propagating both in linear and nonlinear regimes in the slab nonlinear waveguide. The observed spatial soliton propagation is notably predicted. The numerical implementa-tion of the resoluimplementa-tion of the nonlinear propagaimplementa-tion equaimplementa-tion is detailed in section 9 of the Supporting Information. Quantitative comparisons between the numerical predictions and the experimental observations for the plasmon-enhanced self-trapping are presented in the following section.
■
DISCUSSIONFigure 6a presents the calculated profile along the Y-axis of the beam intensity versus propagation inside the full structure for the TM polarization for configuration II with h = 500 μm at 1.25 GW/cm2input intensity. This emblematic case shown in Figure 6a reveals several remarkable characteristics that give more insight into the behavior unveiled experimentally. First, we see that the beam self-focuses along the first 2 mm propagation and then becomes nearly invariant before converging dramatically to a highly focused central peak as it travels in the 500 μm long PS region localized between the dashed lines. Finally, as the beam leaves this highly nonlinear PS region, diffraction overtakes the self-focusing effect (see Figure S6 in the Supporting Informationfor the results for the same configuration at 15 MW/cm2 input intensity). It is important to note that the numerical model not only predicts the spreading once the beam exits the PS, but it also depicts the symmetric lateral peaks observed experimentally (Figure 5). These peaks are generated in the last part of the PS for intensities above 0.6 GW/cm2, a value in fair agreement with the experiments. These specific profiles also play a role in the beam spreading observed at high intensity for configurations II and III (seesections 6 and 7 of the Supporting Informationfor details). Although spatial modulation instability is known to induce beam breakup of an initial noisy broad beam propagating in Kerr nonlinear media, it does not fit to the present phenomenom. Indeed, the measured intensity depend-ence of the generated spatial frequency does not follow the scaling law of modulation instability43,44(seesection 13 in the Supporting Information). Moreover, large amplitude spatial noise added in the present simulations does not give rise to the observed multipeaks unless the plasmon-enhanced nonlinearity is present. We think the phenomenon revealed here is a combination of the beam breakup described in refs 45−47, induced at the interface between two dielectric regions of high
ACS Photonics pubs.acs.org/journal/apchd5 Article
https://dx.doi.org/10.1021/acsphotonics.0c00906 ACS Photonics 2020, 7, 2562−2570
and low Kerr-type nonlinearities and of the symmetric lateral peaks generated for intensities above the soliton regime.
The comparison between the measured and the computed fwhm as a function of the incident intensity, obtained for configuration I for TE and TM polarizations, is provided in Figure 6b. The nonlinear behavior is in agreement with the observations. Numerical results obtained for TE polarization with and without PS are represented by the same calculated points (filled orange squares) since effective nonlinearity enhancement and losses are fully similar for both cases. The model applied to a TM wave in the absence of PS (open orange circles) predicts an equivalent behavior. These three cases mimics fairly well the corresponding experimental data. More importantly, the simulations for TM polarization with PS (filled orange circles) nicely follow the experimental measure-ments. Note that the saturation of the self-focusing effect appearing experimentally at high power is also reproduced by the simulations. This proves that the plasmonic effect due to the PS is able to quantitatively explain the observed large focusing enhancement. The validity of our numerical model is further confirmed by comparison with experimental results from configurations II and III. The influence of the PS length
the calculation of the effective nonlinearity are not fully valid when the beam profile rapidly transforms in the PS. Second, the considered instantaneous response of the Kerr effect could be questioned in the femtosecond regime.48 Third, there are some uncertainties on the values of the nonlinear coefficients n2 and α2 of this uncommon chalcogenide composition.49 Finally, the gold nanolayer permittivity, thickness uniformity, and its potential nonlinearity50−52 can also be a reason for discrepancies between simulation results and measurements.
■
CONCLUSIONIn summary, a compelling spatial confinement of a guided beam observed only for TM polarization, in a Kerr plasmonic structure, has been demonstrated experimentally. The designed structure consists of a slab waveguide made of a highly nonlinear chalcogenide layer covered with nanolayers of silica and gold. The thickness of the silica layer has been tailored using FEM modal simulations to benefit from an enhanced self-focusing due to the plasmonic part of the wave while limiting the detrimental effect of propagation losses induced by the metal. Experimental observations are confirmed by numerical predictions obtained using a tailored model of nonlinear propagation combining FEM modal results and SNLSE. This experimental proof validates the concept of nonlinear spatial optical self-trapping in guided optics enhanced by a plasmonic effect and paves the way to the formation of shape preserving plasmon-soliton waves. The dramatic nonlinear beam reshaping induced over a distance of a few hundred microns at moderate light power opens up new perspectives for nonlinear integrated plasmonic devices. Further investigations such as pump−probe experiments are foreseen to complete the quantitative description of the observed phenomena and to assess the potential for all-optical signal processing of these nonlinear structures.
■
ASSOCIATED CONTENT*
sı Supporting InformationThe Supporting Information is available free of charge at https://pubs.acs.org/doi/10.1021/acsphotonics.0c00906.
There are 13 sections: Structure fabrication; Exper-imental characterizations; Simulations: modal analysis with thefinite element method; Details of the nonlinear mode profiles; Impact of parameter variability for the nonlinear mode simulations of configuration I; Com-plementary simulation results for configuration II; Complementary results for configurations I, II, and III; Discussion on the limitations of the SNLSE; Numerical implementation of the nonlinear propagation equation; Experimental results: TE polarization vs TM polar-ization without PS; Test of thermal effects; Comple-mentary discussion on the solitonic nature of the self-trapped waves; Test of the spatial modulation (PDF) Figure 6.Numerical results. (a) Color map in log scale of the beam
intensity evolution along the Y-axis vs propagation inside the full structure for TM polarization for configuration II, with h = 500 μm in the nonlinear regime (input intensity of 1.25 GW/cm2). The dashed
lines represent the limits of the PS. (b) Comparison of the computed and measured fwhm for configuration I as a function of the input beam intensity. Note that, at this scale, there is no visible difference between the simulation results for TE polarization with or without PS (filled orange squares).
■
AUTHOR INFORMATIONCorresponding Authors
Gilles Renversez− Aix−Marseille Univ, CNRS, Centrale Marseille, Institut Fresnel, 13013 Marseille, France;
orcid.org/0000-0002-7184-2665; Email:gilles.renversez@ univ-amu.fr
Mathieu Chauvet− FEMTO-ST Institute, CNRS, University of Bourgogne Franche-Comté, 25030 Besançon, France;
Email:[email protected] Authors
Tintu Kuriakose− FEMTO-ST Institute, CNRS, University of Bourgogne Franche-Comté, 25030 Besançon, France
Virginie Nazabal− Univ Rennes, CNRS, ISCR (Institut des Sciences Chimiques de Rennes)− UMR 6226, 35000 Rennes, France; orcid.org/0000-0002-0113-3935
Mahmoud M. R. Elsawy− Aix−Marseille Univ, CNRS, Centrale Marseille, Institut Fresnel, 13013 Marseille, France Nathalie Coulon− Univ Rennes, CNRS, IETR (Institut
d’Electronique et de Technologies du numérique) − UMR 6164, 35000 Rennes, France
Petr Němec − Department of Graphic Arts and Photophysics, Faculty of Chemical Technology, University of Pardubice, 53210 Pardubice, Czech Republic
Complete contact information is available at: https://pubs.acs.org/10.1021/acsphotonics.0c00906
Notes
The authors declare no competingfinancial interest.
■
ACKNOWLEDGMENTSThe authors acknowledge thefinancial support of the Région Franche-Comté, of Aix-Marseille University, and of the Czech Science Foundation (GACR Project 19-24516S). This work was also partially supported by the FEMTO-ST MIMENTO technological facilities.
■
REFERENCES(1) Cunningham, S. L.; Maradudin, A. A.; Wallis, R. F. Effect of a charge layer on the surface-plasmon-polariton dispersion curve. Phys. Rev. B 1974, 10, 3342−3355.
(2) Maier, S. A. Plasmonics: Fundamentals and Applications; Springer, 2007.
(3) Cui, T. J.; Liu, R.; Smith, D. R. In Metamaterials: Theory, Design, and Applications, 1st ed.; Cui, T. J., Smith, D., Liu, R., Eds.; Springer: U.S., 2010.
(4) Liberal, I.; Engheta, N. Near-zero refractive index photonics. Nat. Photonics 2017, 11, 149−158.
(5) Kauranen, M.; Zayats, A. V. Nonlinear plasmonics. Nat. Photonics 2012, 6, 737−748.
(6) Trillo, S., Torruellas, W., Eds. In Spatial Solitons; Optical Sciences; Springer, 2001.
(7) Segev, M.; Valley, G. C.; Crosignani, B.; DiPorto, P.; Yariv, A. Steady-State Spatial Screening Solitons in Photorefractive Materials with External Applied Field. Phys. Rev. Lett. 1994, 73, 3211−3214.
(8) Fazio, E.; Renzi, F.; Rinaldi, R.; Bertolotti, M.; Chauvet, M.; Ramadan, W.; Petris, A.; Vlad, V. I. Screening-photovoltaic bright solitons in lithium niobate and associated single-mode waveguides. Appl. Phys. Lett. 2004, 85, 2193−2195.
(9) Peccianti, M.; Conti, C.; Assanto, G.; De Luca, A.; Umeton, C. Routing of anisotropic spatial solitons and modulational instability in liquid crystals. Nature 2004, 432, 733−737.
(10) Aitchison, J. S.; Weiner, A. M.; Silberberg, Y.; Oliver, M. K.; Jackel, J. L.; Leaird, D. E.; Vogel, E. M.; Smith, P. W. E. Observation
of spatial optical solitons in a nonlinear glass waveguide. Opt. Lett. 1990, 15, 471.
(11) Suntsov, S.; Makris, K. G.; Christodoulides, D. N.; Stegeman, G. I.; Haché, A.; Morandotti, R.; Yang, H.; Salamo, G.; Sorel, M. Observation of Discrete Surface Solitons. Phys. Rev. Lett. 2006, 96, 063901.
(12) Stegeman, G. I.; Wright, E. M.; Finlayson, N.; Zanoni, R.; Seaton, C. T. Third order nonlinear integrated optics. J. Lightwave Technol. 1988, 6, 953−970.
(13) Martellucci, S.; Chester, A. N.; Bertolotti, M. Advances in Integrated Optics, reprint of the original 1st ed., 1994 ed.; Springer, 2012.
(14) Agranovich, V. M.; Babichenko, V. S.; Chernyak, V. Y. Nonlinear surface polaritons. JETP Lett. 1980, 32, 512−515.
(15) Tomlinson, W. J. Surface wave at a nonlinear interface. Opt. Lett. 1980, 5, 323−325.
(16) Ariyasu, J.; Seaton, C. T.; Stegeman, G. I.; Maradudin, A. A.; Wallis, R. F. Nonlinear surface polaritons guided by metal films. J. Appl. Phys. 1985, 58, 2460−2466.
(17) Akhmediev, N. Novel class of nonlinear surface waves: asymmetric modes in a symmetric layered structure. Sov. Phys. JETP 1982, 56, 299−303.
(18) Feigenbaum, E.; Orenstein, M. Plasmon−soliton. Opt. Lett. 2007, 32, 674.
(19) Davoyan, A. R.; Shadrivov, I. V.; Kivshar, Y. S. Self-focusing and spatial plasmon-polariton solitons. Opt. Express 2009, 17, 21732− 21737.
(20) Bliokh, K. Y.; Bliokh, Y. P.; Ferrando, A. Resonant plasmon-soliton interaction. Phys. Rev. A: At., Mol., Opt. Phys. 2009, 79, 41803. (21) Walasik, W.; Nazabal, V.; Chauvet, M.; Kartashov, Y.; Renversez, G. Low-power plasmon-soliton in realistic nonlinear planar structures. Opt. Lett. 2012, 37, 4579−4581.
(22) Walasik, W.; Renversez, G.; Kartashov, Y. V. Stationary plasmon-soliton waves in metal-dielectric nonlinear planar structures: Modeling and properties. Phys. Rev. A: At., Mol., Opt. Phys. 2014, 89, 023816.
(23) Walasik, W.; Renversez, G. Plasmon-soliton waves in planar slot waveguides. I. Modeling. Phys. Rev. A: At., Mol., Opt. Phys. 2016, 93, 013825.
(24) Walasik, W.; Renversez, G.; Ye, F. Plasmon-soliton waves in planar slot waveguides. II. Results for stationary waves and stability analysis. Phys. Rev. A: At., Mol., Opt. Phys. 2016, 93, 013826.
(25) Marini, A.; Biancalana, F. Ultrashort Self-Induced Transparency Plasmon Solitons. Phys. Rev. Lett. 2013, 110, 243901.
(26) Smirnova, D. A.; Shadrivov, I. V.; Smirnov, A. I.; Kivshar, Y. S. Dissipative plasmon-solitons in multilayer graphene. Laser & Photonics Reviews 2014, 8, 291−296.
(27) Nesterov, M. L.; Bravo-Abad, J.; Nikitin, A. Y.; García-Vidal, F. J.; Martin-Moreno, L. Graphene supports the propagation of subwavelength optical solitons. Laser& Photonics Reviews 2013, 7, L7−L11.
(28) Pusch, A.; Shadrivov, I. V.; Hess, O.; Kivshar, Y. S. Self-focusing of femtosecond surface plasmon polaritons. Opt. Express 2013, 21, 1121−1127.
(29) Zakery, A.; Elliott, S. R. Optical Nonlinearities in Chalcogenide Glasses and their Applications; Springer, 2007.
(30) Chauvet, M.; Fanjoux, G.; Huy, K. P.; Nazabal, V.; Charpentier, F.; Billeton, T.; Boudebs, G.; Cathelinaud, M.; Gorza, S.-P. Kerr spatial solitons in chalcogenide waveguides. Opt. Lett. 2009, 34, 1804−1806.
(31) Kuriakose, T.; Baudet, E.; Halenkovič, T.; Elsawy, M. M.; Němec, P.; Nazabal, V.; Renversez, G.; Chauvet, M. Measurement of ultrafast optical Kerr effect of Ge-Sb-Se chalcogenide slab waveguides by the beam self-trapping technique. Opt. Commun. 2017, 403, 352− 357.
(32) Nazabal, V.; Charpentier, F.; Adam, J.-L.; Nemec, P.; Lhermite, H.; Brandily-Anne, M.-L.; Charrier, J.; Guin, J.-P.; Moreac, A. Sputtering and Pulsed Laser Deposition for Near- and Mid-Infrared
ACS Photonics pubs.acs.org/journal/apchd5 Article
https://dx.doi.org/10.1021/acsphotonics.0c00906 ACS Photonics 2020, 7, 2562−2570
(35) Elsawy, M. M. R.; Renversez, G. Exact calculation of the nonlinear characteristics of 2D isotropic and anisotropic waveguides. Opt. Lett. 2018, 43, 2446−2449.
(36) Oulton, R. F.; Sorger, V. J.; Genov, D. A.; Pile, D. F. P.; Zhang, X. A hybrid plasmonic waveguide for subwavelength confinement and long-range propagation. Nat. Photonics 2008, 2, 496−500.
(37) Elsawy, M. M. R.; Renversez, G. Improved nonlinear slot waveguides using dielectric buffer layers: properties of TM waves. Opt. Lett. 2016, 41, 1542−1545.
(38) Powers, P. E.; Haus, J. W. Fundamentals of Nonlinear Optics, 2nd ed.; CRC Press, 2017.
(39) Kivshar, Y. S.; Agrawal, G. P. Optical Solitons, From Fibers to Photonic Crystals; Academic Press, 2003.
(40) Agrawal, G. P. Nonlinear Fiber Optics, 5th ed.; Academic Press, 2013.
(41) Okamoto, K. In Fundamentals of Optical Waveguides, 2nd ed.; Okamoto, K., Ed.; Academic Press, 2006; pp 209−259.
(42) Kohlgraf-Owens, D. C.; Kik, P. G. Numerical study of surface plasmon enhanced nonlinear absorption and refraction. Opt. Express 2008, 16, 10823−10834.
(43) Malendevich, R.; Jankovic, L.; Stegeman, G.; Aitchison, J. S. Spatial modulation instability in a Kerr slab waveguide. Opt. Lett. 2001, 26, 1879−1881.
(44) Lin, Y.-Y.; Lee, R.-K.; Kivshar, Y. S. Transverse instability of transverse-magnetic solitons and nonlinear surface plasmons. Opt. Lett. 2009, 34, 2982−2984.
(45) Aceves, A. B.; Moloney, J. V.; Newell, A. C. Theory of light-beam propagation at nonlinear interfaces. II. Multiple-particle and multiple-interface extensions. Phys. Rev. A: At., Mol., Opt. Phys. 1989, 39, 1828−1840.
(46) Sánchez-Curto, J.; Chamorro-Posada, P.; McDonald, G. S. Helmholtz bright and black soliton splitting at nonlinear interfaces. Phys. Rev. A: At., Mol., Opt. Phys. 2012, 85, 013836.
(47) Aleshkevich, V. A.; Kartashov, Y. V.; Zelenina, A. S.; Vysloukh, V. A.; Torres, J. P.; Torner, L. Eigenvalue control and switching by fission of multisoliton bound states in planar waveguides. Opt. Lett. 2004, 29, 483−485.
(48) Cambournac, C.; Maillotte, H.; Lantz, E.; Dudley, J. M.; Chauvet, M. Spatiotemporal behavior of periodic arrays of spatial solitons in a planar waveguide with relaxing Kerr nonlinearity. J. Opt. Soc. Am. B 2002, 19, 574−585.
(49) Boudebs, G.; Cherukulappurath, S.; Leblond, H.; Troles, J.; Smektala, F.; Sanchez, F. Experimental and theoretical study of higher-order nonlinearities in chalcogenide glasses. Opt. Commun. 2003, 219, 427−433.
(50) Boyd, R. W.; Shi, Z.; De Leon, I. The third-order nonlinear optical susceptibility of gold. Opt. Commun. 2014, 326, 74−79.
(51) Qian, H.; Xiao, Y.; Liu, Z. Giant Kerr response of ultrathin gold films from quantum size effect. Nat. Commun. 2016, 7, 1−6.
(52) Tuniz, A.; Weidlich, S.; Schmidt, M. A. Effectively Single-Mode Self-Recovering Ultrafast Nonlinear Nanowire Surface Plasmons. Phys. Rev. Appl. 2018, 9, 044012.