HAL Id: halshs-01364464
https://halshs.archives-ouvertes.fr/halshs-01364464v2
Preprint submitted on 19 Oct 2016HAL is a multi-disciplinary open access
archive for the deposit and dissemination of sci-entific research documents, whether they are pub-lished or not. The documents may come from teaching and research institutions in France or abroad, or from public or private research centers.
L’archive ouverte pluridisciplinaire HAL, est destinée au dépôt et à la diffusion de documents scientifiques de niveau recherche, publiés ou non, émanant des établissements d’enseignement et de recherche français ou étrangers, des laboratoires publics ou privés.
Child physical development in the UK: The imprint of
time and socioeconomic status
Bénédicte H. Apouey
To cite this version:
Bénédicte H. Apouey. Child physical development in the UK: The imprint of time and socioeconomic status. 2016. �halshs-01364464v2�
WORKING PAPER N° 2016 – 19
Child physical development in the UK:
The imprint of time and socioeconomic status
Bénédicte H. Apouey
JEL Codes: I14, I18
Keywords: Longitudinal Studies; Inequalities; Socioeconomic Status; Child;
Physical Development
P
ARIS-
JOURDANS
CIENCESE
CONOMIQUES48, BD JOURDAN – E.N.S. – 75014 PARIS
TÉL. : 33(0) 1 43 13 63 00 – FAX : 33 (0) 1 43 13 63 10
www.pse.ens.fr
CENTRE NATIONAL DE LA RECHERCHE SCIENTIFIQUE – ECOLE DES HAUTES ETUDES EN SCIENCES SOCIALES
Child physical development in the UK:
The imprint of time and socioeconomic status
Bénédicte H. Apouey October 2016
Bénédicte H. Apouey
Paris School of Economics – CNRS
Address: 48 Boulevard Jourdan, 75014 Paris, France E-mail : bapouey@psemail.eu
ABSTRACT
Objectives. Social health inequalities remain a key policy challenge. The existing literature has not
presented a synthetic view on the evolution of inequalities in physical development across childhood. We examine social disparities as children grow older using a range of different outcomes.
Study design. Population-based secondary data analysis.
Methods. We employ longitudinal data on British children ages 9 months to 12 years from the
Millennium Cohort Study (N=13,811-18,987) and focus on multiple child physical measures: weight, BMI, overweight, fat mass, and waist circumference.
Results. Higher family income is associated with lower BMI (for females), less body fat, and a
smaller likelihood of overweight (for both genders) on average throughout childhood. When income is multiplied by three, the probability of overweight decreases by 2.8 (95% CI -0.041 to -0.016) percentage points for females and by 2.7 (95% CI -0.038 to -0.016) percentage points for males. Social inequalities in weight, BMI, overweight, and body fat significantly widen as children grow older, for both genders. For instance, for females, when income is multiplied by three, the probability of overweight decreases by 1.6 (95% CI -0.032 to -0.000) percentage points at ages 2-3, but by 8.6 (95% CI -0.112 to -0.060) percentage points at ages 10-12.
Conclusions. The trajectory of social inequalities, which may reflect the cumulative effect of family
socioeconomic status, is a precursor of inequalities in adulthood.
Keywords: Longitudinal Studies; Inequalities; Socioeconomic Status; Child; Physical Development.
INTRODUCTION
Family socioeconomic status (SES) is associated with an increased risk of overweight and obesity in childhood.1–6 But little is known about the emergence and evolution of inequalities in physical outcomes as children grow older. Because physical measures develop over long periods, we may expect that the effect of SES be cumulative, which would mean that association between SES and development would strengthen with age. However, it is possible that inequalities remain stable or even decrease during childhood, for instance if the effect of peers at school, youth culture, and social norms cut across the influence of the family.7,8 Knowing the ages at which the slope of gradient changes is important because it suggests an optimal age at which policies tackling inequalities should be implemented. The current analysis contributes to this line of research by examining the evolution of the gradient in child physical development across childhood in the UK.
Evidence on the shape of the development gradient is limited and results are inconsistent. In British cohort data (from the Avon Longitudinal Study of Parents and Children -- ALSPAC) that follows children from birth to age 15, the maternal education gradient in total fat mass remains flat across childhood, whereas the gradient in height increases with age, for both females and males.9 Using French cross-sectional and longitudinal data for children ages 0-17, a recent article finds that the trajectory of the family SES (parents’ education, household income) gradient in BMI and overweight follows an inverted U-shape: inequalities increase from birth to age 8, and decrease between 8 and 17.10 Results for the US seem somewhat contradictory. Indeed, employing cross-sectional data on children ages 2-19, a study finds that the association between income (measured by the poverty-to-income ratio) and obesity is stable with age,11 whereas using longitudinal data on children ages 6 to 14, another article suggests that the impact of (the log of) income on BMI decreases with age.12 Finally, in a US cohort of individuals transitioning from early to middle adulthood, the maternal education gradient in offspring BMI and obesity widens with age for both females and males.13
The trajectory of the physical development gradient across childhood thus remains unclear. Differences between study findings may be explained by differences in countries (social norms and health care systems in particular) and child age ranges, but also by differences in methods. Indeed, some studies do not disentangle the cohort effect (i.e. the effect related to the year of birth) from the age effect, so that the estimated “age effect” is obscured by cohort effects. In addition, these studies do not use the same development outcomes and SES variables, which could also explain why they reach different conclusions. On a related matter, most articles do not take a unified approach on the shape of the development gradient, since they employ a limited number of physical development outcomes and SES variables.
Our goal here is to provide a general view of the evolution of socioeconomic differences in physical development with age in the UK. We rely on cohort data that follows the lives of children born in 2000-2002. For this reason, the age effects we capture are not obscured by cohort effects. We focus on a number of physical measures, more precisely the gender- and age-adjusted weight, body mass index (BMI), overweight, fat mass, and waist circumference. We employ several SES variables, namely family income in the main analysis, and maternal and paternal education in the sensitivity analysis.
METHODS
Data
The Millennium Cohort Study (MCS) is a research project following a sample of around 19,000 children born in the early 2000s in the UK.14 Births happened over 12 months from 1 September 2000 in England and Wales and from 1 December 2000 in Scotland and Northern Ireland. The data are representative of all four UK countries. There have been five waves of the study so far, at 0-1 year, 2-3 years, 4-5 years, 6-8 years, and 10-12 years. We use all available waves, and the analysis sample contains children who have data at, at least, one point in time. The impact of attrition on the findings is discussed below.
Child physical development measures
The MCS contains information on the following physical development variables: weight, height, body fat mass, and waist circumference. Body fat mass is a measure of overall fat, whereas waist circumference, of central fat in the body. The measures are taken by trained interviewers. Weight and percentage fat mass are measured using the Tanita HD-305 or BF-522W scales, height using a Leicester stadiometer, and waist circumference using a SECA tape calibrated in millimetres. Weight is measured at each wave, but the other outcomes are not: body fat is measured in waves 4 and 5, and waist circumference in waves 3 and 4. BMI is calculated using the height and weight measures and is available in waves 2 to 5.
Using these pieces of information as well as child gender and age in months, we derive the gender- and age-adjusted weight-, BMI-, body fat-, and waist-for-age z-scores, employing the “zanthro” Stata function with the British 1990 growth chart.15 This enables us to obtain comparable values across sexes and ages. We complement these variables with a dichotomic variable for whether the child is overweight (including obese). This dummy is created using the “zbmicat” Stata function, which
employs the BMI cutoffs recommended by the Childhood Obesity Working Group of the International Obesity Taskforce (IOTF).
Socioeconomic status
Our main SES measure is weekly family income. Income is adjusted for household size and composition using the modified Organisation for Economic Cooperation and Development (OECD) equivalence scale.1 Income is also adjusted for inflation using the consumer price index available from the Office for National Statistics.2 We use the logarithm of income to account for nonlinearities. Our conclusions are robust to sensitivity analysis for different SES variables (maternal of paternal education).
Statistical methods
We estimate several regression models to examine the average slope of the gradient during childhood, the gradient at each age, and the evolution of the gradient across childhood. First, to quantify the mean level of inequalities during childhood, we regress physical development outcomes on SES (the logarithm of income) and control variables. The model is adjusted for the following variables: a series of dummies for child age (in months),3 dummies for whether the child is from a multiple birth (twins and triplets), the mother’s age, a dummy for the presence of the father in the household, the father’s age interacted with his presence, household size, and year dummies.
Second, we explore the existence of inequalities at each age. Specifically, we quantify the level of inequalities at each age and test whether this level is statistically significant from zero. We thus regress child outcomes on interaction terms between SES and child age group, and covariates. For instance, the data contain information on weight-for-age for five age groups (0-1 year, 2-3, 4-5, 6-8, and 10-12 years), so the regression for weight-for-age includes five interaction terms. We graph the coefficient on the interaction terms as a function of child age group, and show the 90% confidence interval of the coefficient. This approach quantifies the slope of inequalities for each age group, but does not test whether changes in inequalities across childhood are statistically significant.
Third, we check whether the evolution of inequalities as children grow older is significant. We regress child outcomes on SES and a series of interaction terms between SES and child age group, excluding
1
The scale weights the first adult as 0.67, the second adult and each child over 14 as 0.33, and each child under 14 as 0.20.
2 2015 is our reference year. See http://www.ons.gov.uk/economy/inflationandpriceindices/timeseries/d7bt. 3 Given than the evolution of physical outcomes is non-linear across childhood, using age dummies is more
the interaction term between SES and child ages 6-8 -- this interaction is our reference category (covariates are included). We suppose that our outcome of interest is weight-for-age and that the coefficient on SES is negative, which means that income is negatively correlated with weight for the reference age group (ages 6-8). If the interaction term between SES and age 10-12 years is negative, then the effect of SES on weight-for-age is significantly greater (in absolute value) at ages 10-12 than at ages 6-8, which implies that inequalities in weight widen between ages 6-8 and 10-12. We plot the coefficients on the interaction terms as a function of age groups, as well as their confidence intervals. See supplementary material S1 for details about the regression models.
An alternative model would regress child outcome on SES, an interaction term between SES and child age (which would be a continuous variable), and controls.13 However, this approach would assume that the evolution of the gradient is linear across childhood, which is not true in our sample -- see our results below.
The regression models are estimated using ordinary least squares (OLS), clustering standard errors at the child level to account for multiple observations per child. For overweight, which is a dummy variable, we thus use a linear probability model. The analyses are conducted in Stata Version 11.
RESULTS
Sample characteristics
The mean equivalised income is £460.52. The data contain information on weight-for-age for all age groups, on BMI-for-age and overweight at ages 2-3, 4-5, 8, and 10-12, on body fat-for-age at ages 6-8 and 10-12, and on waist-for-age at ages 4-5 and 6-6-8. Sample size varies from 23,755 (body fat) to 68,013 (weight) (Table 1).
[Insert Table 1 here]
The mean level of disparities
We first quantify the mean level of disparities during childhood, separately by gender. Table 2 reports the coefficients on the logarithm of income. Females coming from higher-SES families have a greater weight score, and males from higher-SES background both have a greater weight and waist scores. In contrast, children from highier-income families are healthier in terms of BMI (for females),
overweight, and body fat (for both genders). When income is multiplied by three approximately,4 the probability of overweight decreases by 2.8 (95% CI -0.041 to -0.016) percentage points among females and by 2.7 (95% CI -0.038 to -0.016) percentage points among males. The gradients in BMI, overweight, and body fat have the same magnitude for both genders.
[Insert Table 2 here]
Existence of health inequalities at each age
To examine the existence of health inequalities at each age, we include a complete series of interaction terms between SES and age groups in our regression models. Figure 1 represents the coefficients on these interaction terms as a function of age, their 90% confidence intervals, and a smoothing. Each graph corresponds to a child development outcome; graphs on the left hand side are for females, whereas those on the right hand side are for males. When the lower (respectively upper) bound of a confidence interval is above (resp. below) the horizontal zero line for some age group, there is a positive (resp. negative) and significant association between income and child development variable for that age group.
For both genders, the association between income and weight goes from positive in early childhood to negative in late childhood, so that at ages 10-12, children lower-income families are significantly heavier -- their weight-for-age score is larger. After a period with no social difference in early childhood, inequalities in BMI emerge starting ages 4-5 for females and 6-8 for males. In addition, higher income is significantly associated with a smaller probability of overweight for females starting ages 2-3 and for males starting 4-5. Similarly, higher income is associated with less body fat for females and males, for both age groups for which information on this outcome is available. Finally, income is positively correlated with waist circumference at ages 4-5, but the association disappears at ages 6-8, for both sexes.
[Insert Figure 1 here]
Figure 1 suggests that socioeconomic inequalities in weight, BMI, overweight and body fat strengthen as children get older. For instance, for females, when income is multiplied by 2.7, the probability of overweight decreases by 1.6 percentage points (95% CI -0.032 to -0.000) at ages 2-3, but by 8.6 (95% CI -0.112 to -0.060) percentage points at ages 10-12. For males, for the same increase in income, the
4
probability of overweight decreases by 1.1 percentage points (95% CI -0.026 to 0.003) at ages 2-3, but by 10.4 percentage points (95% CI -0.128 to -0.079) at ages 10-12.
Evolution of inequalities with age
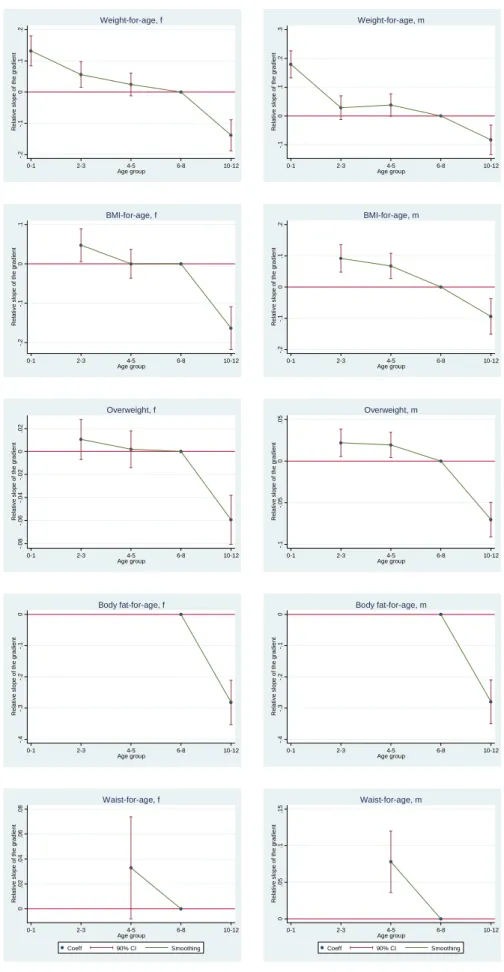
We test whether this trajectory of the gradient across childhood is statistically significant, by comparing the slope of the gradient for a specific age group with its slope at ages 6-8. We use interaction terms between SES and child age groups, and children ages 6-8 serve as our reference category. Figure 2 represents the coefficients on the interaction terms as a function of age, their 90% confidence intervals, and a smoothing. When the lower (respectively upper) bound of a confidence interval is above (resp. below) the horizontal zero line for some age group, the association between income and the outcome is greater (resp. smaller) for children of that age group than for children ages 6-8.
The effect of income on weight score at ages 10-12 is significantly stronger than at ages 6-8, which supports our previous finding on the emergence of social disparities in weight in late childhood. Inequalities in BMI and overweight widen as children grow older: indeed, the correlation between income and BMI and overweight continuously strengthens between ages 2-3 and 10-12, for both genders. Similarly, inequalities in body fat strengthen between ages 4-5 and 6-8. Differences in waist remain stable for females and decrease for males.
[Insert Figure 2 here]
Sensitivity analysis
Changes in the sample size and composition may have an impact on the evolution of inequalities with age. In particular, the number of observations varies across waves. To explore the consequences of missing data, we re-estimate our models restricting the sample to individuals with complete data at all waves for a given outcome. The results support our previous findings on the existence of inequalities favouring high-income children, for weight (at ages 10-12), BMI (from 6-8 to 10-12), overweight (starting 4-5) and body fat (at 6-8 and 10-12). The findings also suggest that disparities in these outcomes strengthen as children grow older. Like in our main analysis, we also find that there is no social difference in waist-for-age at ages 6-8. See supplementary material, Table S2 and Figure S3.
We also check the robustness of our findings by re-estimating our models but accounting for child fixed characteristics (such as ethnicity and cultural background). We thus run our regressions on the existence of inequalities at each age including child fixed effects. By construction, these models are
estimated for the sample of children who are observed at least at two points in time. The findings are consistent with a steepening of the gradient in weight, BMI, overweight and body fat with age. In addition, and in contrast with Figure 1, we find some evidence that income-related inequalities in waist emerge between ages 4-5 and 6-8 for males. See supplementary material, Figure S4.
Our results are also robust to sensitivity analysis for different ways of measuring SES. Specifically, we use the mother’s or the father’s education (the age at which they left full-time education). The results are still consistent with an increase in inequalities across childhood for all outcomes except waist-for-age. See supplementary material, Figures S5 and S6.
DISCUSSION
This article investigates whether family SES is associated with child physical measurements and whether this association changes as children get older for a cohort of British children. The key strength of this study is our unified approach to assess the trajectory of the gradient, since we focus on a range of physical development and SES variables. Inequalities are established in childhood, since significant inequalities are found in overweight and body fat-for-age for both genders, and in BMI-for-age for females. Social disparities in BMI, overweight, and body fat have the same magnitude between sexes. Interestingly, social differences in most body size measures markedly increase as children get older. This result is also found when we employ alternative SES variables. The widening of inequalities may reflect either the cumulative effect of family SES on child physical development, or an increase in the contemporaneous effect of SES as children grow older, or unrealized latent effects that do not appear until children are older.
Our findings on the widening of inequalities in the UK are consistent with previous evidence. Indeed, the maternal education gradients in offspring obesity and (unadjusted) BMI increase with age in the US for both females and males.13 Using data on reported height and weight, it has also been shown that social disparities in child BMI and overweight increase from birth to age 8 and then decrease afterward in France. Our results for the UK are thus consistent with the trajectory in early childhood in France. While we use measured physical outcomes, the study for France employs reported data, which capture subjective perceptions on body size and may be biased. This bias likely depends on family SES and child age, which could explain why our findings are different for children above 8.10
More generally, our findings are also in line with some results on the trajectory of the gradient in general health throughout childhood.5 In particular, studies highlight that the gradient in family income
5
and child subjective general health increases with age in the USA,16,17 Canada,18 and France.19 In contrast, our results are at odd with recent results on subjective general health for the UK which highlight that social inequalities in health remain constant with age.9,20,21 However changes in the health gradient in the UK are still debated.22,23 Moreover, we need to be ready for the possibility that the trajectory of the gradient in objective physical measures and subjective general health be different.
Our results should be interpreted in light of several limitations. First, we describe the evolution of the gradient for one specific cohort of children. These children grew up in a particular policy context: starting 1999, child health featured highly on the Labour administration’s political agenda, and the MCS children were born at the start of concerted policy efforts by the Labour government to reduce health inequalities.24 For this reason, it is unclear whether our findings apply to other generations and other European countries. Second, this paper quantifies the correlation between family SES and child body size outcomes, but does not evaluate the causal impact of SES on outcomes.25 Third, our data do not contain information on outcomes for children of all ages, so that the trajectories we describe are not complete – in particular, body fat and waist are only measured at two points in time.
Finally, our article does not give a broad overview of the role of different factors to predict child development -- this would be an entire new study in and of itself. Indeed, we focus on two measures of family SES (family income and parental education), adjusting for a small number of child and household characteristics. In particular, our analysis does not take physical activity, sedentary time, and feeding practices into account, although they are major determinants of some child development outcomes: physical activity reduces child fat mass,26 while an “low-energy-dense, low fat, high fiber” dietary pattern is negatively associated with fat mass among British children.27 As far as schooling is concerned, our approach does not explore the role of programs related to physical activity and diet in schools. There is some evidence that they are insufficient by themselves to fight overweight in children, but that they have an effect when they are part of broader intervention policies.28 Our study does not precisely examine the role of family structure and functioning either, although studies have found that child overweight is more prevalent among children of divorced parents29 and that poor family functioning (poor communication, poor behavior control, and family conflicts) is correlated with increased risk of child overweight.30 Moreover, given that the perception of healthy growth may differ between cultures and may have an effect on feeding practices, a comprehensive study should also take family cultural background into account.31–33 Note also that parental overweight and high birth weight are significant determinants of child overweight.34As far as SES is concerned, in addition to family income and parents’ education, parental literacy could also be used as a SES indicator -- we expect literacy to be positively associated with child healthy development. On a related matter, parental health literacy and numeracy also predict development: higher health literacy decreases the odds of obesity,35 while lower numeracy is associated with having a child who is either underweight or
overweight.36 In addition to family-level characteristics and SES, area-level factors may have an independent effect on child physical development. For instance, urbanization level is positively associated with child adiposity,37 while neighborhood socioeconomic disadvantage increases child adiposity and obesity.38–40 Interestingly, the effect of SES on child development might be different depending on the geographical environment: comparing the effect of family- and district-level SES on child overweight in suburban, urban, and highly urban districts, studies indicate that SES is associated with childhood overweight in more urbanized areas, but not in suburban areas.41,42 Accounting for all of these factors in our analysis may change the size of the coefficients on family SES, if the factors are correlated not only with child development but also with family SES. Note however that our fixed effect model already takes into account factors that remain constant over time (such as family cultural background, or urbanicity for families which do not move).
Our study highlights that the relationship between family SES and child physical outcomes is generally significant and increases with age. Several potential mechanisms may underlie this association: physical activity, dietary patterns, cultural background, and physical and social environment are undoubtedly relevant explanations. Further research exploring the role of these factors for low and high-SES families could help establish why social inequalities exist and strengthen in the early years. This could contribute to the design of policies reducing health disparities more effectively.
Acknowledgements. We thank Pierre-Yves Geoffard and an anonymous referee for helpful
comments. This research did not receive any specific grant from funding agencies in the public, commercial, or not-for-profit sectors.
Funding: None.
Competing interests: None declared.
Ethical approval: This study involves secondary analysis of publicly available data. Ethics approval
TABLES AND FIGURES
Table 1. Distributions of physical outcomes at each age
Wave 1 Wave 2 Wave 3 Wave 4 Wave 5 Observations Individuals Age group 0-1 year 2-3 years 4-5 years 6-8 years 10-12 years (at least one (at least one Mean age 9 months 3 years 5 years 7 years 11 years measure) measure)* Weight-for-age (SD) -0.49 (1.36) 0.33 (1.10) 0.32 (1.08) 0.32 (1.03) 0.53 (1.12) 68,013 18,987 BMI-for-age (SD) - 0.48 (1.06) 0.44 (1.05) 0.35 (1.05) 0.54 (1.22) 49,730 16,679 Overweight (SD) - 0.23 (0.42) 0.21 (0.40) 0.19 (0.39) 0.27 (0.44) 49,787 16,679 Body fat-for-age (SD) - - - 0.41 (1.10) 0.01 (1.53) 23,755 14,314 Waist-for-age (SD) - - 0.56 (1.11) 0.68 (0.99) - 23,778 13,811 Notes. *This is the number of children with one or more measures at any age.
Table 2. The average level of social inequalities in childhood
Females Males p for
gender Coeff. 95% CI Coeff. 95% CI difference
Panel A. Weight-for-age Ln(income) 0.058 (0.026 to 0.090) 0.087 (0.057 to 0.118) 0.060 Observations 33,525 34,488 Panel B. BMI-for-age Ln(income) -0.040 (-0.074 to -0.005) -0.026 (-0.059 to 0.008) 0.177 Observations 24,619 25,111 Panel C. Overweight Ln(income) -0.028 (-0.041 to -0.016) -0.027 (-0.038 to -0.016) 0.676 Observations 24,642 25,145
Panel D. Body fat-for-age
Ln(income) -0.242 (-0.304 to -0.180) -0.216 (-0.267 to -0.165) 0.305
Observations 11,781 11,974
Panel E. Waist-for-age
Ln(income) 0.037 (-0.004 to 0.078) 0.050 (0.010 to 0.090) 0.050
Observations 11,704 12,074
Figure 1. Existence of inequalities at each age
Notes. Covariates are included.
-. 2 -. 1 0 .1 .2 S lo p e o f th e g ra d ie n t 0-1 2-3 4-5 6-8 10-12 Age group Weight-for-age, f -. 1 0 .1 .2 .3 S lo p e o f th e g ra d ie n t 0-1 2-3 4-5 6-8 10-12 Age group Weight-for-age, m -. 3 -. 2 -. 1 0 .1 S lo p e o f th e g ra d ie n t 0-1 2-3 4-5 6-8 10-12 Age group BMI-for-age, f -. 2 -. 1 0 .1 S lo p e o f th e g ra d ie n t 0-1 2-3 4-5 6-8 10-12 Age group BMI-for-age, m -. 1 -. 0 8 -. 0 6 -. 0 4 -. 0 2 0 S lo p e o f th e g ra d ie n t 0-1 2-3 4-5 6-8 10-12 Age group Overweight, f -. 1 5 -. 1 -. 0 5 0 S lo p e o f th e g ra d ie n t 0-1 2-3 4-5 6-8 10-12 Age group Overweight, m -. 5 -. 4 -. 3 -. 2 -. 1 0 S lo p e o f th e g ra d ie n t 0-1 2-3 4-5 6-8 10-12 Age group Body fat-for-age, f -. 5 -. 4 -. 3 -. 2 -. 1 0 S lo p e o f th e g ra d ie n t 0-1 2-3 4-5 6-8 10-12 Age group Body fat-for-age, m -. 0 5 0 .0 5 .1 S lo p e o f th e g ra d ie n t 0-1 2-3 4-5 6-8 10-12 Age group Coeff 90% CI Smoothing Waist-for-age, f -. 0 5 0 .0 5 .1 .1 5 S lo p e o f th e g ra d ie n t 0-1 2-3 4-5 6-8 10-12 Age group Coeff 90% CI Smoothing Waist-for-age, m
Figure 2. Evolution of inequalities across childhood
Notes. Covariates are included.
-. 2 -. 1 0 .1 .2 R e la ti v e s lo p e o f th e g ra d ie n t 0-1 2-3 4-5 6-8 10-12 Age group Weight-for-age, f -. 1 0 .1 .2 .3 R e la ti v e s lo p e o f th e g ra d ie n t 0-1 2-3 4-5 6-8 10-12 Age group Weight-for-age, m -. 2 -. 1 0 .1 R e la ti v e s lo p e o f th e g ra d ie n t 0-1 2-3 4-5 6-8 10-12 Age group BMI-for-age, f -. 2 -. 1 0 .1 .2 R e la ti v e s lo p e o f th e g ra d ie n t 0-1 2-3 4-5 6-8 10-12 Age group BMI-for-age, m -. 0 8 -. 0 6 -. 0 4 -. 0 2 0 .0 2 R e la ti v e s lo p e o f th e g ra d ie n t 0-1 2-3 4-5 6-8 10-12 Age group Overweight, f -. 1 -. 0 5 0 .0 5 R e la ti v e s lo p e o f th e g ra d ie n t 0-1 2-3 4-5 6-8 10-12 Age group Overweight, m -. 4 -. 3 -. 2 -. 1 0 R e la ti v e s lo p e o f th e g ra d ie n t 0-1 2-3 4-5 6-8 10-12 Age group Body fat-for-age, f -. 4 -. 3 -. 2 -. 1 0 R e la ti v e s lo p e o f th e g ra d ie n t 0-1 2-3 4-5 6-8 10-12 Age group Body fat-for-age, m 0 .0 2 .0 4 .0 6 .0 8 R e la ti v e s lo p e o f th e g ra d ie n t 0-1 2-3 4-5 6-8 10-12 Age group Coeff 90% CI Smoothing Waist-for-age, f 0 .0 5 .1 .1 5 R e la ti v e s lo p e o f th e g ra d ie n t 0-1 2-3 4-5 6-8 10-12 Age group Coeff 90% CI Smoothing Waist-for-age, m
ONLINE-ONLY SUPPLEMENTARY MATERIAL Material S1. Regression models
We estimate several regression models to examine the average size of the gradient during childhood, the gradient at each age, and the evolution of the gradient across childhood.
Average level of inequalities during childhood
First, to quantify the mean level of inequalities during childhood, we estimate the following regression model:
Yit = α + SESit β + Xit ζ + εit (1)
where Y is the physical development outcome, SES represents the logarithm of income, and X are the control variables.
Existence of inequalities at each age
Second, we check whether income is correlated with physical outcome at each age, using the following regression:
Yit = α + SESit×1(0-1)it β0-1 + SESit×1(2-3)it β2-3 + SESit×1(4-5)it β4-5 + SESit×1(6-8)it β6-8
+ SESit×1(10-12)it β10-12 + Xit ζ + εit (2)
where 1(0-1) is a dummy variable that equals 1 if the child is 0-1 year old, and 0 otherwise. Similarly,
1(2-3), 1(4-5), 1(6-8), and 1(10-12) are dummy variables that equal 1 if the child is 2-3, 4-5, 6-8, and 10-12
years old. SES×1(0-1), SES×1(2-3), SES×1(4-5), SES×1(6-8), and SES×1(Age 10-12) are interaction terms
between SES and age groups. δ0-1 thus captures the effect of SES on child physical outcome at ages
0-1. If β0-1 is positive (respectively negative) and significantly different from zero, then the effect of SES
on child development at ages 0-1 is positive (resp. negative) and significant. β2-3, β4-5, β6-8, and β10-12
are defined in the same way. In Figures 1, S3, S4, S5, and S6, we graph β0-1, β2-3, β4-5, β6-8, and β10-12 as
a function of child age group, together with their 90% confidence intervals. This approach quantifies the slope of inequalities for each age group, but does not test whether changes in inequalities across childhood are statistically significant.
Evolution of inequalities across childhood
We check whether the evolution of inequalities across childhood is significant employing the following model:
Yit = α + SESit β + SESit×1(0-1)it δ0-1 + SESit×1(2-3)it δ2-3 + SESit×1(4-5)it δ4-5 + SESit×1(10-12)it δ10-12
+ Xit ζ + εit (3)
where β captures the main effect of SES. In the series of interaction terms, children ages 6-8 serve as the reference category, so δ6-8 is set to 0. δ0-1 captures the effect of SES on the child physical outcome
at ages 0-1, compared with its effect at ages 6-8. If δ0-1 is positive (resp. negative) and significant, then
the effect of SES on child development at ages 0-1 is greater (resp. smaller) than at ages 6-8. Similarly, δ2-3, δ4-5, and δ10-12 capture the effect of SES on the child physical outcome at ages 2-3, 4-5,
and 10-12, compared with its effect at ages 6-8. In Figure 2, we plot δ0-1, δ2-3, δ4-5, and δ10-12 as a
ONLINE-ONLY SUPPLEMENTARY MATERIAL
Table S2. Number of observations at each wave
Wave 1 Wave 2 Wave 3 Wave 4 Wave 5 Age group 0-1 2-3 4-5 6-8 10-12 Weight-for-age 17,703 13,062 13,137 11,074 13,037 BMI-for-age - 12,797 13,113 10,788 13,032 Overweight - 12,823 13,136 10,791 13,037 Body fat-for-age - - - 10,958 12,797 Waist-for-age - - 13,043 10,735 -
Notes. The table reports the number of observations we use in the main analysis. At wave 4, the number of observations is smaller than in other waves. Indeed, in that wave, the data contain information on “measurement circumstances” which enables us to eliminate observations for which measurement is not perfectly clean. See the MCS user guide.
ONLINE-ONLY SUPPLEMENTARY MATERIAL
Figure S3. Existence of inequalities at each age, for children with complete data at all waves
Notes. SES variable is family income. Covariates are included.
-. 3 -. 2 -. 1 0 .1 .2 S lo p e o f th e g ra d ie n t 0-1 2-3 4-5 6-8 10-12 Age group Weight-for-age, f -. 2 -. 1 0 .1 .2 S lo p e o f th e g ra d ie n t 0-1 2-3 4-5 6-8 10-12 Age group Weight-for-age, m -. 4 -. 3 -. 2 -. 1 0 .1 S lo p e o f th e g ra d ie n t 0-1 2-3 4-5 6-8 10-12 Age group BMI-for-age, f -. 3 -. 2 -. 1 0 .1 S lo p e o f th e g ra d ie n t 0-1 2-3 4-5 6-8 10-12 Age group BMI-for-age, m -. 1 5 -. 1 -. 0 5 0 S lo p e o f th e g ra d ie n t 0-1 2-3 4-5 6-8 10-12 Age group Overweight, f -. 1 5 -. 1 -. 0 5 0 S lo p e o f th e g ra d ie n t 0-1 2-3 4-5 6-8 10-12 Age group Overweight, m -. 5 -. 4 -. 3 -. 2 -. 1 0 S lo p e o f th e g ra d ie n t 0-1 2-3 4-5 6-8 10-12 Age group Body fat-for-age, f -. 5 -. 4 -. 3 -. 2 -. 1 0 S lo p e o f th e g ra d ie n t 0-1 2-3 4-5 6-8 10-12 Age group Body fat-for-age, m -. 0 5 0 .0 5 .1 .1 5 S lo p e o f th e g ra d ie n t 0-1 2-3 4-5 6-8 10-12 Age group Coeff 90% CI Smoothing Waist-for-age, f -. 0 5 0 .0 5 .1 .1 5 .2 S lo p e o f th e g ra d ie n t 0-1 2-3 4-5 6-8 10-12 Age group Coeff 90% CI Smoothing Waist-for-age, m
ONLINE-ONLY SUPPLEMENTARY MATERIAL
Figure S4. Existence of inequalities at each age, accounting for child fixed effects
Notes. SES variable is family income. Covariates are included.
-. 3 -. 2 -. 1 0 .1 .2 S lo p e o f th e g ra d ie n t 0-1 2-3 4-5 6-8 10-12 Age group Weight-for-age, f -. 3 -. 2 -. 1 0 .1 .2 S lo p e o f th e g ra d ie n t 0-1 2-3 4-5 6-8 10-12 Age group Weight-for-age, m -. 3 -. 2 -. 1 0 .1 S lo p e o f th e g ra d ie n t 0-1 2-3 4-5 6-8 10-12 Age group BMI-for-age, f -. 2 -. 1 0 .1 S lo p e o f th e g ra d ie n t 0-1 2-3 4-5 6-8 10-12 Age group BMI-for-age, m -. 1 -. 0 8 -. 0 6 -. 0 4 -. 0 2 0 S lo p e o f th e g ra d ie n t 0-1 2-3 4-5 6-8 10-12 Age group Overweight, f -. 1 5 -. 1 -. 0 5 0 S lo p e o f th e g ra d ie n t 0-1 2-3 4-5 6-8 10-12 Age group Overweight, m -. 2 -. 1 0 .1 S lo p e o f th e g ra d ie n t 0-1 2-3 4-5 6-8 10-12 Age group Body fat-for-age, f -. 2 -. 1 0 .1 S lo p e o f th e g ra d ie n t 0-1 2-3 4-5 6-8 10-12 Age group Body fat-for-age, m -. 0 5 0 .0 5 .1 S lo p e o f th e g ra d ie n t 0-1 2-3 4-5 6-8 10-12 Age group Coeff 90% CI Smoothing Waist-for-age, f -. 1 -. 0 5 0 .0 5 .1 S lo p e o f th e g ra d ie n t 0-1 2-3 4-5 6-8 10-12 Age group Coeff 90% CI Smoothing Waist-for-age, m
ONLINE-ONLY SUPPLEMENTARY MATERIAL
Figure S5. Existence of maternal education inequalities at each age
Notes. SES variable is the mother’s education (the age at which she left full-time education). Covariates are included.
-. 0 4 -. 0 2 0 .0 2 S lo p e o f th e g ra d ie n t 0-1 2-3 4-5 6-8 10-12 Age group Weight-for-age, f -. 0 1 0 .0 1 .0 2 .0 3 S lo p e o f th e g ra d ie n t 0-1 2-3 4-5 6-8 10-12 Age group Weight-for-age, m -. 0 5 -. 0 4 -. 0 3 -. 0 2 -. 0 1 0 S lo p e o f th e g ra d ie n t 0-1 2-3 4-5 6-8 10-12 Age group BMI-for-age, f -. 0 3 -. 0 2 -. 0 1 0 .0 1 S lo p e o f th e g ra d ie n t 0-1 2-3 4-5 6-8 10-12 Age group BMI-for-age, m -. 0 2 -. 0 1 5 -. 0 1 -. 0 0 5 0 S lo p e o f th e g ra d ie n t 0-1 2-3 4-5 6-8 10-12 Age group Overweight, f -. 0 1 5 -. 0 1 -. 0 0 5 0 .0 0 5 S lo p e o f th e g ra d ie n t 0-1 2-3 4-5 6-8 10-12 Age group Overweight, m -. 0 6 -. 0 5 -. 0 4 -. 0 3 -. 0 2 -. 0 1 0 S lo p e o f th e g ra d ie n t 0-1 2-3 4-5 6-8 10-12 Age group Body fat-for-age, f -. 0 5 -. 0 4 -. 0 3 -. 0 2 -. 0 1 0 S lo p e o f th e g ra d ie n t 0-1 2-3 4-5 6-8 10-12 Age group Body fat-for-age, m -. 0 2 5 -. 0 2 -. 0 1 5 -. 0 1 -. 0 0 5 0 S lo p e o f th e g ra d ie n t 0-1 2-3 4-5 6-8 10-12 Age group Coeff 90% CI Smoothing Waist-for-age, f -. 0 1 5 -. 0 1 -. 0 0 5 0 .0 0 5 .0 1 S lo p e o f th e g ra d ie n t 0-1 2-3 4-5 6-8 10-12 Age group Coeff 90% CI Smoothing Waist-for-age, m
ONLINE-ONLY SUPPLEMENTARY MATERIAL
Figure S6. Existence of paternal education inequalities at each age
Notes. The SES variable is the father’s education (the age at which he left full-time education). Covariates are included.
-. 0 4 -. 0 3 -. 0 2 -. 0 1 0 .0 1 S lo p e o f th e g ra d ie n t 0-1 2-3 4-5 6-8 10-12 Age group Weight-for-age, f -. 0 3 -. 0 2 -. 0 1 0 .0 1 S lo p e o f th e g ra d ie n t 0-1 2-3 4-5 6-8 10-12 Age group Weight-for-age, m -. 0 5 -. 0 4 -. 0 3 -. 0 2 -. 0 1 0 S lo p e o f th e g ra d ie n t 0-1 2-3 4-5 6-8 10-12 Age group BMI-for-age, f -. 0 5 -. 0 4 -. 0 3 -. 0 2 -. 0 1 0 S lo p e o f th e g ra d ie n t 0-1 2-3 4-5 6-8 10-12 Age group BMI-for-age, m -. 0 2 -. 0 1 5 -. 0 1 -. 0 0 5 0 S lo p e o f th e g ra d ie n t 0-1 2-3 4-5 6-8 10-12 Age group Overweight, f -. 0 2 -. 0 1 5 -. 0 1 -. 0 0 5 0 S lo p e o f th e g ra d ie n t 0-1 2-3 4-5 6-8 10-12 Age group Overweight, m -. 0 6 -. 0 5 -. 0 4 -. 0 3 -. 0 2 -. 0 1 0 S lo p e o f th e g ra d ie n t 0-1 2-3 4-5 6-8 10-12 Age group Body fat-for-age, f -. 0 6 -. 0 5 -. 0 4 -. 0 3 -. 0 2 -. 0 1 0 S lo p e o f th e g ra d ie n t 0-1 2-3 4-5 6-8 10-12 Age group Body fat-for-age, m -. 0 2 5 -. 0 2 -. 0 1 5 -. 0 1 -. 0 0 5 0 S lo p e o f th e g ra d ie n t 0-1 2-3 4-5 6-8 10-12 Age group Coeff 90% CI Smoothing Waist-for-age, f -. 0 2 5 -. 0 2 -. 0 1 5 -. 0 1 -. 0 0 5 0 S lo p e o f th e g ra d ie n t 0-1 2-3 4-5 6-8 10-12 Age group Coeff 90% CI Smoothing Waist-for-age, m
REFERENCES
1. Brophy S, Cooksey R, Gravenor MB, Mistry R, Thomas N, Lyons RA, Williams R. Risk factors for childhood obesity at age 5: Analysis of the Millennium Cohort Study.
BMC Public Health. 2009;9:467.
2. Costa-Font J, Gil J. Intergenerational and socioeconomic gradients of child obesity. Soc
Sci Med. 2013;93:29-37.
3. Hawkins SS, Cole TJ, Law C. The Millenium Cohort Study Child Health Group. Maternal employment and early childhood overweight: Findings from the UK Millenium Cohort Study. Int J Obes. 2008;32:30-38.
4. Lifestyles Statistics Team. National Child Measurement Programme: England,
2014/15 School Year. London; 2015.
5. Ng Fat L. Children’s body mass index, overweight and obesity. In: HSE 2014. London:
Health and Social Care Information; 2015.
6. Apouey BH, Geoffard P-Y. Le gradient et la transmission intergénérationnelle de la santé pendant l’enfance. Economie et Statistique. 2015;475-476:113-133.
7. West P. Health inequalities in the early years: Is there equalisation in youth? Soc Sci
Med. 1997;44(6):833-858.
8. West P, Sweeting H. Evidence on equalisation in health in youth from the West of Scotland. Soc Sci Med. 2004;59(1):13-27.
9. Howe LD, Lawlor DA, Propper C. Trajectories of socioeconomic inequalities in health,
behaviours and academic achievement across childhood and adolescence. J Epidemiol
Community Health. 2013;67:358-364.
10. Apouey BH, Geoffard P-Y. Parents’ education and child body weight in France: The trajectory of the gradient in the early years. Econ Hum Biol. 2016;20:70-89.
11. Murasko JE. Socioeconomic status, height, and child obesity. Econ Hum Biol. 2009;7(3):376-386.
12. Murasko JE. Associations between household income, height, and BMI in
contemporary US schoolchildren. Econ Hum Biol. 2013;11:185-196.
13. Baum II CL, Ruhm CJ. Age, socioeconomic status and obesity growth. J Health Econ.
14. Dex S, Joshi H. Children of the 21st Century: From Birth to Nine Months. Bristol: Policy Press; 2005.
15. Vidmar SI, Cole TJ, Pan H. Standardizing anthropometric measures in children and adolescents with functions egen: Update. Stata J. 2013;13(2):366-378.
16. Case A, Lubotsky D, Paxson C. Economic status and health in childhood: The origins
of the gradient. Am Econ Rev. 2002;92(5):1308-1334.
17. Case A, Paxson C, Vogl T. Socioeconomic status and health in childhood: A comment
on Chen, Martin and Matthews,“Socioeconomic status and health: Do gradients differ within childhood and adolescence?”(62: 9, 2006, 2161–2170). Soc Sci Med. 2007;64(4):757-761.
18. Currie J, Stabile M. Socioeconomic status and child health: Why is the relationship stronger for older children? Am Econ Rev. 2003;93(5):1813-1823.
19. Apouey BH, Geoffard P-Y. Child health and access to health care in France: Evidence
on the role of family income. Revue d'Epidémiologie et de Santé Publique. 2014;62(3):179-190.
20. Apouey B, Geoffard P-Y. Family income and child health in the UK. J Health Econ. 2013;22(4):715-727.
21. Propper C, Rigg J, Burgess S. Child health: Evidence on the roles of family income and maternal mental health from a UK birth cohort. Health Econ. 2007;16(11):1245-1269. 22. Case A, Lee D, Paxson C. The income gradient in children’s health: A comment on
Currie, Shields and Wheatley Price. J Health Econ. 2008;27(3):801-807.
23. Currie A, Shields MA, Price SW. The child health/family income gradient: Evidence from England. J Health Econ. 2007;26(2):213-232.
24. Pearce A. Will policies in the early years reduce inequalities in health? A synthesis to inform policy. Ph.D. thesis. University College London. 2011.
25. Kuehnle D. The causal effect of family income on child health in the UK. J Health
Econ. 2014;36:137-150.
26. Griffiths LJ, Sera F, Cortina-Borja M, Law C, Ness A, Dezateux C. Objectively measured physical activity and sedentary time: Cross-sectional and prospective associations with adiposity in the Millennium Cohort Study. BMJ Open. 2016;6:e010366.
27. Ambrosini GL, Emmett PM, Northstone K, Howe LD, Tilling K, Jebb SA. Identification of a dietary pattern prospectively associated with increased adiposity during childhood and adolescence. Int J Obes. 2012;36:1299-1305.
28. Williams AJ, Henley WE, Williams CA, Hurst AJ, Logan S, Wyatt KM. Systematic review and meta-analysis of the association between childhood overweight and obesity and primary school diet and physical activity policies. International J Behav Nutr Phys
Act. 2013;10(101).
29. Biehl A, Hovengen R, Grøholt E-K, Hjelmesæth J, Strand BH, Meyer HE. Parental marital status and childhood overweight and obesity in Norway: A nationally representative cross-sectional study. BMJ Open. 2014;4:e004502.
30. Halliday JA, Palma CL, Mellor D, Green J, Renzaho AM. The relationship between family functioning and child and adolescent overweight and obesity: A systematic review. Int J Obes. 2014;38(4):480-493.
31. Van Rossem L, Hafkamp-de Groen E, Jaddoe VW, Hofman A, Mackenbach JP, Raat
H. The role of early life factors in the development of ethnic differences in growth and overweight in preschool children: A prospective birth cohort. BMC Public Health. 2014;14:722.
32. O’Dea JA. Gender, ethnicity, culture and social class influences on childhood obesity among Australian schoolchildren: Implications for treatment, prevention and community education. Health Soc Care Community. 2008;16(3):282-290.
33. O’Dea JA, Dibley MJ. Prevalence of obesity, overweight and thinness in Australian children and adolescents by socioeconomic status and ethnic/cultural group in 2006 and 2012. Int J Public Health. 2014;59(5):819-828.
34. Danielzik S, Czerwinski-Mast, M. Langnäse K, Dilba B, Müller MJ. Parental
overweight, socioeconomic status and high birth weight are the major determinants of overweight and obesity in 5-7 y-old children: Baseline data of the Kiel Obesity Prevention Study (KOPS). Int J Obes Metab Disord. 2004;28(11):1494-1502.
35. Chari R, Warsh J, Ketterer T, Hossain J, Sharif I. Association between health literacy and child and adolescent obesity. Patient Educ Couns. 2014;94(1):61-66.
36. Dallacker M, Hertwig R, Peters E, Mata J. Lower parental numeracy is associated with
37. Donatiello E, Dello Russo M, Formisano A, Lauria F, Nappo A, Reineke A, Sparano S, Barba G, Russo P, Siani A. Physical activity, adiposity and urbanization level in children: Results for the italian cohort of the IDEFICS study. Public Health. 2013;127(8):761-765.
38. Villanueva R, Albaladejo R, Astasio P, Ortega P, Santos J, Regidor E. Socio-economic
environment, area facilities and obesity and physical inactivity among children. Eur J
Public Health. 2016;26(2):267-271.
39. Grow HM, Cook AJ, Arterburn DE, Saelens BE, Drewnowskia A, Lozano P. Child obesity associated with social disadvantage of children’s neighborhoods. Soc Sci Med. 2010;71(3):584-591.
40. Carter MA, Dubois L. Neighbourhoods and child adiposity: A critical appraisal of the
literature. Health Place. 2010;16(3):616-628.
41. Igel U, Romppel M, Baar J, Brähler E, Grande G. Association between parental
socio-economic status and childhood weight status and the role of urbanicity. Public Health. 2016;139:209-211.
42. Igel U, Romppel M, Baar J, Brähler E, Grande G. The association between area-level
socio-econmic status and childhood overweight and the role of urbanicity. Obesity
Medicine. 2016;2:13-18.
43. Apouey BH. Les disparités sociales de santé perçue au cours de la vie : Le cas de la France (2004-2012). Bulletin Epidémiologique Hebdomadaire. 2015;24-25:456-465.
44. Deaton A, Case A. Broken down by work and sex: How our health declines. In: Wise
DA, ed. Analyses in the Economics of Aging. Chicago: University of Chicago Press; 2005.


![[PDF] Cours général pour débuter avec le logiciel Ciel Devis Factures | Cours informatique](data:image/gif;base64,R0lGODlhAQABAIAAAP///wAAACH5BAEAAAAALAAAAAABAAEAAAICRAEAOw==)