HAL Id: hal-01338081
https://hal.archives-ouvertes.fr/hal-01338081
Submitted on 22 Nov 2016
HAL is a multi-disciplinary open access
archive for the deposit and dissemination of
sci-entific research documents, whether they are
pub-lished or not. The documents may come from
teaching and research institutions in France or
abroad, or from public or private research centers.
L’archive ouverte pluridisciplinaire HAL, est
destinée au dépôt et à la diffusion de documents
scientifiques de niveau recherche, publiés ou non,
émanant des établissements d’enseignement et de
recherche français ou étrangers, des laboratoires
publics ou privés.
Sonorous cartography for sighted and blind people
Didier Josselin, Dorian Roussel, Said Boularouk, Abdelberry Saidi, Driss
Matrouf, Olivier Bonin, Eitan Altman
To cite this version:
Didier Josselin, Dorian Roussel, Said Boularouk, Abdelberry Saidi, Driss Matrouf, et al.. Sonorous
cartography for sighted and blind people. AGILE’2016 - 19th AGILE International Conference on
Geographic Information Science, Jun 2016, Helsinki, Finland. �hal-01338081�
Didier Josselin
& Dorian Roussel
UMR ESPACE 7300, CNRS
Avignon, France
[email protected]
Said Boularouk,
Abdelberry Saidi,
Driss Matrouf
& Didier Josselin
Université d’Avignon, LIA
Avignon, France
[email protected]
Olivier Bonin
Laboratoire Ville Mobilité Transport
Paris, France
[email protected]
Eitan Altman
INRIA
Sophia-Antipolis, France
[email protected]
AbstractIn this article, we test the usability of a cartographic tool mixing maps and sounds. This tool is developed within QuantumGIS as a plugin prototype. We first present some theoretical reflections about synesthesia. Secondly, we explain the way we «sonificate» the images, by associating colors and recorded chords and sounds. Then we present the results of several usability tests in France with different users, including blind people. We finally conclude on the contributions and the limitations of such a tool and draw some perspectives.
Keywords: sonorous cartography, image, colors, usability tests, blind people, soundscape.
1
Introduction
In this article, we present a prototype plugin for sonorous mapping and we test its usability mixing maps and sounds. We first explain how people perceive space in a single esthesia (use of a single sense) or synesthesia (com-bination of two neural senses). It concerns sighted and blind people as well, who developed different capabilities. Visual and auditory dimensions are compared and their relationship is discussed. In a second stage, we draw a con-cise state of the art about synesthesic cartography, which motivated our research.
Then we present the prototype plugin, which was de-veloped within QuantumGIS. We detail the process to sonificate the images, by associating colors and different recorded sounds. Some examples of sonification illustrate the article content. We show the results of a usability test with different users, including sighted and blind people. We finally conclude on the contributions and the limita-tions of such a tool and draw some perspectives.
2
(Syn)esthesic mapping
2.1 Multi-sensory perception of space
Perception of space involves sensory processes, including vision and hearing, which are used to locate objects in space. According to Krantz [17], «senses are transducers from the physical world to the realm of the mind where we interpret the information, creating our perception of the world around us». Indeed, information received from all sensory processes can be grouped in several categories.
In contrast with proprioception, which gives information on the relative position of individual body parts and on their relation with surrounding space, these senses are all
exteroceptive:
• Vision is the most powerful spatial sense; it pro-vides direct access to information, extensive percep-tual field, simultaneous apprehension of a very large portion of the near and outer space, processing speed, various and subtle object discrimination with a high spatial informational power; it plays a major role in initiating and controlling movements directed to-wards objects [12].
• Hearing is used for prospective manifestations of dis-tance and position; it identifies the nature of objects less than the vision (not all objects emit sounds); hearing is also a spatial sense [12], because it allows a remote perception of moving sonorous objects and it codes information to a frequency field [16]. • Other senses are less effective for space
apprehen-sion. Touch, the perception of contact, is limited to a close perceptual field, even if it can be enlarged by scanning movements. Olfaction or smell is the sense that allows analysis of volatile «chemicals» in the air. It helps to detect a certain type of fragrant objects. Tasting is also a specific sense useless for mapping. All these sensors may be combined in a synesthesic way for improving object detection. Moreover, results regard-ing needs of visually-impaired people to compensate visual perception, show that auditory and tactile information are the most appreciated senses [20, 8, 9]. For technical rea-sons and body maintenance, auditory may be the best
AGILE 2016 - Helsinki, June 14-17, 2016
Figure 1: Newton wheel [3]
sense to comprehend an object. In our research, we only consider vision and hearing, more precisely how hearing may magnify visual or mental maps.
2.2 Visual vs auditory space
Correspondence between sound and color was largely studied over the centuries. Despite common character-istics in signal waves and physiology, it does not seem easy to directly match sounds to colors. The first re-flections on the subject date back to Antiquity, with a classification from Aristotle in the 17th century. Then Marin Cureau de la Chambre (1596-1669) [3] compared color and music harmonies. Castel [7] paved the way for a series of reflections and positions on synesthesia, which is the combination of two neurological senses during a same experiment. Newton [21] had tried to design an analogy between colors and the seven notes of the diatonic scale as shown in the «color wheel» (cf. Figure 1). Can we establish a correspondence between sounds and colors ra-tionally based on both characteristics of sound and light waves [3]? This bridge is difficult to build directly be-cause there is no overlap between the frequency ranges of the sounds audible by the human ear (20 to 20 KHz) and the light visible by eyes (waves from 400 to 800 THz) (cf. Figure 2).
Figure 2: Color vs Sound frequencies
Source: Wikipedia
2.3 Synesthesic cartography
Since the pioneering work of J. Bertin [4] in graphic semi-otics, mapping has mainly evolved [11] on two aspects: in-teractivity [15] and online accessibility. For recent years, cartography included motion and time line [19, 14], i.e. animated, multimedia or interactive mapping [6]. How-ever, most of the works done on semiotic is about data geovisualization. A few works dealt with sonorous maps semiotic [18, 11], but they concluded that joining images
and sound or music still needs major improvements, espe-cially to associate memory capability and sounds.
On another hand, «soundscape» was developed in 1969 [25]. It uses the sounds of landscapes to give meaning to places and environment. For instance, a link between soundscape and GIS was proposed in [27]. Other authors mapped different sounds [26]. In this case, peculiar sounds characterize targeted places explicitly.
Directly in the lineage of the work from Newton and Castel, some authors developed applications to
«sonifi-cate» a map [2] and [24], by mapping elements of
cartog-raphy (e.g. the color of figurative) and music components (e.g. notes, duration, chords).
Thus, cartography can be used in a synesthesic way [10, 13], but also be based on a single esthesia, especially when considering blind people, as proposed in this paper.
2.4 Space representation for sighted or blind people
Although is is very difficult to simulate blindness simply by closing eyes and due to the variety of pathology, we know that blind people are unable to build spatial pat-terns that require visual sense [23, 22]. However, these persons can feel natural proprioceptive patterns, and some kinds of exteroceptive schemes (touch, acoustic, olfac-tory), which help to locate in space. Studies showed that behavior of visually impaired and blind people changes from a person to another, several factors playing differ-ent roles. For instance, late blind people (in life) do not have the same difficulties in building space as people who recently became blind.
A question that often arises by specialists is the follow-ing: is it possible for blind people to acquire the same spatial knowledge (and at the same level) by implement-ing functions that compensate the lack of vision [12]? In fact, how knowledge is acquired does not really matter. It is a modeless or multimodal process that suggests there is no real difference between blind and sighted people cog-nition final functions due to adaptation [22, 12]. In many cases, mental structure of blind people may be different and space perception can refer to a touch or sound idea [12].
Somehow, visually impaired people have another defi-nition of space:
Distance = T ime and Environment = T ouch + Sound
This implies that Space = T ime + T ouch + Sound, which is the assumption we state in this article.
Compensation of visual impairment of blind people by the auditory sensory field is a technique that wows scien-tists. Several studies brought interesting results in recent years. For instance, in 2012, Amir Amedi [1] and his team tested a new approach and devices to activate the visual cortex with text data coming from existing senses. Eight congenitally blind participants showed activation of the visual word area after 2 hours of training with listening soundscapes. Both sighted and blind individuals showed
activation of the same left ventral occipito-temporal cor-tex in response to letters.
In cartography, some experiments were proposed in [24] to join maps and music to comprehend geographical space in a synesthesic way. Developed within Quantum GIS, the tool allows to extract spatial patterns of pixels on images and to sonificate space areas using soundscape signatures and musical compositions which suggest representations of real territories.
On another hand, the use of spatial representations and calculations for musical structures is an active research field [5]. The question of the translation of a score map is somewhat similar to use a spatial structure extracted from a map with a set of musical constraints (harmonic,
melodic, rhythmic). We are then in a potentially fruitful
approach linking sound, music and space.
The research we develop build on the idea that hear-ing sounds and music can be an efficient way to mentally represent space for both sighted or blind people. We de-veloped a prototype that explores sound track mapping, exploiting images to emphasize the characteristics of the environment it represents (urban area, forest surroundings beside a river, etc.). It matches environmental charac-teristics and sound materials using a sonification process including soundscape. Other tests are proposed with mu-sic compositions associated to different land uses in the image. The software seeks to establish synesthetic cor-respondences with sounds evoking a more or less faithful representation of space.
3
Interaction between maps and sounds
We present here a plugin prototype developed within QuantumGIS.
3.1 Packages used in QuantumGIS
QGIS is a reference free Geographical Information Sys-tem. Il allows to represent vector or raster data. Previ-ously developed in C++, it proposes a Python interface. To sonificate sonorous sequences of ambient records or musical compositions, we used several packages (API):
• PyQt: to manage GUI interface (Graphical User In-terface) ;
• Matplolib: to visualize data in the Matlab format; • PyDub: for sound tracking and mixing;
• OpenCV: to visualize images;
• K-d Tree: to make easier to build and manage tree in k dimensions.
3.2 Image sonification process
Some techniques were already developed to match space and sounds by an automatic numerical translator that links color values (in the ranges from 0 to 255 for 8 bits images or from 0 and 65535 for 16 bits images) with in-terval [-1;1] by interpolation; see for example [2]. In such
approaches, data are preserved (order, progression in val-ues) but the sounds produced may be inaudible or at least spatially non significant.
The approach we propose is slightly different. We try to pass from sets of localized pixels made of three dimensions (color composed of three channels) to a recorded sound or a suggesting music supposed to represent this space without loss of sense. This is tested with sighted and blind users.
3.3 Algorithm to find the dominant color
QGIS can deal with raster images using 3 memory blocks assigned to each RGB color. We aimed at representing colors in a single value. To do so, we use the Luminance −
Chrominanc model that minimizes the distance between
close colors. We chose the model CIELAB where L is the brightness, a is the position on an axis from red to green and b is the position on an axis from yellow to blue. This procedure requires to use OpenCV.
We first fix a series of discriminant colors that will be assigned to particular sounds or music sequence. On the image, we graphically choose a set of pixels in a window. Once this is done, we need to find the dominant (in our case the average) color in the set of pixels and to find out what is the corresponding color among predefined ones. To do this assignment, we use a kd-tree instead of Euclid-ian distance, which is more efficient and quicker.
3.4 Image and records
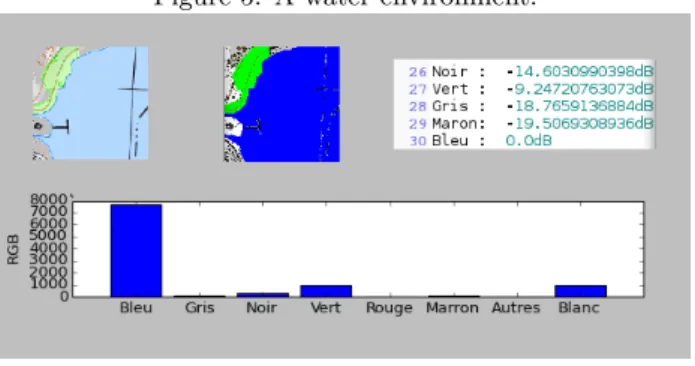
We propose two ways to sonificate the image: soundscapes and musical composition. Using PyDub, we apply a color matching, which allows to combine the dominant colors in an image from IGN (cf. Figure 3) with different types of sonorous sequences.
Five soundscapes are first used, corresponding to 5 dominant colors on the image. This list may be adapted to any images with different dominant colors. The sounds come from public libraries of soundscapes we wish to il-lustrate. Others were recorded in the neighborhood of Avignon, France. They are available online1.
• Green refers to trees, grass and forest; the sound is a mixture of wind whistling on branches and steams and bird singing (hear the audio file green0.mp3 in the folder M use/Sounds/AS);
• Blue describes rivers and in general, water; the cor-responding soundscape is a water flow (blue0.mp3); • Grey depicts industrial activities with buildings
(grey0.mp3);
• Black denotes urban areas with houses, streets and kid shouts (black0.mp3);
• Orange suggests sounds emitted by vehicles on trav-eled roads (orange0.mp3).
A second approach consists in somehow developing a «musical speech» to evoke the colors and landscapes in the
1
https://drive.google.com/folderview?id=0BwczJf_wKm2_ Tzc3MnVnYW15WE0&usp=sharing
AGILE 2016 - Helsinki, June 14-17, 2016
Figure 3: An image to sonificate.
image. We propose two compositions, an acoustic melody and an electronic groove (rhythm). We also have 5 differ-ent patterns corresponding to each color. Some are pro-posed by authors of this paper and others were compro-posed by other music composers for the usability test. They can be respectively downloaded in both folders /Sounds/OB (acoustic) and /Sounds/DJ (electronic).
3.5 Composing the sounds according to the colors distribution
The key variable is the volume. It is indeed proportional to the frequency of pixels of a certain color (after assign-ment) in the window. When a color is dominant on the image, then the soundscape is the loudest. As the relation is not linear, we used the following formula in PyDub to process the gain of each soundscape:
Gain(c) = 20 × log(d/Dmax) (1) with c a color among the five ones, d the frequency of corresponding pixels and Dmax the maximum number of pixels belonging to one of the colors. This was used for both soundscapes and musical compositions.
4
Results and tests
4.1 Examples of sonorous sequences
Firstly, to test the prototype and its interface (Figure 4), we use a window of 100 × 100 pixels and we select a few typical locations to be sonificated as examples, which can be downloaded online in the folder M use/Compo:
• A first location identifies a crossroad downtown, with a neighborhood made of kid shouts and car noise (cf. Figure 4); sounds and music depict an urban area, sometimes represented by a hectic sonorous sequence pulsated by marked rhythms; see the corresponding soundscape in sub-folder /Compo/AS2/AS0.mp3, acoustic melody in /Compo/OB2/OB0.mp3, elec-tronic groove in /Compo/DJ 2/DJ 0.mp3;
• A second location is mainly a river with a few grass; in the different records, you can mainly hear water flow and a few sounds from natural environment (resp.
AS2/AS1.mp3, /OB2/OB1.mp3, DJ 2/DJ 1.mp3);
• A third location is including a large part of grass-land; soft natural sounds such as birds and wind, harp and flute emphasize these quiet areas (resp.
AS2/AS2.mp3, /OB2/OB2.mp3, /DJ 2/DJ 2.mp3).
Figure 4: Graphic interface of the prototype plugin: colors assignment for an urban location
Figure 5: A water environment.
4.2 Usability tests
We tested the method with 54 participants including 16 blind or visually-impaired people, 16 students in geogra-phy and 23 pupils from elementary school. The partici-pants were most of the time young. However, one was 65
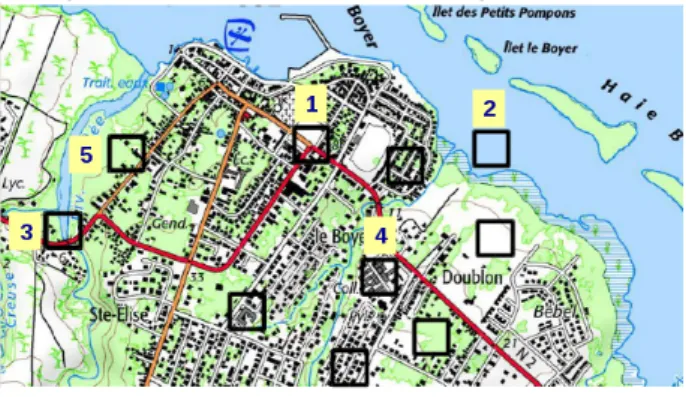
Figure 7: Usability tests with sighted and blind people: finding the 5 sonificated locations among 10 candidates.
years old and 4 were between 25 and 34 years old. The test presented here is a part of the whole study. It is quite simple (cf Figure 7): after an introduction about the test objectives, participants hearing was trained with a series of sonorous and musical sequences supposed to represent a set of colors that compose the image. Once the correspon-dence between colors and sounds effective, we proposed to all the participants a set of 10 candidate square locations. 5 different sonorous compositions were then provided and the participants had to match them with 5 of the loca-tions they think they represent. For blind people, we just orally listed the locations and especially asked about the colors suspected to be in the windows of each location.
A majority of the participants succeeded in finding the relevant patterns. For instance, the first pattern (see nb. 1 in Figure 7) was correctly assigned by 34 people. The sec-ond pattern was even simpler and only 6 people did not find the good matching. The third pattern was slightly more complex because it was a mixture of several bal-anced sounds. In this case, pupils had difficulties to fix this problem (50% of good answers) while 11 blind and vision-impaired people (among 15) succeeded. This shows the compensatory capability developed by those. Simi-lar results were obtained with the fourth pattern, where only 30% of the sighted people provided the good results, while 67% of blind people succeeded in finding the cor-rect assignment. However, they are globally older in this group. The fifth pattern was somehow subtle due to the insertion of a little black and orange in a dominant green which required to prick up one’s ears. Here about 70% of the students succeeded and only 30% for the pupils. This shows that experience is required to learn and to use sonorous mapping, whatever your vision capability. Com-plementary studies will be provided to adapt and improve the learning stage of the process and to check what sort of sounds and music speak the best way to sighted or visually impaired people.
5
Conclusion
We presented an original approach to sonificate images using a dedicated GIS plugin prototype. Some usability
tests were provided and showed that in most of the cases, such a tool may be useful to represent colored spatial pat-terns using sonorous sequences and even short music com-positions. It also enhanced the capacity of blind people to analyze and take into account sounds in their envi-ronment representation, sometimes in a better way than sighted people due to an efficient sense compensation.
However, there is still research to develop to general-ize these first promising results (made from a little, and probably not representative, population sample). More-over, images also show some text (generally in black) that may impair the colored composition analysis provided by the plugin. Passing to vector objects instead of colors will also open new interesting fields, including space harmony, topological organization and path description.
References
[1] Levy-Tzedek S Maidenbaum S Amedi A Abboud S, Hanassy S. Introducing a visual colorful experience for the blind using auditory sensory substitution, 2013.
[2] Sara Adhitya and Mika Kuuskankare. SUM: from Image-based Sonification to Computeraided Compo-sition. In CMMR, London, 2012.
[3] Valeur Bernard. Sons et Couleurs: de la science à l’art. page 11, June 2012.
[4] J. Bertin. La Graphique et le traitement graphique de
l’information. Flammarion, Paris, 1975.
[5] Jean Bresson, Carlos Agon, and Gérard Assayag. The
OM Composer’s Book 2. Editions Delatour/IRCAM,
2008.
[6] W. Cartwright, M.P. Peterson, G. Gartner, and (Eds). Multimedia cartography. Springer Verlag, 2007.
[7] Louis-Bertrand Castel. L’Optique des couleurs. 1740. [8] Certu. Répétiteurs de feux piétons pour person-nes aveugles et malvoyantes. Technical Report ISSN 0247-1159, France, 2006.
[9] CFPSAA. Les besoins des personnes déficientes vi-suelles. Technical report, July 2010.
[10] Paul E. Dworak. Color Harmonies and Color Spaces Used by Olivier Messiaen in Couleurs de la cité céleste. 2001.
[11] Francisco Escobar, Colette Cauvin, and Aziz Serradj.
Des voies nouvelles à explorer. les révolutions tech-nologiques et leurs conséquences conceptuelles et pra-tiques). volume 5. Hermès-Lavoisier, Traité IGAT Série Aspects fondamentaux de l’analyse spatiale., 2008.
AGILE 2016 - Helsinki, June 14-17, 2016
[12] Yvette Hatwell. Appréhender l’espace pour un enfant aveugle. Enfances & Psy, 33(4):69, 2006.
[13] Ward Jamie, Huckstep Brett, and Tsakanikos Elias. Synaesthesia, Sound-Colour. Cognitive neuroscience
perspective on synaesthesia, 42:264–280, 2006.
[14] D. Josselin and S. Fabrikant. Cartographie animée et
interactive. Hermès, Lavoisier, Paris, 2003.
[15] Didier Josselin. Interactive geographical information system using LISPSTAT : prototypes and applica-tions. Journal of Statistical Software, 13(6), 2005. [16] Jacques Jouhaneau. Perception de l’espace et
immer-sion - Perception auditive, 2013.
[17] John Krantz. Experiencing sensation and perception, 2012.
[18] J. Krygier. Sound and geographic visualization.
Visu-alization in Modern Cartography, Alan MacEachren
and D.R.F. Taylor (eds.).:149–166, 1994.
[19] A. Mac Eachren. How Maps Work: Representation,
Visualization, and Design. Guilford Press, NY, 1995.
[20] T. Miura, Y. Ebihara, M. Sakajiri, and T. Ifukube. Utilization of auditory perceptions of sounds and silent objects for orientation and mobility by visually-impaired people. In 2011 IEEE International
Con-ference on Systems, Man, and Cybernetics (SMC),
pages 1080–1087, October 2011. [21] Isaac Newton. Opticks. 1704.
[22] Baltenneck Nicolas. Se mouvoir sans voir. Inci-dences de l’environnement urbain sur la perception, la représentation mentale et le stress lors du déplace-ment de la personne aveugle. PhD thesis, Université
Lumière Lyon 2, France, 2010.
[23] Anita Richaume-Crinquette. L’accès à l’information
parlée chez l’aveugle. 1990.
[24] Abdelbery Saidi, Olivier Bonin, Didier Josselin, and Eitan Altman. Proposition pour Cartographie Sonore Synesthésique et Interactive. In Spatial Analysis
and GEOmatics (SAGEO 2014), Grenoble, France,
November 2014.
[25] Murray Schafer R. The New Soundscape. Don Mills, Toronto., 1969.
[26] J. Schiewe and A.-L. Kornfeld. Framework and po-tential implementations of urban sound cartography. In 12th AGILE International Conference on
Geo-graphic Information Science 2009, 2009.
[27] S Servigne, M-A. Kang, and R Laurini. Gis for urban soundscape : from static maps to animated cartog-raphy. In Proceedings of Second International
Con-ference on Decision making in Urban and Civil Engi-neering, November 20-22, 2000, Lyon, France, 2000.
![Figure 1: Newton wheel [3]](https://thumb-eu.123doks.com/thumbv2/123doknet/13407745.406847/3.892.181.349.161.340/figure-newton-wheel.webp)