HAL Id: hal-00701230
https://hal-paris1.archives-ouvertes.fr/hal-00701230
Submitted on 24 May 2012
HAL is a multi-disciplinary open access
archive for the deposit and dissemination of
sci-entific research documents, whether they are
pub-lished or not. The documents may come from
teaching and research institutions in France or
abroad, or from public or private research centers.
L’archive ouverte pluridisciplinaire HAL, est
destinée au dépôt et à la diffusion de documents
scientifiques de niveau recherche, publiés ou non,
émanant des établissements d’enseignement et de
recherche français ou étrangers, des laboratoires
publics ou privés.
Map-TBS: Map process enactment traces and analysis
Charlotte Hug, Rebecca Deneckere, Camille Salinesi
To cite this version:
Charlotte Hug, Rebecca Deneckere, Camille Salinesi. Map-TBS: Map process enactment traces and
analysis. International Conference on Research Challenges in Information Science (RCIS), May 2012,
Valencia, Spain. pp.204-209, �10.1109/RCIS.2012.6240435�. �hal-00701230�
Map-TBS: Map process enactment traces and analysis
Charlotte Hug, Rébecca Deneckère, Camille Salinesi
Centre de Recherche en Informatique Université Paris I Panthéon-Sorbonne
90, rue de Tolbiac, 75013, Paris
{Charlotte.Hug, Rebecca.Deneckere, Camille.Salinesi}@univ-paris1.fr
Abstract—Map formalism allows specifying processes with a high
level of variability. However, this means many variation points, and therefore we need guidance to enact maps by customizing them. Traditional guidance consists in raising decision points to navigate in a map. The limit is that many decision points are raised at the same time, and the user (who enacts the map) does not know which decision to make first. Another kind of guidance, yet to be explored, consists in providing recommendations to the user. Such recommendations can be drawn from collections of profiles collected from map enactment traces using techniques from the data mining domain. This paper proposes a trace management system adapted to maps that was designed to support recommendation-based guidance. The paper shows how data mining algorithms can be used to find profile clusters in a collection of map enactment traces, used then to provide recommendations to the users.
Keywords: Trace-Based Management System; Process Mining; Map process model; Data Mining.
I. INTRODUCTION
Process engineering is a key issue for information system (IS) communities [1]. Several works [2][3][4][5] showed that an improved development process leads to a better productivity of the software systems industry and of the systems quality.
Historically, IS development processes were first organized into sequences of activities with a rigid control flow. Later on, these activity sequences were replaced by values and practices. Then, it appeared that IS engineers were faced with a myriad of methodological choices [6]. As a matter of fact, IS engineers can choose to enact one activity completely or partially, to combine aspects of two or more different activities, or to ignore an activity. Thus, decisions made through the IS development process should reflect the situation at hand and help an IS engineer to specify and enact a unique process adapted to this specific situation. As a result, several methodologies promoting intentions as a first class concept have been developed [7] [8] [9]. Intention-oriented process modeling focuses on what the process is intended to achieve [10]. However, many of these methodologies do not use this intention concept as an integral part of their process model as they focus on how the process is performed and externalize the intention. In the Map formalism [9], the intentional level is used to guide engineers through IS processes by dynamic choices. Each time an intention is achieved the model suggests the next steps that can be enacted and new ways to achieve them. The resulting IS development process is adaptive and flexible as it is dynamically constructed.
Map process models (i.e. maps) specify process variability by emphasizing on the process intentions and on the various ways to achieve them. Maps can be used in Information Systems Engineering (ISE) to specify methodological processes, guide the different actors (who therefore use a map) during a project. The enactment of a map process model can be different depending on the map user, the project context and the expected result. Although maps enactment tools as [11] provide some guidance by identifying intentions and how to achieve them, they do not provide any recommendation: what did other users achieve in a similar context? What are the typical intentions of users with a similar profile? However, once a process has been enacted, it could be useful to get back to it, analyse what has been done and generalize it.
There are various methods that can be used to handle these problems. First, trace-based systems (TBS) are widely used in current information systems [12]. Their goal is to trace the activities of the systems’ users, the messages exchanged, and the executed processes to model the traces, to visualize, abstract and transform them. TBS allow users to annotate their actions to improve the reflexivity of the produced traces. Second, statistics and data mining propose techniques to analyse data and cluster them or detect recurrent patterns [13]. These approaches can then be used to provide recommendation to users according to their profile or to the path they followed.
We believe that combining data mining techniques and trace-based systems will allow providing relevant recommendations to the users who enact maps. The challenge does not only consist in providing recommendations: this problem has already been tackled. Also it consists in providing a model to support more efficient recommendations for high variability processes.
The next section presents related works on trace-based systems and data mining. Section 3 describes our proposal which consists in a model for recording maps traces. Section 4 presents an approach that applies data mining techniques to Map to provide recommendations. Section 5 illustrates the proposal using the CREWS-L’Ecritoire requirements engineering method. Section 5 concludes the paper with an outlook on future works.
II. RELATED WORKS
A. Trace-based systems
A trace can be defined as “a sign that something has happened or existed” [14]. In the context of computer science,
according to [15], a trace is a “temporal sequence of observed items” or, more precisely, a set of data records that are caused by user interactions in the context of the completion of his instrumented activity [12]. Traces can be obtained using log-files. Log-files record all the information about an event that occurred in the system (activities, messages). Before recording events, it is necessary to define the relevant information that needs to be recorded. Usually, logs keep information as the conducted activity, the user who carried out this activity, the timestamp of the event and the properties of the objects currently in use, defined as obsel (observed element) [16].
In some trace-based systems (TBS), the users can enrich the log-files by adding annotations while doing an action in the system or after the completion of the activity. This technique allows getting a richer trace that includes what has been done but also why it has been done, information that can be used to better understand the followed process, however it is pervasive as the users are asked to comment what they are doing.
[15] consider log-files as a quantitative approach, where algorithms and statistics can be run to analyze the logs. This corresponds to the Process Mining approach [13]. On the other hand, qualitative approaches are used in social sciences for example, where detailed observations are carried out, using sound or video recordings. This approach is more expensive as the analysis of the material cannot be processed by a computer. These two approaches are considered unsatisfactory as the quantitative approach is too limited and the qualitative approach too costly. A trace is then regarded as an intermediate solution between the quantitative and qualitative approaches. A trace model is needed to specify what the trace should contain [17]. This model can be obtained thanks to a method for modelling digital traces [12] and is implemented into a TBS.
A TBS is a system that allows recording the traces, transforming them and visualizing them. The first goal of TBS is to allow the user’s activity reflexivity. Visualizing our own traces recorded through the use of a computerized tool can allow us to remember and better understand what was done and what could have been done to be more efficient for example. The second goal of trace-based systems is to allow the user to share and reuse his trace. Sharing a trace means that the trace can be read and understood by the user to hold activity reflexivity or by any other user of the system to reuse the trace. While doing something new in the system, it is useful to know what other users did in the same context.
B. Data mining
A lot of different approaches exist to analyze, classify data, and to discover patterns. In this section, we will briefly present some of these approaches.
One of the approaches is clustering. “Clustering algorithms examine the data to find groups of instances that are similar” [13]. Many algorithms have been defined to assign objects into groups. K-means is a centroid-based algorithm as the clusters are defined according to a distance with a cluster center. For example, according to the gender, the age and the purchases of customers, it is possible to define different groups of customers to better target an advertising campaign. The Expectation-Maximization (EM) algorithm is another clustering technique
that allows defining clusters without specifying a priori the number of clusters, contrarily to K-means. Other clustering algorithms exist such as the Hierarchical Clustering on Principal Components (HCPC) [24] based on principal component analysis and the Ward’s criterion.
Other approaches can be used to discover sequence patterns within a set of ordered data. The GSP algorithm (Generalized Sequential Pattern) [18] considers a sequence of items and determines frequent sequences of items. Spade [26] and Cspade are other sequence mining algorithms. These algorithms are based on time index, sequence identifiers and the corresponding steps. In this context, [13] introduces the process mining technique that consists in “discovering, monitoring and improving real processes by extracting knowledge from events logs”. This work is based on the α-algorithm, and process models as Petri nets that allows discovering (abstracting) process models from log files. This approach has been implemented in a tool [28].
C. Summary
In this section we have presented two approaches: trace-based systems and data mining. TBS approach consists in building a trace model according to a specific goal. The traces stored can be transformed and visualized through the TBS. The traces are not only defined by log-files but also by annotations or media records. The annotations allow the user to comment what he’s doing and why. Data and process mining techniques offer a wide range of algorithms to define clusters among a set of data and to detect frequent patterns in a set of ordered data. These techniques are thus useful when recommending a user to take an action, according to his closest cluster or to a defined frequent pattern. The process mining approach [13] is powerful; however, it is based on activity oriented process models, that is to say models with low variability. Our concerns are process models with high variability as maps that allow modeling complex decisions processes.
III. THE MODELS
Our proposal consists in enriching the Map metamodel to trace the enactment of map processes and perform data mining on these traces. We present the Map metamodel and the model to define maps traces.
A. Map
A map illustrates a given process expressed in intentional terms using the Map formalism. The Map formalism [9] allows specifying process models in a flexible way by focusing on the process intentions and on the various ways to achieve them. The Map metamodel is specified in figure 1.
A map is composed of a set of sections. A section is an aggregation of a source intention and a target intention, linked by a strategy. It embeds the knowledge corresponding to a particular process component to achieve an intention (target intention) from a specific situation (source intention) following a particular approach (strategy). Process variability is captured on the sections of a map linked by three kinds of relations (thread, bundle and path) that allows having multi-thread and multi-paths in a map [19]. A section may be refined in another map.
Figure 1. Map metamodel.
B. Map-TBS
We defined the Map Trace-Based System (Map-TBS) to manage the modelled traces of our map processes. A modelled trace results from the observation of interactions between the user and the system, that is to say the observation of the navigation through the map process by the selection of specific sections. Figure 2 presents a high level view of the Map-TBS model.
A modelled Trace is composed of several trace elements, each corresponding to a specific map section selection and enactment. Each Trace element contains two attributes: a temporal value stamping the exact time of the selection and an
annotation. [21] pointed out that an ongoing challenge is the
qualitative annotation of log data. As a matter of fact, to identify a trace is not sufficient to find the rationale behind it. A trace element involves several modelled sections: one is selected to go further in the process (selected section) over several candidate alternatives (candidate sections). A modelled section does not refer to the class Section in the Map metamodel but to a particular section of a map process model, defined at the M1 level.
Figure 2. Map-TBS model.
Each trace corresponds to a certain context. The situation in which the trace has been recorded is kept in a set of Trace
indicator values. These indicators concern the user who enacts the
process (age, gender), his expertise and experience regarding the project, the innovative nature of the project, etc. Trace element
indicator values specify the particular context in which a section
was enacted. They can refer to the complexity of the product being developed, the user level of expertise to achieve the intention, etc. The indicators used in this paper are defined in [20]. A cluster is a set of generic cluster indicators. It defines a specific kind of context that may be reused later on to provide recommendation to users. Cluster indicators have several
attributes: a minimal value and a maximal value, which determines the range of values taken into account by the profile, and a reliability degree of this interval. For instance, a cluster may be defined for users of 20 to 30 years old but with a low reliability. This means that, if the others indicators values correspond to the cluster values, it is possible to accept a user of 19, even if it is not in the predefined range of ages. A cluster is related to a specific path within a map process model that corresponds to the recommendation.
IV. RECOMMANDATIONS USING MAP-TBS
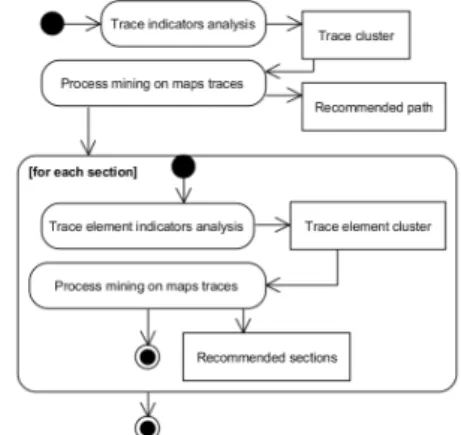
In this section we describe how we can provide recommendations using Map-TBS. Figure 3 presents the different steps of the method we follow to provide recommendations to users while enacting map process models.
Figure 3. The prescribed method to provide recommendations.
A. Indicators and clustering techniques
The “Trace indicators analysis” and “Trace element indicators analysis” steps in figure 3 use the indicators and clustering techniques to detect different types of homogeneous groups within the many instances of a map process model.
Trace indicator value allow characterizing the project and the user who is enacting the map process model: role, Age, gender, experience, expertise, project size, duration, cost, application type are examples of trace indicators. They allow detecting clusters of homogeneous users and project types. Our goal is to provide recommendations to map users who can be requirements engineers, project managers or analysts for example. There are then different user profiles according to a map process model, called “Trace cluster” in figure 3. By using Multiple Correspondence Analysis (MCA), we are able to reduce the number of indicators to two dimensions. Then, different clusters can be defined by applying the HCPC algorithm on the obtained set of individuals.
Trace element indicators values are similar to trace indicators except that they are defined at the section level. For each section of an enacted map, indicators values are defined. Trace element indicators are, for example, product size, product quality, product complexity degree or product innovation degree. Trace element clusters are calculated according to the trace element indicators and the section to which they correspond. These clusters will help us categorizing a user when he reaches a particular section in the enacted map process
model. As in the “Trace indicators analysis” step, MCA and HCPC algorithms can be used to detect trace element clusters. The indicators allow defining clusters at the map level (trace indicators) and at the section level (trace element indicators).
B. Process mining and recommendations
The two “Process mining on map traces” steps use process mining techniques to provide recommendations to the users according to their cluster (trace cluster or trace element cluster). Among the many enactments of a map process model, it should be possible to retrieve sequence patterns [13], which consist in a sequence of selected sections. Sequence patterns are discovered using process mining techniques that detect similar sequences of selected sections within the map traces. Then, each trace cluster is associated with a potential path that corresponds to a frequent trace. Combining clustering and process mining help us to suggest a sequence of sections according to the trace indicators values. Moreover, the trace element clusters are associated to a particular section. We can propose the best suited next section to follow according to the trace element cluster by using process mining techniques.
The CSpade sequence mining algorithm allows calculating the most frequent sequences of sections that appear in traces. The CSpade algorithm analyses traces composed of the sequence id (the trace id, which identifies each trace in a unique way), the timestamp, which correspond to the timestamp of the trace element, the number of sections reached at this moment, the corresponding list of reached sections by computing the frequences of sequences.
V. ILLUSTRATION
We will now illustrate how Map-TBS can be used with requirements engineering method, CREWS-L’Ecritoire [22].
A. CREWS-L’Ecritoire
CREWS-L’Ecritoire (CL) is a method aiming at discovering and eliciting requirements. It is defined as a map that allows method engineers to elicit goals, to define scenarios, and to refine scenarios to elicit new goals (Figure 4).
Figure 4. CREWS-L’Ecritoire process map (CL Map).
B. Example
Let’s take the fictive example of Bob in charge of the requirements analysis for a new job hunting website including
business innovation. Bob uses CL map to elicit the requirements. The first step consists in providing values for the trace indicators, to identify the trace cluster to which Bob belongs. He is a 33 years old project manager with low experience in CL map; the project will last 12 months and has a medium cost.
We simulate 75 observations of trace indicators values from other CL map users. As some data are categorical (role, gender, experience…) and other are numerical (age and duration) we run a Multiple Correspondence Analysis (MCA) and transform the numerical data into categorical data: Age will be defined as {junior, confirmed, senior, expert} for the values: age<30, 30<age<35, 36<age<45, age > 46, respectively. Duration will be changed into {low, medium, high} for duration in months of: duration ≤12, 12<duration ≤24, duration >24, respectively.
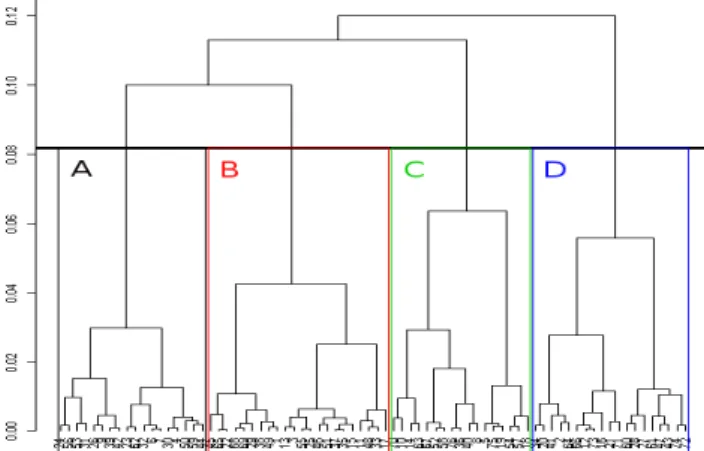
Figure 5. Hierachical classification of the 75 observations.
Four clusters have been defined according to the trace indicators values. Figure 5 presents the hierarchical clustering of the observations of other CL users. This diagram was obtained using the functions MCA [23] and HCPC with the open source tool, R [25]. The HCPC function helps determining significant characteristics of each cluster: Group A corresponds to female juniors managing projects of low duration and high size, Group B corresponds to confirmed project managers with medium expertise managing projects of high duration and low cost, Group C are male experts working in projects of medium size and cost. At last, group D is composed of senior requirement engineers involved in intra-organizational, high cost, low size and medium duration projects.
We now know the cluster Bob belongs to. By analysing the traces of the users of the group C, we are able to provide a recommendation of the path he could take.
Table I presents a trace of the enactment of the CL map. It begins with the selection of section S1, because there is no other candidate. Then, the user chose to elicit a new goal by using a template (S3), and next to write a scenario still using templates (S5). Thanks to the annotations, we can understand that using templates can help CL users while defining the goals and scenarios of the future IS for example. We do not show the corresponding trace element indicators for readability reasons.
TABLE I. EXEMPLES OF TRACES
TraceID TraceElementID Timestamp User annotation Candidate sections Selected section
343 1 2011-11-07 11:12 1 1 343 2 2011-11-07 11:20 I think it is easier to elicit a
goal using a template
2, 3, 4, 5, 6 3 343 3 2011-11-07 11:23 I had the weird intuition that it
was the right thing to do
2, 3, 4, 5, 6 5
To recommend a path to CL users, we run the CSpade algorithm within the R tool by using the aRulesSequences package [27]. This algorithm calculates the most frequent sequences of sections that appear in traces. We randomly generated 75 traces and applied the CSpade algorithm to the traces of group C. Figure 6 presents an extract of the results returned by CSpade.
Figure 6. Extract of the sequence found within the traces.
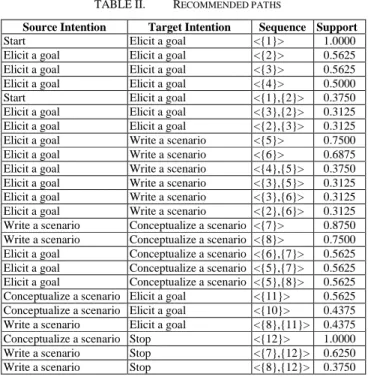
The two first results are obvious: each trace begins with section 1 and ends with section 12, so their support is 1 (probability of 100%). We can see that section 7 often appears in the traces (support 0.875 or 87,5%); it corresponds to the section <Write a scenario, Conceptualize a scenario, manual strategy> of the CL map. The sequences of sections 6-7 and 5-7 are present in 56% of the traces. Unifying the results of CSpade, we could consider that the recommended paths for group C of the CL users could be as shown in Table II.
TABLE II. RECOMMENDED PATHS
Source Intention Target Intention Sequence Support
Start Elicit a goal <{1}> 1.0000 Elicit a goal Elicit a goal <{2}> 0.5625 Elicit a goal Elicit a goal <{3}> 0.5625 Elicit a goal Elicit a goal <{4}> 0.5000 Start Elicit a goal <{1},{2}> 0.3750 Elicit a goal Elicit a goal <{3},{2}> 0.3125 Elicit a goal Elicit a goal <{2},{3}> 0.3125 Elicit a goal Write a scenario <{5}> 0.7500 Elicit a goal Write a scenario <{6}> 0.6875 Elicit a goal Write a scenario <{4},{5}> 0.3750 Elicit a goal Write a scenario <{3},{5}> 0.3125 Elicit a goal Write a scenario <{3},{6}> 0.3125 Elicit a goal Write a scenario <{2},{6}> 0.3125 Write a scenario Conceptualize a scenario <{7}> 0.8750 Write a scenario Conceptualize a scenario <{8}> 0.7500 Elicit a goal Conceptualize a scenario <{6},{7}> 0.5625 Elicit a goal Conceptualize a scenario <{5},{7}> 0.5625 Elicit a goal Conceptualize a scenario <{5},{8}> 0.5625 Conceptualize a scenario Elicit a goal <{11}> 0.5625 Conceptualize a scenario Elicit a goal <{10}> 0.4375 Write a scenario Elicit a goal <{8},{11}> 0.4375 Conceptualize a scenario Stop <{12}> 1.0000 Write a scenario Stop <{7},{12}> 0.6250 Write a scenario Stop <{8},{12}> 0.3750
Table II should be read as follows. Group C users usually begin the CL method by selecting the S1 section, or they select S1 followed by the S2 section in 37.5% of the traces. Then, if the intention is to elicit a goal, group C users usually select the S2, S3, S4 sections or S3 followed by S2 and vice versa. If the intention is to write a scenario, they select S5 (75%), or S6 (68.75%) most of the time. The table presents the sequences for which the support is the most significant.
Now, imagine that Bob has just achieved the “Elicit a goal” intention and he needs recommendation on what he should do next, as he is a CL novice user. He has only enacted the first section in the map; the values of the trace element indicators are low: product size and product quality are low, importance degree is normal. The unification has been done manually but will be automated thereafter.
The MCA functions are run with HCPC to determine clusters among the 16 trace element indicators values of group C users. The trace element indicators are randomly generated. We obtain 2 groups: the first group is characterized by a high product complexity degree and the second group by a low product complexity degree. The other variables are not significant. Bob then belongs to group 2.
Thanks to the trace element indicators values of the group 2 and the associated traces, we can provide a recommendation for the next section Bob could select. Table III presents the recommended section for group C2 users: group C determined according to the trace indicators values and group 2 according to the trace element indicators values within group C. 80% of the users of group C2 wrote a scenario after eliciting a goal (S5). 60% elicited another goal by using the goal structure driven strategy.
TABLE III. RECOMMENDED SECTION
Source Intention Target Intention Sequence Support
Elicit a goal Write a scenario <{5}> 0.8 Elicit a goal Elicit a goal <{2}> 0.6 Elicit a goal Write a scenario <{6}> 0.6 Elicit a goal Elicit a goal <{3}> 0.4 Elicit a goal Elicit a goal <{2},{3}> 0.4 Elicit a goal Write a scenario <{3},{5}> 0.4 Elicit a goal Elicit a goal <{4}> 0.2 Elicit a goal Write a scenario <{2},{5}> 0.2
This section illustrated how clustering and process mining techniques can be used to determine clusters and to recommend path and sections to users belonging to the same cluster. These techniques have to be used with real data from the use of the CL method or any other Map model. We will then be able to refine the clustering and process mining techniques and provide a graphical interface to display the recommendations, which is necessary when selecting a section.
Sequence Support 1 <{12}> 1.0000 2 <{1}> 1.0000 3 <{7}> 0.8750 4 <{8}> 0.7500 5 <{5}> 0.7500 6 <{6}> 0.6875 7 <{7},{12}> 0.6250 8 <{6},{7}> 0.5625 9 <{5},{7}> 0.5625
VI. CONCLUSION AND FUTURE WORKS
Following a brief state of art about trace-based systems and data and sequence mining, we proposed to integrate these techniques into the Map process metamodel. Map-TBS model allows storing traces into an IS. To illustrate our proposal, we applied it on the CL process case. We show that the indicators use and clusters elaboration improve guidance through the map navigation.
We are currently working with the humanities department of the university Paris 1 to establish a generic and flexible process model of the performed data analysis. Our objective is to propose the Map-TBS to help them with these processes.
Van der Aalst [13] establishes a typology of relations between the process model and the traces. These relations may be relations of play-out, play-in and replay. Play-out refers to the classical use of process models as it can be used both for analysis and enactment of processes. In Play-in, example behaviour is studied with the objective to construct a model. In Replay, traces are played on the process model to find discrepancies, bottlenecks, deviations, recommendations and so on.
Play-in relation. The study of humanities users activities will help identifying produced traces. They will be studied to identify a map, which will take into account all their objectives and strategies to achieve them. The resulting map will be proposed to other users to offer the wisest possible alternatives at each step. Play-in relation may be performed several times as the process followed by the users may evolve as time goes on.
Play-out relation. By visualizing their traces, users will understand the rationale behind their decisions. Why did they choose this section? Why did they take that path instead of another one? What tiny thinking took a part in these decisions? The Map model intentionality is useful as alternatives are clearly established and understandable. We hope that the study of their own traces will raise awareness and creativity.
Replay relation. One of our main goals in this project is to improve the process guidance. Once the map and a consistent set of traces are identified, we will be able to define clusters and propose path in the map following the situation at hand. These recommendations will guide the user to make decisions.
Our future research is strongly coupled with our current project with the humanities department of our university. It includes the definition of a specific process map dedicated to this domain, the validation and experimentation of the Map-TBS on this map and the study of each elaborated trace to improve the map. Another objective of our works is to enter further in the field of process mining. As a matter of fact, we would like to offer a way to define process maps following identified activities traces. This will greatly help process engineers in the definition of maps.
ACKNOWLEDGEMENT
Thanks to D. Diaz, C. Bouveyron, A. Lora-Michiels and A. Bellas from Université Paris 1 for their advices in statistics and R.
REFERENCES
[1] C. Rolland, “A Comprehensive View of Process Engineering”, CAISE’98, Springer-Verlag, 1998.
[2] M. Dowson, “Software Process Themes and Issues”, IEEE Conf. on the Software Process, 1993.
[3] P. Armenise, S. Bandinelli, C. Ghezzi, A. Morzenti, “A survey and assessment of software process representation formalisms”, Int. Journal of Software Engineering and Knowledge Engineering, vol. 3, n°3, 1993. [4] M. Jarke, K. Pohl, C. Rolland, J.R. Schmitt; “Experienced-Based
Method Evaluation and Improvement: A Process Modeling Approach”, Int. IFIP WG8. 1 Conf. in CRIS series: Method and associated Tools for the Information Systems Life Cycle, North Holland, 1994.
[5] O. Jaufman, A. Dold, T. Haeberlein, C. Schlumpberger, M. Stupperich, “Requirements for flexible software development processes within large and long taking projects”, QUATIC’04, Porto, Portugal, October 2004. [6] P. Ralph, Y. Wand, “A Teleological Process Theory of Software
Development”, in Proc. of JAIS Theory Development Workshop. Sprouts: Working Papers on Information Systems, 8, 23, 2008. [7] A. van Lamsweerde, “Reasoning About Alternative Requirements
Options”, Conceptual Modeling: Foundations and Applications, 2009. [8] D. Amyot, G. Mussbacher, “URN: Towards a New Standard for the
Visual Description of Requirements”, In proc. of 3rd Int. WS on Telecom. and beyond: the broader applicability of SDL and MSC, 2002. [9] C. Rolland, N. Prakash, A. Benjamen, “A Multi-Model View of Process
Modelling,” RE 99, vol. 4, n°4, Springer-Verlag London Ltd, 1999. [10] J.L.G. Dietz, “Basic Notions Regarding Business Processes and
Supporting Information Systems”, BPMDS’04, Latvia, Riga, 2004. [11] S. Si-Said, C. Rolland, “Formalising Guidance for the CREWS
Goal-Scenario Approach to Requirements Engineering”, In Information Modelling and Knowledge Bases, vol. 10, IOS Press, Netherlands, 1999. [12] J. Laflaquière, Conception de systèmes à base de traces numériques dans les environnements informatiques documentaires, PhD Thesis, Université de Technologie de Troyes, 2009.
[13] W.M.P. van der Aalst, Process Mining: Discovery, Conformance and Enhancement of Business Processes, Springer Verlag, 2011.
[14] Cambridge Advanced Learner's Dictionary & Thesaurus, Cambridge University Press, 2011.
[15] J. Laflaquière, L. Settouti, Y. Prié, A. Mille, “Trace-Based Framework for Experience Management and Engineering,” LNCS, vol. 4251, pp. 1171–1178, 2006.
[16] D. Clauzel, K. Sehaba, Y. Prié, “Modelling and visualising traces for reflexivity in synchronous collaborative systems,” Int. Conf. on Intelligent Networking and Collaborative Systems, IEEE, 2009. [17] L. Settouti, Y. Prié, J.-C. Marty, A. Mille, Vers des Systèmes à Base de
Traces modélisées pour les EIAH, research report, RR-LIRIS-2007-016, 2007.
[18] R. Srikant, R. Agrawal, “Mining Sequential Patterns: Generalizations and Performance Improvements”, EDBT 96, Springer-Verlag, 1996. [19] N. Prakash, C. Rolland, “Systems Design for requirements expressed as
a map,’ Proc. of the conference IRMA 06, Washington DC, 2006. [20] E. Kornyshova, R. Deneckère, B. Claudepierre, “Towards Method
Component Contextualization”, IJISMD, vol. 2, n° 4, 2011, pp. 49–81. [21] J. Kort, H. de Poot, “Usage Analysis: Combining Logging and
Qualitative Methods,” Workshop of CHI’05, 2005.
[22] C. Rolland, C. Souveyet, C. Ben Achour, “Guiding Goal Modelling Using Scenarios”, IEEE Trans.on Soft. Eng., vol. 4, n°12, 1998. [23] F. Husson, J. Josse, S. Le, J Mazet, FactoMineR, R package v. 1.16,
http://CRAN.R-project.org/package=FactoMineR, 2011.
[24] F. Husson, J. Josse, J. Pagès, « Principal component methods - hierarchical clustering - partitional clustering: why would we need to choose for visualizing data?”, technical report, 2010.
[25] http://www.r-project.org/
[26] M. J. Zaki, “SPADE: An Efficient Algorithm for Mining Frequent Sequences”, Machine Learning Journal, vol.42, pp.:31-60. Jan/Feb 2001. [27] C. Buchta, M. Hahsler, arulesSequences: Mining frequent sequences, R package v.0.1-11, http://CRAN.R-project.org/package=arulesSequences, 2010.
[28] http://www.promtools.org, Process Mining Group, Eindhoven Technical University, 2010.