HAL Id: hal-00417283
https://hal.archives-ouvertes.fr/hal-00417283
Submitted on 26 Mar 2015
HAL is a multi-disciplinary open access
archive for the deposit and dissemination of
sci-entific research documents, whether they are
pub-lished or not. The documents may come from
teaching and research institutions in France or
abroad, or from public or private research centers.
L’archive ouverte pluridisciplinaire HAL, est
destinée au dépôt et à la diffusion de documents
scientifiques de niveau recherche, publiés ou non,
émanant des établissements d’enseignement et de
recherche français ou étrangers, des laboratoires
publics ou privés.
Independent Component Analysis, a new concept?
Pierre Comon
To cite this version:
Pierre Comon. Independent Component Analysis, a new concept?. Signal Processing, Elsevier, 1994,
36, pp.287-314. �10.1016/0165-1684(94)90029-9�. �hal-00417283�
ELSEVIER Signal Processing 36 (1994) 287-314
SIGNAL
PROCESSING
Independent component analysis, A new concept?*
Pierre Comon
THOMSON-SINTRA, Parc Soph& Antipolis, BP 138, F-06561 Valbonne Cedex, France
Received 24 August 1992
Abstract
The independent component analysis (ICA) of a random vector consists of searching for a linear transformation that minimizes the statistical dependence between its components. In order to define suitable search criteria, the expansion of mutual information is utilized as a function of cumulants of increasing orders. An efficient algorithm is proposed, which allows the computation of the ICA of a data matrix within a polynomial time. The concept o f l C A may actually be seen as an extension of the principal component analysis (PCA), which can only impose independence up to the second order and, consequently, defines directions that are orthogonal. Potential applications of ICA include data analysis and compression, Bayesian detection, localization of sources, and blind identification and deconvolution.
Zusammenfassung
Die Analyse unabhfingiger Komponenten (ICA) eines Vektors beruht auf der Suche nach einer linearen Transforma- tion, die die statistische Abh~ingigkeit zwischen den Komponenten minimiert. Zur Definition geeigneter Such-Kriterien wird die Entwicklung gemeinsamer Information als Funktion von Kumulanten steigender Ordnung genutzt. Es wird ein effizienter Algorithmus vorgeschlagen, der die Berechnung der ICA ffir Datenmatrizen innerhalb einer polynomischen Zeit erlaubt. Das Konzept der ICA kann eigentlich als Erweiterung der 'Principal Component Analysis' (PCA) betrachtet werden, die nur die Unabh~ingigkeit bis zur zweiten Ordnung erzwingen kann und deshalb Richtungen definiert, die orthogonal sind. Potentielle Anwendungen der ICA beinhalten Daten-Analyse und Kompression, Bayes-Detektion, Quellenlokalisierung und blinde Identifikation und Entfaltung.
R~sum~
L'Analyse en Composantes Ind6pendantes (ICA) d'un vecteur al6atoire consiste en la recherche d'une transformation lin6aire qui minimise la d6pendance statistique entre ses composantes. Afin de d6finir des crit6res d'optimisation appropribs, on utilise un d6veloppement en s6rie de l'information mutuelle en fonction de cumulants d'ordre croissant. On propose ensuite un algorithme pratique permettant le calcul de I'ICA d'une matrice de donn6es en un temps polynomial. Le concept d'ICA peut 6tre vu en r~alitb comme une extension de l'Analyse en Composantes Principales (PCA) qui, elle, ne peut imposer l'ind6pendance qu'au second ordre et d6finit par cons6quent des directions orthogonales. Les applications potentielles de I'ICA incluent l'analyse et la compression de donn6es, la d&ection bayesienne, la localisation de sources, et l'identification et la d6convolution aveugles.
+ This work was supported in part by the DRET.
0165-1684/94/$7.00 © 1994 Elsevier Science B.V. All rights reserved
Key words: Statistical independence; Random variables; Mixture, Entropy; Information; High-order statistics; Source separation; Data analysis; Noise reduction; Blind identification; Array processing; Principal components; Independent components
1. Introduction
1.1. Problem description
This paper attempts to provide a precise defini- tion of ICA within an applicable mathematical framework. It is envisaged that this definition will provide a baseline for further development and application of the ICA concept. Assume the follow- ing linear statistical model:
y = M x + v, (1.1a)
where x , y and v are r a n d o m vectors with values in or C and with zero mean and finite covariance, M is a rectangular matrix with at most as m a n y columns as rows, and vector x has statistically independent components. The problem set by ICA m a y be summarized as follows. Given T realiz- ations of y, it is desired to estimate both matrix M and the corresponding realizations of x. H o w - ever, because of the presence of the noise v, it is in general impossible to recover exactly x. Since the noise v is assumed here to have an unknown distri- bution, it can only be treated as a nuisance, and the ICA cannot be devised for the noisy model above, Instead, it will be assumed that
y = Fz, (1.1b)
where z is a r a n d o m vector whose components are maximizing a 'contrast' function. This terminology is consistent with [31], where Gassiat introduced contrast functions in the scalar case for purposes of blind deconvolution. As defined subsequently, the contrast of a vector z is m a x i m u m when its compo- nents are statistically independent. The qualifiers 'blind' or ' m y o p i c ' are often used when only the outputs of the system considered are observed; in this framework, we are thus dealing with the prob- lem of blind identification of a linear static system.
1.2. Organization o f the paper
In this section, related works, possible applica- tions and preliminary observations regarding the problem statement are surveyed. In Section 2, gen- eral results on statistical independence are stated, and are then utilized in Section 3 to derive optim- ization criteria. The properties of these criteria are also investigated in Section 3. Section 4 is dedicated to the design of a practical algorithm, delivering a solution within a number of steps that is a poly- nomial function of the dimension of vector y. Simu- lation results are then presented in Section 5. F o r the sake of clarity, most proofs as well as a dis- cussion a b o u t complex data have been deferred to the appendix at the end of the paper.
1.3. Related works
The calculation of ICA was discussed in several recent papers [8, 16, 30, 36, 37, 61], where the problem was given various names. F o r instance, the terminology 'sources separation problem' has often been coined. Investigations reveal that the problem of 'independent c o m p o n e n t analysis' was actually first proposed and so named by Herault and Jutten around 1986 because of its similarities with princi- pal c o m p o n e n t analysis (PCA). This terminology is retained in the paper.
Herault and Jutten seem to be the first (around 1983) to have addressed the problem of ICA. Sev- eral papers by these authors propose an iterative real-time algorithm based on a neuro-mimetic architecture. The authors deserve merit in their achievement of an algorithmic solution when no theoretical explanation was available at that time. Nevertheless, their solution can show lack of con- vergence in a n u m b e r of cases. Refer to [37] and other papers in the same issue, and to [27]. In their framework, high-order statistics were not introduc- ed explicitly. It is less well known that Bar-Ness [2]
P. Comon / Signal Processing 36 (1994) 287-314 289
independently proposed another approach at the same time that presented rather similar qualities and drawbacks.
Giannakis et al. [35] addressed the issue of identifiability of ICA in 1987 in a somewhat differ- ent framework, using third-order cumulants. How- ever, the resulting algorithm required an exhaustive search. Lacoume and Ruiz [42] also sketched a mathematical approach to the problem using high-order statistics; in [29, 30], Gaeta and Lacoume proposed to estimate the mixing matrix M by maximum likelihood approach, where an exhaustive search was also necessary to determine the absolute maximum of an objective function of many variables. Thus, from a practical point of view, this was realistic only in the two-dimensional case.
Cardoso focused on the algebraic properties of the fourth-order cumulants, and interpreted them as linear operators acting on matrices. A simple case is the action on the identity yielding a cumu- lant matrix whose diagonalization gives an esti- mate of ICA [8]. When the action is defined on a set of matrices, one obtains several cumulant matrices whose joint diagonalization provides more robust estimates [55]. This is equivalent to opti- mizing a cumulant-based criterion [55], and is then similar in spirit to the approach presented herein. Other algebraic approaches, using only fourth-or- der cumulants, have also been investigated [9, 10]. In [36], Inouye proposed a solution for the sep- aration of two sources, whereas at the same time Comon [13] proposed another solution for N 7> 2. Together with Cardoso's solution, these were among the first direct (within polynomial time) solutions to the ICA problem. In [61], Inouye and his colleagues derived identifiability conditions for the ICA problem. Their Theorem 2 may be seen to have connections to earlier works [19]. On the other hand, our Theorem 11 (also presented in [15, 16]) only requires pairwise independence, which is generally weaker than the conditions required by
[61].
In [24], Fety addressed the problem of identify- ing the dynamic model of the form y(t) = Fz(t), where t is a time index. In general, the identification of these models can be completed with the help of second-order moments only, and will be called the
signal separation problem. In some cases, identifia-
bility conditions are not fulfilled, e.g. when pro- cesses z,(t) have spectra proportional to each other, so that the signal separation problem degenerates into the ICA problem, where the time coherency is ignored. Independently, the signal separation prob- lem has also been addressed more recently by Tong et al. [60].
This paper is an extended version of the confer- ence paper presented at the Chamrousse workshop in July 1991 [16]. Although most of the results were already tackled in [16], the proofs were very shortened, or not stated at all, for reasons of space. They are now detailed here, within the same frame- work. Furthermore, some new results are stated, and complementary simulations are presented.
Among other things, it is sought to give sound justification to the choice of the objective function to be maximized. The results obtained turn out to be consistent with what was heuristically proposed in [42]. Independently of [29, 30], the author pro- posed to approximate the probability density by its Edgeworth expansion [16], which has advantages over Gram-Charlier's expansion. Contrary to [29, 30], the hypothesis that odd cumulants vanish is not assumed here: Gaeta emphasized in [29] the consist- ency of the theoretical results obtained in both ap- proaches when third-order cumulants are null.
It may be considered, however, that a key contri- bution of this paper consists of providing a practi- cal algorithm that does not require an exhaustive search, but can be executed within a polynomial time, even in the presence of non-Gaussian noise. The complexity aspect is of great interest when the dimension o f y is large (at least greater than 2). On the other hand, the robustness in the presence of non-Gaussian noise has not apparently been pre- viously investigated. Various implementations of this algorithm are discussed in [12, 14, 15]; the present improved version should, however, be pre- ferred. A real-time version can also be implemented on a parallel architecture [14].
1.4. Applications
Let us spend a few lines on related applications. If x is a vector formed of N successive time samples
of a white process, and if M is Toeplitz triangular, then model (1.1) represents nothing else but a de- convolution problem. The first column of M con- tains the successive samples of the impulse response of the corresponding causal filter. In the FIR case, M is also banded. Such blind identification and/or deconvolution problems have been addressed in various ways in [5, 21, 45, 46, 50, 52, 62, 64]. Note that if M is not triangular, the filter is allowed to be non-causal. Moreover, if M is not Toeplitz, the filter is allowed to be non-stationary. Thus, blind deconvolution may be viewed as a constrained ICA problem, which is not dealt with in this paper. In fact, in the present study, no structure for matrix M will be assumed, so that blind deconvolution or other constrained ICAs cannot be efficiently car- ried out with the help of the algorithm described in Section 4, at least in its present form.
In antenna array processing, ICA might be utiliz- ed in at least two instances: firstly, the estimation of radiating sources from unknown arrays (necessarily without localization). It has already been used in radar experimentation for example [20]. In the same spirit, the use of ICA may also have some interesting features for jammer rejection or noise reduction. Secondly, ICA might be useful in a two- stage localization procedure, if arrays are perturbed or ill-calibrated. Additional experiments need, however, to be completed to confirm the advant- ages of ICA under such circumstances. On the other hand, the use of high-order statistics (HOS) in this area is of course not restricted to ICA. Regard- ing methods for sources localization, some refer- ences may be found in [8, 9, 26, 32, 47, 53, 59]. It can be expected that a two-stage procedure, con- sisting of first computing an ICA, and using the knowledge of the array manifold to perform a loc- alization in the second stage, would be more robust against calibration uncertainties. But this needs to be experimented with.
Further, ICA can be utilized in the identification of multichannel ARMA processes when the input is not observed and, in particular, for estimating the first coefficient of the model [12, 15]. In general, the first matrix coefficient is in fact either assumed to be known [33, 56, 62, 63], or of known form, e.g. triangular [35]. Note that the authors of [35] were the first to worry about the estimation of the first
coefficient of non-monic multichannel models. A survey paper is in preparation on this subject [583.
On the other hand, ICA can be used as a data preprocessing tool before Bayesian detection and classification. In fact, by a change of coordinates, the density of multichannei data may be approxim- ated by a product of marginal densities, allowing a density estimation with much shorter observa- tions [17]. Other possible applications of ICA can be found in areas where PCA is of interest. The application to the analysis of chaos is perhaps one of the most exotic [25].
1.5. Preliminary observations
Suppose x is a non-degenerate (i.e. non-deter- ministic) Gaussian random vector of dimension p with statistically independent components, and z is a vector of dimension N ~> p defined as z = Cx, where C is an N × p full rank matrix. Then if z has independent components, matrix C can easily be shown (see Appendix A.I) to be of the form
C = A Q A , (1.2)
where both A and A are real square diagonal, and Q is N × p and satisfies Q*Q = I. If N = p, A is invertible and Q is unitary; this demonstrates that if both x and z have a unit covariance matrix, then C may be any unitary matrix. Theorem 11 shows that when x has at most one Gaussian component, this indetermination reduces to a matrix of the form
DP, where D is a diagonal matrix with entries of unit modulus and P is permutation. This latter indetermination cannot be reduced further without additional assumptions.
D E F I N I T I O N 1. The ICA of a random v e c t o r y of size N with finite covariance Vy is a pair {F, A} of matrices such that
(a) the covariance factorizes into
Vy = F A 2 F *,
where A is diagonal real positive and F is full column rank p;
(b) the observation can be written as y = Fz, where z is a p × 1 random vector with covariance A 2
P. Comon / Signal Processing 36 (1994) 28~314 291
and whose components are 'the most indepen- dent possible', in the sense of the maximization of a given 'contrast function' that will be sub- sequently defined.
In this definition, the asterisk denotes transposi- tion, and complex conjugation whenever the quantity is complex (mainly the real case will be considered in this paper). The purpose of the next section will be to define such contrast functions. Since multiplying random variables by non-zero scalar factors or changing their order does not affect their statistical independence, ICA actually defines an equivalence class of decompositions rather than a single one, so that the property below holds. The definition of contrast functions will thus have to take this indeterminacy into account. P R O P E R T Y 2 . l f a pair {F, A} is an I C A o f a ran- dom vector, y, then so is the pair {F', A'} with F ' = F A D P and A ' = P * A - 1 A P ,
where .d is a p x p invertible diagonal real positive scaling matrix, D is a p x p diagonal m a t r i x with entries o f unit modulus and P is a p x p permutation. For conciseness we shall sometimes refer to the m a t r i x A = A D as the diagonal invertible 'scale' matrix.
For the sake of clarity, let us also recall the definition of PCA below.
D E F I N I T I O N 3. The PCA of a random vector y of size N with finite covariance Vy is a pair {F, A} of matrices such that
(a) the covariance factorizes into Vy = FA2F *,
where d is diagonal real positive and F is full column rank p;
(b) F is an N x p matrix whose columns are ortho- gonal to each other (i.e. F * F diagonal). Note that two different pairs can be PCAs of the same random variable y, but are also related by Property 2. Thus, PCA has exactly the same in- herent indeterminations as ICA, so that we may assume the same additional arbitrary constraints
[15]. In fast, for computational purposes, it is con- venient to define a unique representative of these equivalence classes.
D E F I N I T I O N 4. The uniqueness of ICA as well as of PCA requires imposing three additional con- straints. We have chosen to impose the following: (c) the columns of F have unit norm;
(d) the entries of d are sorted in decreasing order; (e) the entry of largest modulus in each column of
F is positive real.
Each of the constraints in Definition 4 removes one of the degrees of freedom exhibited in Property 2. More precisely, (c), (d) and (e) determine/1, P and D, respectively. With constraint (c), the matrix F de- fined in the PCA decomposition (Definition 3) is unitary. As a consequence, ICA (as well as PCA) defines a so-called p x 1 'source vector', z, satisfying
y = Fz. (1.3)
As we shall see with Theorem 1 l, the uniqueness of ICA requires z to have at most one Gaussian component.
2. Statements related to statistical independence
In this section, an appropriate contrast criterion is proposed first. Then two results are stated. It is proved that ICA is uniquely defined if at most one component of x is Gaussian, and then it is shown why pairwise independence is a sufficient measure of statistical independence in our problem.
The results presented in this paper hold true either for real or complex variables. However, some derivations would become more complicated if de- rived in the complex case. Therefore, only real vari- ables will be considered most of the time for the sake of clarity, and extensions to the complex case will be mainly addressed only in the appendix. In the remaining, plain lowercase (resp. uppercase) letters denote, in general, scalar quantities (resp. tables with at least two indices, namely matrices or tensors), whereas boldface lowercase letters denote column vectors with values in ~N.
2.1. M u t u a l information
Let x be a random variable with values in EN and denote by px(U) its probability density function (pdf). Vector x has mutually independent compo- nents if and only if
N
px(u)
: [ I p~,(u~). (2.1)i = I
So a natural way of checking whether x has independent components is to measure a distance between both sides of (2.1):
6 Px, • (2.2)
In statistics, the large class of f-divergences is of key importance among the possible distance measures available [4]. In these measures the roles played by both densities are not always symmetric, so that we are not dealing with proper distances. For instance, the Kullback divergence is defined as
(' , , ,
p,(u)
6(px, p=) = j p A u ) l o g p ~ du. (2.3)
Recall that the Kullback divergence satisfies
6(px, p:) >1 O, (2.4)
with equality if and only if pz(u)= p:(u) almost everywhere. This property is due to the convexity of the logarithm [6]. Now, if we look at the form of the Kullback divergence of (2.2), we obtain precise- ly the average mutual information of x:
f , ,, pAu)
I(px) =
jPxtU)logH~x,(u3 du, ueC N.
(2.5)From (2.4), the mutual information vanishes if and only if the variables xi are mutually independent, and is strictly positive otherwise. We shall see that this will be a good candidate as a contrast function.
2.2. Standardization
Now denote by IF N the space of random variables with values in ~N, by ~:~ the Euclidian subspace of EN spanned by variables with finite moments up to order r, for any r >t 2, provided with the scalar
product ( x , y ) = E [ x * y ] and by ~:2 N the subset of ~:~ of variables having an invertible covariance. For instance, we have E~ __ F~.
The goal of the standardization is to transform a random vector of E2 N, z, into another, ~, that has a unit covariance. But if the covariance V of vector z is not invertible, it is necessary to also perform a projection of z onto the range space of V. The standardization procedure proposed here fulfils these two tasks, and may be viewed as a mere PCA. Let z be a zero-mean random variable of n:~, V its covariance matrix and L a matrix such that
V = LL*. Matrix L could be defined by any square-root decomposition, such as Cholesky fac- torization, or a decomposition based on the eigen value decomposition (EVD), for instance. But our preference goes to the EVD because it allows one to handle easily the case of singular or ill-conditioned covariance matrices by projection. More precisely, if
V = U A 2 U * (2.6)
denotes the EVD of V, where A is full rank and U possibly rectangular, we define the square root of V as L = UA. Then we can define the standardized variable associated with z:
= A - 1U*z. (2.7)
Note that (?,)i # (zi). In fact, (zi) is merely the variable zi normalized by its variance. In the follow- ing, we shall only talk about :~i, the ith component of the standardized variable ~, so avoiding any possible confusion between the similar-looking no- tations ~:i and ~g.
Projection and standardization are thus per- --N
formed all at once if z is not in E 2 . Algorithm 18 recommends resorting to the singular value de- composition (SVD) instead of EVD in order to avoid the explicit calculation of V and to improve numerical accuracy.
Without restricting the generality we may thus consider in the remaining that the variable ob- served belongs to H:~; we additionally assume that N > 1, since otherwise the observation is scalar and the problem does not exist.
P. Comon / Signal Processing 36 (1994) 287-314 293
2.3. Negentropy, a measure of distance to normality
Define the differential entropy of x as
S(px) = - f p~(u)logpx(u)du.
(2.8)Recall that differential entropy is not the limit of Shannon's entropy defined for discrete variables; it is not invariant by an invertible change of coordinates as the entropy was, but only by orthogonal transforms. Yet, it is the usual prac- tice to still call it entropy, in short. Entropy enjoys very privileged properties as emphasized in [54], and we shall point out in Section 2.3 that informa- tion (2.5) may also be written as a difference of entropies.
As a first example, if z is in ~2 u, the entropies of z and ~: are related by [16]
S(p:) = S(p~) - ½1ogdet V. (2.9)
I f x is zero-mean Gaussian, its pdf will be referred to by the notation flax(U), with
written as:
N 1 H V/i
l(p~) = J(PI) -- ~ J(Px,) + ~log det V' (2.14) i = 1
where V denotes the variance of x (the proof is deferred to Appendix A.3). This relation gives a means of approximating the mutual information, provided we are able to approximate the negen- tropy about zero, which amounts to expanding the density PI in the neighbourhood of flax. This will be the starting point of Section 3.
For the sake of convenience, the transform F de- fined in Definition 1 will be sought in two steps. In the first step, a transform will cancel the last term of (2.14). It can be shown that this is equivalent to standardizing the data (see Appendix A.4). This step will be performed by resorting only to second- order moments of y. Then in the second step, an orthogonal transform will be computed so that the second term on the right-hand side of (2.14) is minimized while the two others remain constant. In this step, resorting to higher-order cumulants is necessary.
flax(U) = (2re) -N/2I V I - ~ / 2 e x p { - u ' V - a u } / 2 . (2.10)
Among the densities of ~:~ having a given covariance matrix V, the Gaussian density is the one which has the largest entropy. This well-known proposition says that
S(Ox) >~ S(py), Vx, ye~_~, (2.11)
with equality iff flax(u)= py(u) almost everywhere. The entropy obtained in the case of equality is
S(flax) = ½IN + Nlog(2rt) + logdet V]. (2.12)
For densities in ~_2 N, one defines the negentropy as
J(Px) = S(flax)- S(px), (2.13)
where flax stands for the Gaussian density with the same mean and variance as Px. As shown in Appen- dix A.2, negentropy is always positive, is invariant by any linear invertible change of coordinates, and vanishes if and only if p~ is Gaussian. From (2.5) and (2.13), the mutual information may be
2.4. Measures o f statistical dependence
We have shown that both the Gaussian feature and the mutual independence can be characterized with the help of negentropy. Yet, these remarks justify only in part the use of (2.14) as an optimiza- tion criterion in our problem. In fact, from Prop- erty 2, this criterion should meet the requirements given below.
D E F I N I T I O N 5. A contrast is a mapping ~u from
the set of densities { p x , x e ~ -N} to ~ satisfying the following three requirements.
- ~(Px) does not change if the components x~ are permuted:
~P(Ppx) = ~(Px), VP permutation.
- ~ is invariant by 'scale' change, that is,
7t(Pax) = q'(Px), VA diagonal invertible.
- If x has independent components, then
D E F I N I T I O N 6. A contrast will be said to be discrimina[ing over a set ~: if the equality 7J(pAx) = T(px) holds only when A is of the form
A P , as defined in Property 2, when x is a random vector of ~: having independent components.
Now we are in a position to propose a contrast criterion.
T H E O R E M 7. The following mapping is a contrast over ~_~:
T(p~) = - I(p~).
See the appendix for a proof. The criterion pro- posed in Theorem 7 is consequently admissible for ICA computation. This theoretical criterion, in- volving a generally unknown density, will be made usable by approximtions in Section 3. Regarding computational loads, the calculation of ICA may still be very heavy even after approximations, and we now turn to a theorem that theoretically ex- plains why the practical algorithm designed in Section 4, that proceeds pairwise, indeed works.
The following two lemmas are utilized in the proof of Theorem 10, and are reproduced below because of their interesting content. Refer to [18, 22] for details regarding Lemmas 8 and 9, respectively.
L E M M A 8 (Lemma of Marcinkiewicz-Dugu6
(1951)). The function q~(u)= e vtu~, where P(u) is
a polynomial o f degree m, can be a characteristic function only if m <~ 2.
L E M M A 9 (Cram6r's lemma (1936)). I f {xl, 1 <~ i <~ N } are independent random variables and if
N
X = ~,i=1 aixi is Gaussian, then all the variables
xi f o r which ai # 0 are Gaussian.
Utilizing these lemmas, it is possible to obtain the following theorem, which can be seen to be a variant of Darmois's theorem (see Appendix A.7).
T H E O R E M 10. Let x and z be two random vectors such that z = Bx, B being a given rectangular matrix. Suppose additionally that x has independent components and that z has pairwise independent corn-
ponents. I f B has two non-zero entries in the same column j, then x j is either Gaussian or deterministic.
Now we are in a position to state a theorem, from which two important corollaries can be deduced (see Appendices A.7-A.9 for proofs).
T H E O R E M 11. Let x be a vector with independent components, o f which at most one is Gaussian, and whose densities are not reduced to a point-like mass. Let C be an orthogonal N x N matrix and z the vector z = Cx. Then the following three properties are equivalent:
(i) The components zi are pairwise independent. (ii) The components zi are mutually independent. (iii) C = AP, A diagonal, P permutation.
C O R O L L A R Y 12. The contrast in Theorem 7 is discriminating over the set o f random vectors having at most one Gaussian component, in the sense o f
Definition 6.
C O R O L L A R Y 13 (Identifiability). Let no noise be
present in model ( 1 . 1 ) , and define y = M x and y = Fz, x being a random variable in some set ~_ o f ~_s 2 satisfying the requirements o f Theorem 11. Then if T is discriminant over E, T ( p z ) = T ( p x ) if only if
F = M A P , where A is an invertible diagonal matrix and P a permutation.
This last corollary is actually stating identifiabil- ity conditions of the noiseless problem. It shows in particular that for discriminating contrasts, the in- determinacy is minimal, i.e. is reduced to Property 2; and from Corollary 12, this applies to the con- trast in Theorem 7. We recognize in Corollary 13 some statements already emphasized in blind de- convolution problems [21, 52, 64], namely that a non-Gaussian random process can be recovered after convolution by a linear time-invariant stable unknown filter only up to a constant delay and a constant phase shift, which may be seen as the analogues of our indeterminations D and P in Property 2, respectively. For processes with unit variance, we find indeed that M = F D P in the co- rollary above.
P. Comon / Signal Processing 36 (1994) 287-314 295
3. O p t i m i z a t i o n criteria
3.1. Approximation of the mutual information
Suppose that we observe .~ and that we look for an orthogonal matrix Q maximizing the contrast:
~(p:) = - l(pO, where ~ = Q.~. (3.1)
In practice, the densities p~ and py are not known, so that criterion (3.1) cannot be directly utilized. The aim of this section is to express the contrast in Theorem 7 as a function of the standardized cumu- lants (of orders 3 and 4), which are quantities more easily accessible. The expression of entropy and negentropy in the scalar case will be first briefly derived. We start with the Edgeworth expansion of type A of a density. A central limit theorem says that if z is a sum of m independent random vari- ables with finite cumulants, then the ith-order cumulant of z is of order
t¢i ~ m ( 2 - i)/2.
This theorem can be traced back to 1928 and is attributed to Cram6r [65]. Referring to [39, p. 176, formula 6.49] or to [1], the Edgeworth expansion of the pdf of z up to order 4 about its best Gaussian approximate (here with zero-mean and unit vari- ance) is given by p~(u) - 1
~(u)
1 + ~.. t¢3 h3(u) 1 10 2 + ~ x , h4(u) + 6.t x3 h6(u) 1 35 + ~. t¢5 hs(u) + ~. ~c3t¢~. h7(u ) 280 + ~ t¢ 3 h9(u) 1 56 35 x2 h8(u) "t- ~.. K6 h6(u) + 8.1 x3x5 ha(u) + 8.t 2100 15400 4 + ~ ~c 2 x4 hlo(u) + ~ Ks hx2(u) + o(m- 2). (3.2)In this expression, x~ denotes the cumulant of order i of the standardized scalar variable con- sidered (this is the notation of Kendall and Stuart, not assumed subsequently in the multichannel case), and hi(u)is the Hermite polynomial of degree i, defined by the recursion
ho(u) = 1, hi(u) = u,
(3.3)
hk+ l(u) = u hk(U) -- ~u hk(U).
The key advantage of using the Edgeworth ex- pansion instead of Gram-Charlier's lies in the ordering of terms according to their decreasing significance as a function of m-1/2. In fact, in the Gram-Charlier expansion, it is impossible to en- quire into the magnitude of the various terms. See [39, 40] for general remarks on pdf expansions.
Now let us turn to the expansion of the negen- tropy defined in (2.13). The negentropy itself can be approximated by an Edgeworth-based expansion as the theorem below shows.
T H E O R E M 14. For a standardized scalar variable
Z,
7 4 J(pz) = ~ + A ~ + ~ 3
x 2 (3.4)
-- ~tC3t¢ 4 + o ( m - 2 ) .
The proof is sketched in the appendix. Next, from (2.14), the calculus of the mutual information of a standardized vector $ needs not only the mar- ginal negentropy of each component ~i but also the joint negentropy of $. Now it can be noticed that
(see the appendix)
J(PO = J(Py), (3.5)
since differential entropy is invariant by an ortho- gonal change of coordinates. Denote by Ko. ..q the cumulants Cum{~i,~ . . . ~q}. Then using (3.4) and (3.5), the mutual information of ~ takes the form, up to O(m -2) terms,
I(p~) ~ J(p~) -
1 ~ {4K2 i + K ] + 7 K ~ i 2
- - - - 6 K u i K u i } . (3.6)
Yet, cumulants satisfy a multilinearity property [7], which allows them to be called tensors [43, 44]. Denote by F the family of cumulants of j,, and by K those of ~: = Q.~. Then this property can be writ- ten at orders 3 and 4 as
Kijk : ~, QipQjqQkrFpqr, (3.7)
pqr
gljkl : ~ QipQjqQkrQtsFpqrs. (3.8)
pqrs
On the other hand, J(p~) does not depend on Q, so
that criterion (3.1) can be reduced up to order m-2 to the maximization of a functional ~:
N
tp(Q) : ~ 4K~i + K,],i + 7K~i -- 6KiiiKiiii 2 (3.9) i = i
with respect to Q, bearing in mind that the tensors K depend on Q through relations (3.7) and (3.8). Even if the mutual information has been proved to be a contrast, we are not sure that expression (3.9) is a contrast itself, since it is only approximating the mutual information. Other criteria that are con- trasts are subsequently proposed, and consist of simplifications of (3.9).
If Kiii are large enough, the expansion of J(p~)
can be performed only up to order O(m-3/2 ), yield- ing ~,(Q) = 4~K2i. On the other hand, if Kiii are all
null, (3.9) reduces to if(Q) = ~K2ii. It turns out that
these two particular forms of ~,(Q) are contrasts, as shown in the next section. Of course, they can be used even if Km are neither all large nor all null, but then they would not approximate the contrast in Theorem 7 any more.
3.2. Simpler criteria
The function ~,(Q) is actually a complicated ra- tional function in N ( N - 1)/2 variables, if indices
vary in {1, ... , N}. The goal of the remainder of the paper is to avoid exhaustive search and save com- putational time in the optimization problem, as well as propose a family of contrast functions in Theorem 16, of simpler use. The justification of these criteria is argued and is not subject to the validity of the Edgeworth expansion; in other words, it is not absolutely necessary that they ap- proximate the mutual information.
L E M M A 15. Denote by "Q the matrix obtained by raising each entry of an orthogonal matrix Q to the power r. Then we have
H
ZQu
II ~ II u II.T H E O R E M 16. The functional
N
~'(Q) = Z K2
i l . . . i , i = 1where Kii... i are marginal standardized cumulants of order r, is a contrast for any r >1 2. Moreover, for any r >>. 3, this contrast is discriminating over the set of random vectors having at most one null marginal cumulant of order r. Recall that the cumulants are functions of Q via the multilinearity relation, e.g.
(3.7) and (3.8).
The proofs are given in the appendix (see also [15] for complementary details). These contrast functions are generally less discriminating than (3.1) (i.e. discriminating over a smaller subset of random vectors). In fact, if two components have a zero cumulant of order r, the contrast in Theorem 16 fails to separate them (this is the same behaviour as for Gaussian components). However, as in The- orem 11, at most one source component is allowed to have a null cumulant.
Now, it is pertinent to notice that the quantity ~2, ~ K 2 i l i 2 . . . i r (3.10)
il . . . i t
is invariant under linear and invertible transforma- tions (cf. the appendix). This result gives, in fact, an important practical significance to contrast func- tions such as in Theorem 16. Indeed, the maximiza- tion of ~,(Q) is equivalent to the minimization of ~2 - ~,(Q), which is eventually the same as minimiz- ing the sum of the squares of all cross-cumulants of order r, and these cumulants are precisely the measure of statistical dependence at order r. An- other consequence of this invariance is that if ~/'(y) = ~(x), where x has uncorrelated compo- nents at orders involved in the definition of ~b, then y also has independent components in the same sense. A similar interpretation can be given for
P. Comon / Signal Processing 36 (1994) 28~314 297 expression (3.9) since ~3,4 = • 4K2k + K 2 u + 3KijkKijnKkqrKqr, ijklmnqr + 4KijkKimnKjmrKknr -- 6 K i j k K u m K j k t m (3.11) is also invariant under linear and invertible trans- formations [16] (see the appendix for a proof). However, on the other hand, the minimization of (3.11) does not imply individual minimization of cross-cumulants any more, due to the presence of a minus sign, among others.
The interest in maximizing the contrast in Theorem 16 rather than minimizing the cross- cumulants lies essentially in the fact that only N cumulants are involved instead of O(N'). Thus, this spares us a lot of computations when estima- ting the cumulants from the data. A first analysis of complexity was given in [15], and will be addressed in Section 4.
3.3. Link with blind identification and deconvolution
Criterion (3.9) and that in Theorem 16 may be connected with other criteria recently proposed in the literature for the blind deconvolution problem [3, 5, 21, 31, 48, 52, 64]. For instance, the criterion proposed in [52] may be seen to be equivalent to maximize ~ K , , . In [21], one of the optimization 2 criteria proposed amounts to minimizing ~S(pz,), which is consistent with (2.13), (2.14) and (3.1). In [5], the family of criteria proposed contains (3.1).
On the other hand, identification techniques presented in [35, 45, 46, 57, 63] solve a system of equations obtained by equation error matching. Although they work quite well in general, these approaches may seem arbitrary in their selection of particular equations rather than others. Moreover, their robustness is questioned in the presence of measurement noise, especially non-Gaussian, as well as for short data records. In [62] a matching in the least-squares (LS) sense is proposed; in [12] the use of much more equations than unknowns im- proves on the robustness for short data records. A more general approach is developed in [28],
where a weighted LS matching is suggested. Our equation (3.9) gives a possible justification to the process of selecting particular cumulants, by show- ing their dominance over the others. In this context, some simplifications would occur when developing (3.9) as a function of Q since the components yi are generally assumed to be identically distributed (this is not assumed in our derivations). However, the truncation in the expansion has removed the opti- mality character of criterion (3.1), whereas in the recent paper [34] asymptotic optimality is ad- dressed.
4. A practical algorithm
4.1. Pairwise processingAs suggested by Theorem 11, in order to maxi- mize (3.9) it is necessary and sufficient to consider only pairwise cumulants of ?:. The proof of Theorem 11 did not involve the contrast expression, but was valid only in the case where the observation y was effectively stemming linearly from a random vari- able x with independent components (model (1.1) in the noiseless case). It turns out that it is true for any .~ and any ?: = Q.~, and for any contrast of poly- nomial (and by extension, analytic) form in marginal cumulants of ~ as is the case in (3.9) or Theorem 16.
T H E O R E M 17. Let ~k(Q) be a polynomial in mar- ginal cumulants denoted by K. Then the equation dO = 0 imposes conditions only on components of K having two distinct indices. The same statement holds true for the condition d2O < 0.
The proof resorts to differentiation tools bor- rowed from classical analysis, and not to statistical considerations (see the appendix). The theorem says that pairwise independence is sufficient, pro- vided a contrast of polynomial form is utilized. This motivated the algorithm developed in this section. Given an N × T data matrix, Y = {y(t), 1 ~< t ~< T}, the proposed algorithm processes each pair in turn (similarly to the Jacobi algorithm in the diagonalization of symmetric real matrices); Zi: will denote the ith row of a matrix Z.
A L G O R I T H M 18
(1) Compute the SVD of the data matrix as Y = vz[J*, where Vis N x p, Z is p x p and U* is p x T, and p denotes the rank of Y. Use therefore the algorithm proposed in [11] since T is often much larger than N. Then Z = x / ~ U * and L = VZ/x//T.
(2) Initialize F = L.
(3) Begin a loop on the sweeps: k = 1, 2 . . . kmax; kmax ~< 1 + x//-p.
(4) Sweep the p(p - 1)/2 pairs (i, j), according to a fixed ordering. For each pair:
(a) estimate the required cumulants of (Zi:, Z j:), by resorting to K-statistics for instance [39, 44],
(b) find the angle a maximizing 6(Q"'J~), where Q(i,j) is the plane rotation of angle a, a ~ ] - n/4, re/4], in the plane defined by components { i, j},
(c) accumulate F : = FQ "'j)*, (e) update Z : = (2{~'J)Z.
(5) End of the loop on k if k = k . . . . or if all estim- ated angles are very small (compared to 1/T). (6) Compute the norm of the columns of F:
Aii
=II 5i II.
(7) Sort the entries of A in decreasing order: .4 : = p A p * and F : = FP*.
(8) Normalize F by the transform F : = FA-1 (9) Fix the phase (sign) of each column o f F accord-
ing to Definition 4(e). This yields F : = FD. The core of the algorithm is actually step 4(b), and as shown in [15] it can be carried out in various ways. This step becomes particularly simple when a contrast of the type given by Theorem 16 is used. Let us take for example the contrast in Theorem 16 at order 4 (a similar and less complicated reasoning can be carried out at order 3).
Step 4(b) of the algorithm maximizes the contrast in dimension 2 with respect to orthogonal trans- formations. Denote by Q the Givens rotation
1 1
0 [0
and ( = 0 - 1/0. (4.1)
Then the contrast takes the same value at 0 and - 1/0. Yet, it is a rational function of 0, so that it can be expressed as a function of variable ~ only. More precisely, we have
4
~(~) = [(2 + 4]-2 ~ bRig, (4.2)
k = 0
where coefficients b k a r e given in the appendix. Here, we have somewhat abused the notations, and write @ as a function of ~ instead of Q itself. How- ever, there is no ambiguity since 0 characterizes Q completely, and ~ determines two equivalent solutions in 0 via the equation
0 2 - ~ 0 - 1 = 0 . (4.3) Expression (4.2) extends to the case of complex observations, as demonstrated in the appendix. The maximization of (4.2) with respect to variable leads to a polynomial rooting which does not raise any difficulty, since it is of low degree (there even exists an analytical solution since the degree is strictly smaller than 5):
4
(o(~) = ~ ck~k= O. (4.4)
k = O
The exact value of coefficients Ck is also given in the appendix. Thus, step 4(b) of the algorithm consists simply of the following four steps:
- compute the roots of ~o(~) by using (A.39); - c o m p u t e the corresponding values of ~k(~)
by using (A.38);
- retain the absolute maximum; (4.5) - root Eq. (4.3) in order to get the solution 0o in the
interval ] - 1, 1].
The solution 0o corresponds to the tangent of the rotation angle. Since it is sufficient to have one representative of the equivalence class in Property 2, the solution in ] - 1, 1] suffices. Obvious real- time implementations are described in [14]. Addi- tional details on this algorithm may also be found in [15]. In particular, in the noiseless case the polynomial (4.4) degenerates and we end up with the rooting of a polynomial of degree 2 only. How- ever, it is wiser to resort to the latter simpler algo- rithm only when N = 2 [15].
P. Comon / Signal Processing 36 (1994) 287-314 299
4.2. C o n v e r g e n c e
It is easy to show [15,] that Algorithm 18 is such that the global contrast function ~O(Q) monotoni- cally increases as more and more iterations are run. Since this real positive sequence is bounded above, it must converge to a maximum. How many sweeps (kmax) should be run to reach this maximum de- pends on the data. The value of kmax has been chosen on the basis of extensive simulations: the value kmax = 1 + ~ seems to give satisfactory results. In fact, when the number of sweeps, k, reaches this value, it has been observed that the angles of all plane rotations within the last sweep were very small and that the contrast function had reached its stationary value. However, iterations can obviously be stopped earlier.
In [52,], the deconvolution algorithm proposed has been shown to suffer from spurious maxima in the noisy case. Moreover, as pointed out in [64-1, even in the noiseless case, spurious maxima may exist for data records of limited length. This phenomenon has not been observed when running ICA, but could a priori also happen. In fact, nothing ensures the absence of local maxima, at least based on the results we have presented up to now. Algorithm 18 finds a sequence of absolute maxima with respect to each plane rotation, but no argument has been found that ensures reaching the global abso- lute maximum with respect to the cumulated rotation. So it is only conjectured that this search is sufficient over the group of orthogonal matrices.
4.3. C o m p u t a t i o n a l c o m p l e x i t y
When evaluating the complexity of Algorithm 18, we shall count the number of floating point operations (flops). A flop corresponds to a multipli- cation followed by an addition. Note that the com- plexity is often assimilated to the number of multi- plications, since most of the time there are more multiplications than additions. In order to make the analysis easier, we shall assume that N and T are large, and only retain the terms of highest orders.
In step 1, the SVD of a matrix of size N x Tis to be calculated. Since T will necessarily be larger than N, it is appropriate to resort to a special technique proposed by Chan [-11-] consisting of running a Q R
factorization first. The complexity is then of
3 T N 2 - 2N3/3. Making explicit the matrix L re-
quires the multiplication of an N x p matrix by a diagonal matrix of size p. This requires an addi- tional N p flops, which is negligible with respect to
T N 2 .
In step 4(a), the five pairwise cumulants of order 4 must be calculated. If zi: and z j: are the two row vectors concerned, this may be done as follows for reasonable values of T (T > 100):
(u = zi:" zi:, termwise product T flops
(ii = z j:. z j:, termwise product T flops
~i~ = zi:. z~:, termwise product T flops
Fiiii = ( * ( , / T - 3, scalar product T + 1 flops
1]iij = ( * ( i j / T , scalar product T + 1 flops
ffiijj ~ - ( * ( j j / T - -
1, scalar product T + 1 flopsI]jjj = ( * ~ j j / T , scalar product T + 1 flops
= ~ j ( j ~ / T - 3, scalar product T + 1 flops
l~jjjj
*
(4.6)
So step 4(a) requires O(8T) flops. The polynomial rooting of step 4(b) requires O(1) flops, as well as the selection of the absolute maximum. The accu- mulation of Step 4(c) needs 4N flops because only two columns of F are changed. The update Step 4(d) is eventually calculated within 4T flops.If the loop on k is executed K times, then the complexity above is repeated O ( K p 2 / 2 ) times. Since p ~< N, we have a complexity bounded by ( 1 2 T + 4 N ) K N 2 / 2 . The remaining normalization steps require a global amount of O ( N p ) flops.
As conclusion, and if T >>N, the execution of Algorithm 18 has a complexity of
O(6KN 2 T) flops. (4.7)
In order to compare this with usual algorithms in numerical analysis, let us take realistic examples. If T = O(N 2) and K = O(N1/2), the global complex- ity is O(N9/2), and if T = O(N3/2), we get O(N 4) flops. These orders of magnitude may be compared
to usual complexities in O(N 3) of most matrix factorizations.
The other algorithm at our disposal to compute the ICA within a polynomial time is the one pro- posed by Cardoso (refer to [10] and the references therein). The fastest version requires O ( N 5) flops, if all cumulants of the observations are available and if N sources are present with a high signal to noise ratio. On the other hand, there are O(N4/24) differ- ent cumulants in this 'supersymmetric' tensor. Since estimating one cumulant needs O(~T) flops, 1 < c~ ~< 2, we have to take into account an addi- tional complexity of O(aN4T/24). In this operator- based approach, the computation of the cumulant tensor is the task that is the most computationally heavy. F o r T = O ( N 2) for instance, the global complexity of this approach is roughly O(N6).
Even for T = O(N), which is too small, we get a complexity of O(NS). Note that this is always larger than (4.9). The reason for this is that only pairwise cumulants are utilized in our algorithm.
Lastly, one could think of using the multilinear- ity relation (3.8) to calculate the five cumulants required in step 4(a). This indeed requires little computational means, but needs all input cumu- lants to be known, exactly as in Cardoso's method above. The computational burden is then domin- ated by the computation of input cumulants and represents O ( T N 4) flops.
5. S i m u l a t i o n results
5.1. Performance criterion
In this section, the behaviour of ICA in the pres- ence of non-Gaussian noise is investigated by means of simulations. We first need to define a dis- tance between matrices modulo a multiplicative factor of the form AP, where A is diagonal invert- ible and P is a permutation. Let A and A be two invertible matrices, and define the matrices with unit-norm columns
A = AA -1, A = A z ] -1,
with A~k = IIa:kll, ARk = IIm:kll-
The gap ~(A, .4) is built from the matrix D = A - 1A
as
+ ~ . ~ I D i , I 2 - 1 + ~ ~. I D i , 1 2 - 1 . (5.1) It is shown in the appendix that this measure of distance is indeed invariant by postmultiplication by a matrix of the form AP:
e(AAP, .,4) = e(A, A A P ) = e(A, 4). (5.2) Moreover, ~(A, ,4) = 0 if and only ifA and A can be deduced from each other by multiplication by a factor AP:
e(A, ,4) = 0 , ~ A = A A P . (5.3)
5.2. Behaviour in the presence o f non-Gaussian noise when N = 2
Consider the observations in dimension N for realization t:
y(t) = (1 - I~)Mx(t) + pflw(t), (5.4)
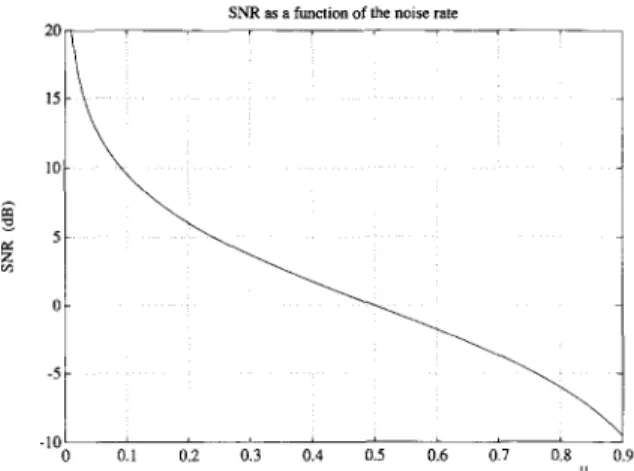
where 1 ~< t ~< T, x a n d w are zero-mean standard- ized random variables uniformly distributed in [ - x ~ , x ~ ] (and thus have a kurtosis of - 1.2), p is a positive real parameter of [0, 1] and
/~ = II M [1/111 II, [1' II denoting the L 2 matrix norm
(the largest singular value). Then when p ranges from 0 to 1, the signal to noise kurtosis ratio de- creases from infinity to zero. Since x and w have the same statistics, the signal to noise ratio can be indifferently defined at orders 2 or 4. One may assume the following as a definition of the signal to noise ratio (see Fig. 1):
In this section we assume N = 2 and
M = - 3 " SNRdB = 101oglo 1 - p
P. Comon / Signal Processing 36 (1994) 287-314 301
x
vd,
yFig. 1. Identification block diagram. We have in particular
y = Fz = LQ*(P*A ID)z. The matrix (P*A-1D) is optional
and serves to determine uniquely a representative of the equiva- lence class of solutions.
0.45 M e a n o f g a p N=2 ~ - - 0.4 T = 100, v=240 . . . T = 140, v=171 //,/" 0.35 T = 200, v = 120 j , / _ T = 500, v=48 / / / , , , ~ . . . 0.25 0.2 0.15
o.1
_ i
- i i / / i 0.05il/.
0 0.1 0.2 0.3 0.4 0.5 0.6 0.7 0.8 tt 0.9Fig. 2. Average values of the gap ~ between the true mixmg matrix M and the estimated one, F, as a function of the noise rate and for various data lengths. Here the dimension is N = 2, and averages are computed over v trials.
W e represent in Figs. 2 - 4 the b e h a v i o u r of Algo- rithm 18 w h e n the contrast in T h e o r e m 16 is used at order r = 4 (which also c o i n c i d e s with (3.9) since the densities are s y m m e t r i c a l l y distributed in this simulation). The m e a n of the error e defined in (5.1) has been plotted as a function of # in Fig. 2, and as a function of T in Fig. 3. The m e a n was calculated o v e r a n u m b e r v of averagings (indicated in Fig. 2)
c h o s e n so that the product v T is constant:
v T ~ 2 4 0 0 0 . The curves presented in Fig. 2 have
been calculated for/~ ranging f r o m 0 to 1 by steps of 0.02. Fig. 4 s h o w s the standard deviations of e ob- tained with the s a m e data. A similar s i m u l a t i o n was presented in [ 1 6 ] , where signal and noise had dif- ferent kurtosis. 0.25 0.2 0.15 0.1 0.05 0 0.45 N=2 0 . 4= ~. 0.35 0.3 = 100 200 300 400 500 600 700 800 900 1000 T
Fig. 3. Average values of the gap ~ as a function of the data length Tand for various noise rates/~. The dimension is N = 2.
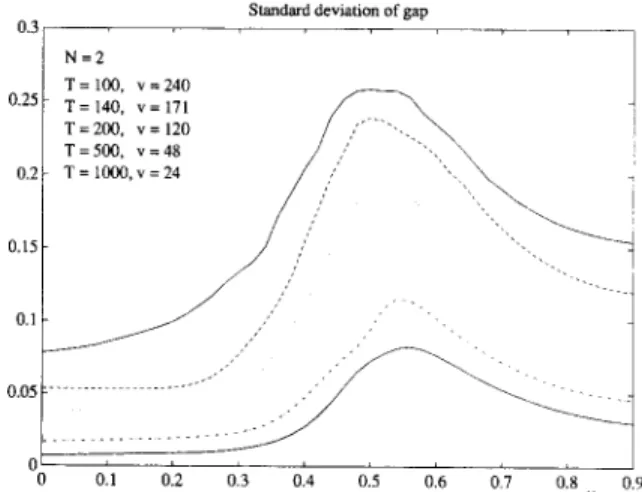
0.3 S t a n d a r d d e v i a t i o n o f g a p 0.25 0.2 0.15 0.1 0.05 . . . . 0 N=2 T = 100, v=240 T = 140, v=171 T=200, v= 120 / ,/ . . . T = 500, v = 48 / , '-., = , = /,// "'" ',, 0.1 0.2 0.3 0.4 0.5 0.6 0.7 0.8 0.9
Fig. 4. Standard deviations of the gap *: for the same input and output data as for Fig. 2.
M o s t surprising in these s i m u l a t i o n s in the excel- lent b e h a v i o u r of I C A even in the close neighbour- h o o d o f / a = 0.5 (viz. 0 dB); keep in m i n d that the #-scale is z o o m i n g a b o u t 0 dB (according to Fig. 9, an S N R of 1 dB c o r r e s p o n d s to /~ = 0.44 for example). The exact value of p for which the ICA remains interesting depends on the integration length T. In fact, the shorter the T, the larger the apparent noise, since e s t i m a t i o n errors are also seen by the algorithm as e x t r a n e o u s noise. In Fig. 3, for instance, it can be noticed that the calculation of I C A with T = I00 in the noiseless case is about as g o o d as with T = 300 w h e n # = 0.4. For larger
values of/~, the ICA algorithm considers the vector M x as a noise and the vector I~flw as a source vector. Because w has independent components, it could be checked out conversely that e(I, F) tends to zero as p tends to one, showing that matrix F is approaching AP.
5.3. Behaviour in the noiseless case when N > 2 Another interesting experiment is to look at the influence of the choice of the sweeping strategy on the convergence of the algorithm. For this purpose, consider now t0 independent sources. In Algorithm 18, the pairs are described according to a standard cyclic-by-rows ordering, but any other ordering may be utilized. To see the influence of this order- ing without modifying the code, we have changed the order of the source kurtosis. In ordering 1, the source kurtosis are
180 160 140 120 1(30 80 60 40 20 0
i
ii,
=10 Gap 20 40 60 80 100 120 140 160Number of pairs processed
Fig. 5. G a p between the true mixing matrix M and the estim- ated one, F, as a function of the n u m b e r of iterations. These are asymptotic results, i.e. the data length may be considered infi- nite. Solid and dashed lines correspond to three different order- ings. The dimension is N = 10.
E1 - 1 1 - 1 1.5 - 1 . 5 2 - 2 1 - 1 ] (5.6) whereas in ordering 2 and 3 they are, respectively, [1 2 1.5 1 1 - 1 - 1 . 5 - 2 - 1 - 1 ]
and (5.7)
[1 1 1.5 2 1 - 1 - 1 . 5 - 1 - 1 - 2 ] .
The presence of cumulants of opposite signs does not raise any obstacle, as well as the presence of at most one null cumulant as shown in [16]. The mixing matrix, M, is Toeplitz circulant with the vector
[-3 0 2 1 - 1 1 0 1 - 1 - 2 ] (5.8) as first row.
No noise is present. This simulation is performed directly from cumulants, using unavoidably the procedure described in the last paragraph of Sec- tion 4.3, so that the performances are those that would be obtained for T = ~ with real-world sig- nals (see Appendix A.21). The contrast utilized is that in Theorem 16 with r = 4. The evolution of gap e between the original matrix, M, and the estimated matrix, F, is plotted in Fig. 5 for the three orderings, as a function of the number of Givens rotations computed. Observe that the gap .e is not necessarily monotonically decreasing, whereas the contrast always is, by construction of the algo-
20 Contrast N=IO .-' ~ f J / , . ,,"// ()y-' 0 20 40 60 80 100 120 140 160
Number of pairs processed
Fig. 6. Evolution of the contrast function as more and more iterations are performed, in the same problem as shown in Fig. 5, with the same three ordefings.
rithm. For convenience, the contrast is also repres- ented in Fig. 6. The contrast reaches a stationary value of 18.5 around the 90th iteration, that is at the end of the second sweep. It can be noticed that this corresponds precisely to the sum of the squares of source cumulants (5.6), showing that the upper bound is indeed reached. Readers desiring to pro- gram the ICA should pay attention to the fact that
P. Comon / Signal Processing 36 (1994) 287 314 the speed of convergence can d e p e n d on the stan-
d a r d i z a t i o n code (e.g. c h a n g i n g the sign of a singular vector can affect the b e h a v i o u r of the convergence).
It is clear that the values of source kurtosis can have an influence on the convergence speed, as in the Jacobi a l g o r i t h m ( p r o v i d e d they are n o t all equal of course). In the latter algorithm, it is well k n o w n that the convergence can be speeded up by processing the pair for which n o n - d i a g o n a l terms are the largest. Here, the difference is that cross- terms are n o t explicitly given. Consequently, even if this strategy could also be applied to the diagonal- ization of the tensor cumulant, the c o m p u t a t i o n of all pairwise c r o s s - c u m u l a n t s at each iteration is necessary. We w o u l d eventually loose m o r e in c o m - plexity than we would gain in convergence speed.
5.4. Behaviour in the presence o f noise when N > 2 N o w , it is interesting to perform the same experi- ment as in Section 5.2, but for values of N larger than 2. We again take the experiment described by (5.4). T h e c o m p o n e n t s of x a n d w are again inde- pendent r a n d o m variables identically a n d uniform- ly distributed in [ - x/3, x f 3 ] , as in Section 5.2. In Fig. 7, we report the gap e that we obtain for N = 10. T h e matrix M was in this example again the Toeplitz circulant matrix of Section 5.3 with a first r o w defined by
[3 0 2 1 - 1 1 0 1 - 1 - 2 ] .
It m a y be observed in Fig. 7 that an integration length of T = 100 is insufficient when N = 10 (even in the noiseless case), whereas T = 500 is accept- able. F o r T = 100, the gap e s h o w e d a very high variance, so that the t o p solid curve is subject to i m p o r t a n t errors (see the s t a n d a r d deviations in Fig. 8); the n u m b e r v of trials was indeed only 50 for reasons of c o m p u t a t i o n a l complexity. As in the case of N = 2 and for larger values of T, the in- crease of e is quite sudden when # increases. W i t h a logarithmic scale (in dB), the sudden increase would be even m u c h steeper. After inspection, the I C A can be c o m p u t e d with A l g o r i t h m 18 up to signal to noise ratios of a b o u t + 2 dB (# = 0.35)
90 80 70 60 50 i 4o! 30 20 10 O" 303
Fig. 7. Averages of the gap e between the true mixing matrix M and the estimated one, F, as a function of the noise rate and for various data lengths, T. Here the dimension is N = 10. Notice the gap is small below a 2dB kurtosis signal to noise ratio (rate # = 0.35) for a sufficient data length. The bottom solid curve corresponds to ultimate performances with infinite integ- ration length. 30 25 20 15 10' N=10 / T = 100, v=50 T = 500, v=10 / T= 1000, v = 10 T = 5000, v = 2 / / .___. o ~ / / 0.1 0.2 0.3
Standard deviation of gap
. . a . o "'""'-,..
014 0.5 0.6 0.7
g Fig. 8. Standard deviations of the gap e obtained for integration length T and computed over v trials, for the same data as for Fig. 7.
for integration lengths of the o r d e r of 1000 samples. The c o n t i n u o u s b o t t o m solid curve in Fig. 7 shows the performances that would be obtained for infi- nite integration length. In order to c o m p u t e the
Mean o! gap N = 1 0 ~ ' T= 100, v = 5 0 T = 500, v = 1 0 T = 1000, v = 10 T = 5000, v = 2 ?~?2~-_?L " " " " "~' 0.1 0.2 0.3 0.4 0.5 0.6 0.7 II