HAL Id: cea-01001650
https://hal-cea.archives-ouvertes.fr/cea-01001650
Submitted on 26 Sep 2019
HAL is a multi-disciplinary open access
archive for the deposit and dissemination of
sci-entific research documents, whether they are
pub-lished or not. The documents may come from
teaching and research institutions in France or
abroad, or from public or private research centers.
L’archive ouverte pluridisciplinaire HAL, est
destinée au dépôt et à la diffusion de documents
scientifiques de niveau recherche, publiés ou non,
émanant des établissements d’enseignement et de
recherche français ou étrangers, des laboratoires
publics ou privés.
A mature cluster with X-ray emission at z=2.07
R. Gobat, Emanuele Daddi, M. Onodera, A. Finoguenov, A. Renzini, N.
Arimoto, R. Bouwens, M. Brusa, R. -R. Chary, Alessandro Cimatti, et al.
To cite this version:
R. Gobat, Emanuele Daddi, M. Onodera, A. Finoguenov, A. Renzini, et al.. A mature cluster with
X-ray emission at z=2.07. Astronomy and Astrophysics - A&A, EDP Sciences, 2011, 526, pp.A133.
�10.1051/0004-6361/201016084�. �cea-01001650�
arXiv:1011.1837v2 [astro-ph.CO] 10 Dec 2010
Astronomy & Astrophysicsmanuscript no. rgobat˙z2clu c ESO 2018 October 18, 2018
A mature cluster with X-ray emission at
z = 2
.
07
R. Gobat
1, E. Daddi
1, M. Onodera
2, A. Finoguenov
3, A. Renzini
4, N. Arimoto
5,6, R. Bouwens
7, M. Brusa
3, R.-R.
Chary
8, A. Cimatti
9, M. Dickinson
10, X. Kong
11, and M. Mignoli
121 Laboratoire AIM-Paris-Saclay, CEA/DSM-CNRS–Universit´e Paris Diderot, Irfu/Service d’Astrophysique, CEA Saclay, Orme des
Merisiers, F-91191 Gif-sur-Yvette, France
2 Institute for Astronomy, ETH Z¨urich, Wolfgang-Pauli-strasse 27, 8093 Z¨urich, Switzerland 3 Max-Planck-Institut f¨ur extraterrestrische Physik, Giessenbachstrasse, 85748 Garching, Germany 4 INAF - Osservatorio Astronomico di Padova, Vicolo dell’Osservatorio 5, I-35122 Padova, Italy 5 National Astronomical Observatory of Japan, Osawa 2-21-1, Mitaka, Tokyo, Japan
6 Graduate University for Advanced Studies, Osawa 2-21-1, Mitaka, Tokyo, Japan 7 UCO/Lick Observatory, University of California, Santa Cruz, CA 95064, USA
8 Division of Physics, Mathematics and Astronomy, California Institute of Technology, Pasadena, CA 91125, USA 9 Universit`a di Bologna, Dipartimento di Astronomia, Via Ranzani 1, I-40127 Bologna, Italy
10 National Optical Astronomy Observatory, P.O. Box 26732, Tucson, AZ 85726, USA
11 Center for Astrophysics, University of Science and Technology of China, Hefei 230026, China 12 INAF - Osservatorio Astronomico di Bologna, via Ranzani 1, I-40127 Bologna, Italy
Received 08 November 2010 / Accepted 16 November 2010
ABSTRACT
We report evidence of a fully established galaxy cluster at z = 2.07, consisting of a ∼ 20σ overdensity of red, compact spheroidal galaxies spatially coinciding with extended X-ray emission detected with XMM-Newton. We use VLT VIMOS and FORS2 spectra and deep Subaru, VLT and Spitzer imaging to estimate the redshift of the structure from a prominent z = 2.07 spectroscopic redshift spike of emission-line galaxies, concordant with the accurate 12-band photometric redshifts of the red galaxies. Using NICMOS and Keck AO observations, we find that the red galaxies have elliptical morphologies and compact cores. While they do not form a tight red sequence, their colours are consistent with that of a & 1.3 Gyr population observed at z ∼ 2.1. From an X-ray luminosity of 7.2 × 1043erg s−1and the stellar mass content of the red galaxy population, we estimate a halo mass of 5.3–8×10¹³M
⊙, comparable
to the nearby Virgo cluster. These properties imply that this structure could be the most distant, mature cluster known to date and that X-ray luminous, elliptical-dominated clusters are already forming at substantially earlier epochs than previously known.
Key words.Galaxies:clusters:general – Galaxies:clusters:individual:CL J1449-0856 – Galaxies:high-redshift – large-scale structure of the Universe
1. Introduction
Massive clusters are rare structures in the distant Universe, arising from the gravitational collapse of the highest den-sity peaks in the primordial spectrum of denden-sity fluctuations (Peebles 1993, Coles & Lucchin 1995, Peacock 1999). Their abundance reflects the original state of the matter density field and depends on fundamental cosmological parameters, such as the shape and normalisation of the matter power spectrum (e.g. Press & Schechter 1974, Haiman et al. 2001, Schuecker et al. 2003). Measuring the distribution of galaxy clusters can thus place constraints on these cosmological parameters and provide a powerful test of primordial non-Gaussianities (Jimenez & Verde 2009, Cay ´on et al. 2010, Schuecker et al. 2002). As the largest and most massive bound structures in the Universe, galaxy clusters are also the most biased environment for galaxy evolution and constitute a prime laboratory for studying the physical processes responsible for the formation and evolution of galaxies (e.g. Boselli & Gavazzi 2006, Park & Hwang 2009, Demarco et al. 2010). The strong dependence of galaxy activity on the surrounding environment, which gives rise to the well-known correlations of morphological type (Postman et al. 2005, Hwang & Park 2009, van der Wel et al. 2010) and
decreas-ing star formation (Hashimoto et al. 1998, Patel et al. 2009, Rettura et al. 2010, Peng et al. 2010) with increasing galaxy density, is most easily and dramatically illustrated in the extremely dense cores of local massive galaxy clusters.
But while, about 13.7 Gyr after the Big Bang, today’s galaxies, baryons and dark matter continue to steadily fall into the massive clusters’ potential wells, the elliptical galaxies that dominate their cores ceased forming stars early on and have been evolving passively for most of cosmological his-tory. The traces of the formation process of present cluster ellipticals thus smeared out, their co-evolution with the cluster cores and the assembly history of the latter can hardly be reconstructed from low redshift data alone. Furthermore, the thermodynamical properties of the baryons in the intergalactic medium of clusters (ICM) suggest that ∼ 1 keV more energy per baryon was injected into the ICM than can be accounted for by pure gravitational collapse (Ponman et al. 1999). This excess entropy was generated presumably by galactic winds powered by either supernovae or AGN, but the exact processes have not yet been identified. It is also unclear when the correlation between the mass, X-ray luminosity and temperature of the ICM, crucial for the use of clusters as cosmological tools, were first in place. The question of the assembly of clusters, the
settling and thermodynamical evolution of the X-ray shining ICM within their deep potential wells and the build-up of their constituent galaxy population must then be addressed by looking as closely as possible at the early stages of their for-mation (Voit 2005, Ponman et al. 1999, Rosati et al. 2002). This formative epoch is often put at z & 2, as supported by evidence found in recent years of increased activity (Elbaz et al. 2007, Hayashi et al. 2010, Hilton et al. 2010, Tran et al. 2010) and steeper age gradients (Rosati et al. 2009) in clusters and over-dense regions at z ∼ 1 − 1.6.
The most successful method so far for finding high-redshift galaxy clusters has been through X-ray searches, archival or ded-icated (Rosati et al. 1998, Romer et al. 2001, Pierre et al. 2003). Their depth is however constrained by the sensitivity of current observing facilities, which limits their effectiveness at higher redshifts. Colour selection techniques, on the other hand, can be used to efficiently search for clusters up to z . 2 (Gladders & Yee 2000, Wilson et al. 2008) and passive galaxy populations at even higher redshift (Kodama et al. 2007). Finally, galaxy clusters might also be serendipitously discov-ered as spatial or redshift overdensities. The X-ray approach naturally selects massive and evolved structures, while red-sequence surveys are designed to search for a distinctive evolved galaxy population. Indeed, z & 1 X-ray and colour-selected structures are spatially compact and dominated by massive early-type galaxies, as their local counterparts (Blakeslee et al. 2003, Mullis et al. 2005, Stanford et al. 2006, Papovich et al. 2010, Tanaka et al. 2010, Henry et al. 2010, Kurk et al. 2009). In contrast, at z > 2 the search for clusters and their precursors has focused on finding overdensi-ties, often around radiogalaxies, of emission-line objects (Francis et al. 1996, Pentericci et al. 1997, Miley et al. 2006, Steidel et al. 2005, Overzier et al. 2006), in particular Lyα emitters. Accordingly, high-density structures at z > 2 are char-acterised by a high level of star formation activity and mostly lack the extended X-ray emission and conspicuous early-type galaxy population typical of the evolved clusters. On the other hand, if the concentrations of Lyα emitters reported at z > 3 (Steidel et al. 2000, Daddi et al. 2009, Overzier et al. 2008) are proto-cluster structures destined to evolve into the massive X-ray clusters observed at lower redshift, we should expect to find young yet already mature clusters at z ∼ 2 − 2.5. However, whereas analogues to local massive clusters are known up to
z = 1.5–1.7, evolved early-type dominated and X-ray emitting
clusters have not been found so far at earlier epochs, nor has an “intermediate” structure been observed at (or right after) the moment of quenching of star formation in its core galaxies.
Here we present the discovery of CL J1449+0856, a con-spicuous galaxy overdensity at z = 2.07, dominated by mas-sive pasmas-sively evolving galaxies and consistent with being the most distant X-ray detected galaxy cluster identified to date. In Section 2, we describe the target selection and photometric ob-servations. In Section 3, we present the high resolution imag-ing and morphological analysis of galaxies in the core and in Section 4 we discuss the spectroscopic observations and red-shift confirmation of the cluster. In Section 5, we discuss the X-ray observations of the cluster and their analysis, while in Section 6 we compare CL J1449+0856 to other high-redshift structures. In Section 7, we discuss its global properties and their implications for cosmology and Section 8 summarises our results. Unless specified otherwise, all magnitudes are reported
in the AB system and we adopt a concordance cosmology with
H = 70 km s−1Mpc−1, Ωm= 0.3 and Λ = 0.7.
2. Imaging and sample selection
The structure was first identified, in archival Spitzer im-ages covering 342 arcmin2 of the so-called “Daddi Field”
(Daddi et al. 2000), as a remarkable overdensity of galaxies with IRAC colours [3.6] − [4.5] > 0 at the position RA = 14h 49m 14s and DEC = 8◦ 56’ 21”, indicating a massive structure at
z > 1.5. Optical-NIR imaging data of this field was already
avail-able from a multi-band survey in the B, R, I, z, and Ksbands, the
latter somewhat shallow. These data and their reduction are de-scribed in Kong et al. 2006 and Daddi et al. 2000. Between 2007 and 2010, we obtained new deep imaging of this overdensity in the Y, J, H, and Ksbands with MOIRCS on the Subaru telescope
and in the J and Ks bands with ISAAC on the VLT. For the
purpose of studying galaxy morphology, we also obtained deep
F160W imaging of the overdensity with NIC3 on Hubble and
a shallow but high resolution K-band image using NIRC2 with adaptive optics on Keck. These two images were not used in the making of the photometric catalogue and their analysis is de-scribed in Section 3. In addition to the archival Spitzer/IRAC images, archival 24 µm data taken with Spitzer/MIPS were also available. We mention them for completeness but discuss them only briefly here, as they will be included in a future analysis of the galaxy population of the structure. Finally, X-ray observa-tions of the field were also available and are described in Section 5. Details of the imaging observations are given in Table 1.
The combined B, R, I, z, Y, J, H, and Ks observations reach
5σ limiting magnitudes of 26.95, 26.18, 26.03, 25.81, 25.64, 25.47, 23.66 and 24.74 respectively. Catalogues were made for each band with SExtractor (Bertin & Arnouts 1996) using 2”-diameter apertures and later merged. The final catalogue covers an area of 4′×7′, corresponding to the field of view of MOIRCS. As the galaxies with [3.6] − [4.5] > 0 are better detected in the Y-band image than in the z and B-band images, and since Y straddles the 4000 Å break at z = 1.5, we do not rely on the traditional BzK criterion (Daddi et al. 2004) to select for passively evolving galaxies at z > 1.5 but instead use
Y − Ks > 2, the expected colour of such a galaxy population.
Out of 1291 objects in the combined catalogue with Ks<24.74,
we find 114 red galaxies with Y − Ks>2. We note that only 11
of those are detected at 5σ in B and 41 in z.
The distribution of red galaxies shows a strong over-density at the same position as the IRAC-selected one. To characterise the overdensity, we created a number density map by dividing the MOIRCS field into a grid of sub-arcsecond cells and computing for each element the density estimator
ΣN ≡N/πr2
N, where rN is the distance to the Nth nearest galaxy
with Y − Ks >2. We considered N = 3 − 7, which changed the
angular resolution of the map but produced consistent results. The MOIRCS detector consists of two chips, one of which was centred on the overdensity and the other thus providing a low-density field. In the near-infrared images, the visible overdensity defines a 20”×10” semi-axis elliptical area. We find that, in this 20” region centred on the structure, the mean density is 20σ above the field, with ∼ 100 galaxies arcmin−2 in the
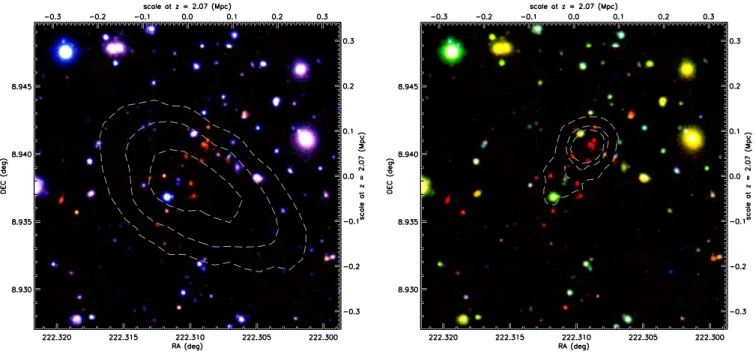
overdensity versus five in the field. The density of this structure is thus similar to that reported for the recently discovered galaxy cluster at z = 1.62 (Papovich et al. 2010). Fig. 1 shows two colour images of the overdensity, with contours represent-ing X-ray intensity and galaxy density, respectively, while Fig.
Gobat et al.: An old cluster in the young Universe
Fig. 1. RGB composite colour images of the 1.4’×1.4’ field centred on the galaxy overdensity. The R channel of both images
corresponds to the Ksband; the G and B channels corresponds to the J and z bands in the left image and to the B and z bands in the
right one. The B and z images were taken using the Suprime-Cam instrument on the Subaru telescope while the J and Ksimages are
a composite of MOIRCS and ISAAC data, on the Subaru and VLT observatories. The BzKsimage shows how the red galaxies are
basically unseen at optical wavelengths. On the left, the white overlapping contours show the 1, 2, and 3σ significance levels of the diffuse X-ray emission in the XMM-Newton image, after subtraction of a point source seen in the Chandra image and smoothing with a 8” radius PSF (as described in Section 5). On the right, they show the 10, 20, and 30σ levels above the background galaxy number density, computed using the Σ5estimator.
Fig. 2. Surface density of galaxies with Y − Ks>2 in the whole MOIRCS field, in units of galaxies arcmin−2as measured by the Σ5
Filter Central wavelength (µm) Exposure (s) 5σ limit (mag) Instrument Telescope Observation date
B 0.44 1500 26.95 Suprime-Cam Subaru 2003 Mar 5
R 0.65 3600 26.18 Suprime-Cam WHT 1998 May 19-21
I 0.80 1800 26.03 Suprime-Cam Subaru 2003 Mar 5
z 0.91 2610 25.81 Suprime-Cam Subaru 2003 Mar 4-5
Y 1.02 17780 25.64 MOIRCS Subaru 2009 Mar 15, 2010 Feb 7-8, 21
J 1.26 9360 25.47 MOIRCS+ISAAC Subaru+VLT 2007 Mar 10, Apr 5
F160W 1.60 17920 NIC3 HST 2008 May 11
H 1.65 2380 23.66 MOIRCS Subaru 2007 Apr 8
K 2.15 1890 NIRC2 Keck 2009 Apr 4
Ks 2.20 7800 24.74 MOIRCS+ISAAC Subaru+VLT 2007 Mar 8, Apr 5 IRAC 1 3.6 480 23.85 IRAC Spitzer 2004 Jul 22 IRAC 2 4.5 480 23.08 IRAC Spitzer 2004 Jul 22 IRAC 3 5.8 480 21.44 IRAC Spitzer 2004 Jul 22 IRAC 4 8.0 480 20.02 IRAC Spitzer 2004 Jul 22 MIPS 24 24 480 80 µJy MIPS Spitzer 2004 Aug 5 0.5-10 keV 80000 EPIC-MOS XMM-Newton 2001-2003 0.5-8 keV 80000 ACIS Chandra 2004 Jun 7-13
Table 1. Details of the optical, near-IR photometric and X-ray observations. The B, R, I and z-band data have already been described
in a previous paper (Kong et al. 2006). The XMM and Chandra data have also been described in other papers (Brusa et al. 2005, Campisi et al. 2009). The raw IRAC and MIPS data were taken from the archive and reduced using MOPEX and custom scripts.
2 shows the number density of red galaxies in the MOIRCS field.
3. High resolution imaging and galaxy morphology Very dusty star-forming galaxies at high redshift can have red colours similar to those expected for elliptical galaxies. While a complete morphological study of galaxies in the overdensity will be the subject of a future publication, we carried out here a first-order analysis to assess the nature of the red galaxies. We used H-band observations carried out with NICMOS-3 on Hubble, which provides the required sensitivity and spatial res-olution to unveil the morphology of the red galaxies, as well as AO-assisted ground-based imaging with NIRC2 on Keck. The NIC3 data were taken during seven orbits of Hubble. The individual frames were reduced using the NICRED pipeline (Magee, Bouwens & Illingworth 2007), which we found pro-vides a better calibration than the standard pipeline. In particular, the background noise varies less in the NICRED-reduced im-ages, which is critical to the morphological analysis as it allows us to recover the extended luminosity profile of faint galaxies. The individual frames were then combined using Multidrizzle (Koekemoer et al. 2002). The useful area of the NIC3 image, where the noise is low enough for the morphological analysis, is 45”×50”, covering the overdensity and its immediate surround-ings.
The galaxies in this image were first matched with the catalogue and their surface brightness profiles modelled with a S´ersic law (∝ r1/n; S´ersic 1963) using GALFIT (Peng et al. 2002) and the single star in the NIC3 field as PSF. We fitted both the red (Y − Ks > 2) and blue (Y − Ks < 2)
galaxies. For the latter, we used the BzK criterion to select for star-forming galaxies at z > 1.4: there are 352 sBzK-selected galaxies in the catalogue detected at 5σ in all three bands, of which ten are found in the NIC3 image. In that same field, we find 16 red galaxies. Fig. 3 shows the NIC3 image and the results of the S´ersic fit: of those 16 red galaxies, five are unresolved (i.e. have an effective radius of one pixel or less; labelled “compact” in Fig. 3) and the rest have n > 4, whereas three of the ten blue galaxies are unresolved, two have n & 3, and the rest n . 2.
The NIRC2 image covers a similar area to the NIC3 image, but is rather shallow, having been taken during an unrelated ob-servation, and only the brightest galaxy cores are visible. It
how-ever provides a good first-order verification of the S´ersic mod-elling. Because of its combination of shallowness and very high resolution, the objects visible in the NIRC2 image either would be intrinsically bright or, in the case of faint galaxies like those in the overdensity, have a high surface brightness, similar to that of compact cores. Fig. 4 compares the NIRC2 and NIC3 im-ages. We find that, of the 13 red galaxies in the useful area of the NIRC2 image, eight are distinctly visible as very compact sources, supporting the results of the S´ersic modelling. None of the sBzK galaxies rises above the noise of the NIRC2 image. The rest of the visible objects are obvious interlopers, low red-shift galaxies (colour- and angular size-wise) and a star.
The galaxy overdensity is thus clearly dominated by spheroidal galaxies, as in local massive clusters. We note that more than half of these galaxies have re>2 kpc and thus appear
less dense than previously studied passive galaxies at z > 2 (Toft et al. 2007). A thorough discussion of the stellar mass-size relation will be presented in a future paper.
4. Spectroscopic observations and redshift determination
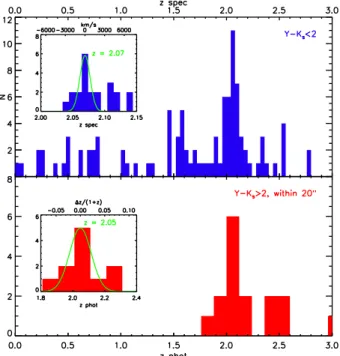
We performed spectroscopic follow-up observations of the galaxies in and around the overdensity using FORS2 and VIMOS on the VLT and MOIRCS on Subaru. Blue, sBzK-selected galaxies were targeted around the structure’s centre to within 10’ (or 5 Mpc at z ∼ 2; see Fig. 9). The VLT observations consisted of two FORS2 masks with 5 hours of integration each and one VIMOS mask with a 2.5h exposure. The 2D spectra of the individual runs were reduced using the standard pipeline (Scodeggio et al. 2005) and co-added. One-dimensional spectra were then extracted using the apextract tasks of the IRAF package. We estimated redshifts by first cross-correlating the observed spectra with a set of templates, including Lyman-break (Shapley et al. 2003), starburst, and star-forming (Kinney et al. 1996) galaxies. Using the rough redshift estimates given by the peaks of the cross-correlation function, we derived more precise redshifts from emission and absorption features (at z > 1.4, the FORS2 and VIMOS spectra cover the rest-frame UV) using the rvidlines task of the IRAF package. From the 41 FORS2 and 164 VIMOS slit spectra taken, we determined 109 secure redshifts. Their distribution shows a clear spike in the range z = 2 − 2.1, as shown in the top panel of Fig. 6. Assuming that this distribution is Gaussian, it
Gobat et al.: An old cluster in the young Universe
Fig. 3. Morphological properties of the galaxies in the field of the overdensity. Left, H band (F160W) NICMOS image of the cluster,
in logarithmic greyscale. The image is a composite of frames taken with the NIC3 camera during 7 HST orbits, reduced using the NICRED pipeline and combined with Multidrizzle. Galaxies with Y − Ks>2 are shown in red and galaxies with Y − Ks <2 in blue.
S´ersic indices of the best-fit model are indicated on top of each galaxy, except for those that are too point-like, which are labelled “compact”. Right, morphologies of four representative galaxies from the H band image. For each galaxy we show, from left to right, the observed image, the best-fit S´ersic model and the residuals image after subtraction of the model, all in the same logarithmic grey scale.
Fig. 4. Comparison of space and ground-based near-IR images of the field around the seemingly interacting galaxy triplet, taken
with the NIC3 instrument on the HST (right) and NIRC2 on Keck using adaptive optics (left) and showing the compact cores of two of the three galaxies. In both images, the PSF is shown by a white circle.
peaks at z = 2.07 and has a dispersion of ∼ 780 ± 90 km/s. Using the biweight estimator (Beers, Flynn & Gebhardt 1990), we find z = 2.07 and 747 km/s respectively. These values of cluster velocity dispersion are comparable to that of star-forming galaxies in the nearby Virgo cluster (Binggeli et al. 1987). With these values, we find 11 galaxies having spectroscopic redshifts within 2σ of the z = 2.07 peak. Some representative spectra of galaxies within the redshift spike are shown in Fig. 5.
We also obtained spectra of several red galaxies in the near-IR with OHS/CISCO and MOIRCS on Subaru, but their faintness prevented us from measuring redshifts: while a stacked spectrum of the brightest member candidates shows some continuum, no absorption or emission features are seen, the latter down to typical limits of ∼ 7 × 10⁻¹⁷erg s−1cm−2. At
z ∼ 2, this value corresponds to an unreddened star formation
rate of < 10 M⊙yr−1 and tends to support the conclusion that these objects are passively evolving stellar populations.
Fig. 5. Rest-frame UV spectra, taken with FORS2 and VIMOS on the VLT, of blue star-forming galaxies with redshifts within the
peak of the distribution, centred at z = 2.07. The spectra shown here were rebinned with a bin size of two pixels. Prominent emission and absorption features are shown with dotted green lines. The dashed red line indicates the level of zero flux. For each object, the (uncalibrated) image from which the spectrum was extracted is shown at the top of the sub-plot.
To complement the spectroscopic redshift information, which does not include the red galaxies, we estimated photo-metric redshifts from our BIRzY JHKs+IRAC photometry. Some
galaxies in the catalogue have [5.8] − [8.0] > 0, suggesting that emission from an obscured AGN is contributing to the infrared
SED and that the latter can therefore not be reproduced well by standard stellar population models. In particular, the galaxy in the overdensity with the highest IRAC excess is detected in the X-ray data, as discussed in Section 5. In these cases, we ignored the IRAC data for the purpose of deriving photometric redshifts.
Gobat et al.: An old cluster in the young Universe
Fig. 6. Redshift distributions of the galaxies in and surrounding the overdensity. Top: distribution of redshifts, determined from the
emission-line spectra of blue (Y − Ks <2) galaxies taken with the FORS2 and VIMOS instruments on the Very Large Telescope.
The insert shows a more detailed histogram for the range z = 2 − 2.15. For galaxies in the peak, the spectra sample the rest-frame
∼ 1200 − 2200Å. Bottom: distribution of photometric redshifts of red (Y − Ks > 2) galaxies within the central 20”. These were
estimated by comparing the BIRzY JHKs+IRAC spectral energy distribution to a set of spectral synthesis models computed from
templates of half-solar, solar, and twice-solar metallicity and assuming two different types of star-formation history (exponentially declining and constant truncated). We did not include the effects of dust attenuation, as the colour, morphological, and spectral properties of the red galaxies point strongly towards them being dominated by passive stellar populations rather than dust-reddened younger stars.
We compared the SEDs of the red galaxies to a range of model SEDs obtained from a set of Maraston 2005 stellar population synthesis templates, with three different star-formation histories (single burst, exponentially declining, and a constant star forma-tion rate with truncaforma-tion) and metallicities ranging from half to twice the solar value. We did not include the effects of dust ex-tinction in the models, as the colour and morphology of the red galaxies, as well as the absence of emission lines in the spectra of those targeted with MOIRCS and OHS/CISCO, strongly sug-gest that they form a population of passively evolving systems. Fitting the SEDs with actively star-forming stellar populations and an arbitrary amount of dust results in a substantially worse
χ2. We also used the SED fit to estimate ages and stellar masses, assuming a bottom-light initial mass function (Chabrier 2003). Fig. 7 shows the SEDs and best-fit models of four red galaxies in the structure. We find that the distribution of the photomet-ric redshifts of red galaxies in the overdensity proper (i.e. within 20” from the structure’s centre; see Fig. 8) narrowly peaks at
z = 2.05 (Fig. 6), with a scatter of ∼ 0.07 that is fully
com-patible with the expected accuracy for high-redshift ellipticals (Daddi et al. 2005, Ilbert et al. 2006, Maraston et al. 2006). We take the narrowness of both redshift distributions and their very similar peak values as confirmation that this structure, hereafter CL J1449+0856, is a real cluster or proto-cluster and we thus set its most likely redshift as z = 2.07. For the rest of the analysis, we consider as members of the structure galaxies with spectro-scopic or photometric redshifts within 2σ from the peaks of their respective distributions. We note that while z = 2.07 is the most likely redshift for this structure, having not yet measured any
spectroscopic redshift for the red ellipticals and based on the widths of the spectroscopic and photometric redshift distribu-tions, we cannot exclude a slightly different redshift in the range 2 . z . 2.1.
Fig. 9 shows the spatial distribution of spectroscopic and photometric members compared to the size of the core and the field of view of MOIRCS. Table 2 gives the characteristics of the photometric members in the core of CL J1449+0856.
4.1. Properties of the red galaxy population
The colours of those red photometric members are significantly redder than those observed for established elliptical galaxies in
z ∼ 1.5 clusters (e.g. Papovich et al. 2010) and are consistent
with a passive population at z ∼ 2.1, as shown in Fig. 10. We find a large colour scatter, however, indicating that the ellipticals have not yet settled into a tight red sequence characteristic of
z . 1.6 clusters. Indeed, their star-formation weighted ages (the
mean age of the stars in the best-fit model) range from 0.6 to 2 Gyr, with an average of 1.2 Gyr and average formation redshift of z ∼ 3.5. This implies that, if truly passive, some of these galaxies are observed relatively shortly after the cessation of star formation and before the colour differences due to their different star-formation histories could be attenuated by the subsequent passive evolution.
None of the elliptical members is much brighter than the others as to qualify for being a “brightest cluster galaxy” (BCG), the brightest of the red members being less than 0.5 mag more
Fig. 7. Spectral energy distributions of four representative red galaxies with photometric redshifts within 2σ of the peak of the
distribution. The observed SEDs and errors are represented with blue open circles. Upper limits at 1σ are shown by arrows and the best fit template is shown in orange. The corresponding redshift and formation redshift, at which half of the stellar mass was in place, are given in the upper right corner of each sub-plot. The integrated template fluxes in the Suprime-Cam, MOIRCS and IRAC bands are shown by red squares.
luminous than the second and third brightest members. However, as seen in Figs. 3 and 4, a group of three galaxies near the centre of the cluster appear to be very close to each other. If they all are at the same redshift of z = 2.07, they are separated by 5.5 to 13 kpc in projection and thus likely interacting. As noted in Section 3, Keck adaptive optics observations with NIRC2 reveal in two of them a very compact (∼ 1 kpc) core typical of high-redshift elliptical galaxies (Daddi et al. 2005). The combined flux of the three components is KAB,rest−frame ∼ 20, consistent with
the K-band-redshift relation for BCGs (Whiley et al. 2008), when extrapolated to z = 2.07. This suggests that we might be witnessing the early stages of the assembly of a brightest cluster galaxy through merging (De Lucia & Blaizot 2007).
We note however that some emission is seen at 24 µm in and around the cluster centre. Several sources are detected at 5σ in the core (Fig. 11), some of them associated with red galaxies, including the AGN and the “proto-BCG” triplet. The PSF-fitted fluxes of these objects are 100–150 µJy which, if due to star formation, would correspond to ULIRG-like luminosities of LIR ∼ 1.5 − 2 × 10¹²L⊙and imply very active starbursts with star formation rates of > 150 M⊙yr−1, in apparent contradiction with the elliptical-like morphology and compact cores. In the case of the “proto-BCG” galaxy group, the MIPS PSF is too large (6”) to determine which of the three galaxies is a 24 µm emitter. On the other hand, the 24 µm emission (which at z ∼ 2 corresponds to 8 µm rest-frame) might be due to extremely
obscured AGN activity (Fiore et al. 2009, Daddi et al. 2007b), an interpretation supported by the presence among the MIPS 24 µm sources of the Chandra-detected AGN. Stacking the Chandra data at the position of the five other 24 µm detected red galaxies within the central 1’, using a 5” aperture, we find an excess of photons in the hard band at 2.3σ significance with respect to the distribution of counts in a thousand samples of five random background (i.e. chosen to be at least 5” away from the nearest Ksselected object) positions each. As reported
in Section 5, we find no such excess in the soft band. As we might include X-ray emitting but K-undetected sources in the background positions, the significance level is likely underes-timated. However, distinguishing the relative contributions of AGN activity and star formation to the mid-IR flux is not within the scope of this work and would require far-IR data.
5. XMM-Newton and Chandra imaging
The unambiguous signature of an evolved cluster is the X-ray emission from the ICM, as it implies a deep and established potential well. To check for emission from a diffuse atmosphere, we looked for extended emission in deep X-ray observations available in the field with both the XMM-Newton and Chandra telescopes totalling 80 ks each (Brusa et al. 2005, Campisi et al. 2009). A detection was found in both soft-band (0.5-2 keV) images: the Chandra observation
Gobat et al.: An old cluster in the young Universe
Fig. 8. RGB composite image of the 1.4’×1.4’ field centred on the CL J1449+0856, as in Fig. 1. The R, G, and B channels correspond
to the Ks,J, and Y bands, respectively. The Y, J, and Ks photometry straddles wavelengths close to the 4000Å break at z ∼ 2 and
is useful to appreciate likely age variations among potential cluster members. The red arrows show the positions of red galaxies with photometric redshifts within 2σ of the peak of the distribution and the blue ones the position of galaxies with spectroscopic redshifts within 2σ of the peak. The green square gives the position of the AGN seen with Chandra. The white ellipse shows the 20” semi-major axis region that corresponds roughly to the overdensity and from which were selected the red galaxies shown in Figs. 7 and 10 and in Table 2.
ID RA (J2000) DEC (J2000) zphot Y − Ks(AB) Ks,tot(AB) r (’) r (kpc) 4774 14:49:14.39 +8:56:16.19 2.15 3.73±0.44 22.33 0.09 43 4942 14:49:14.20 +8:56:22.25 2.10 2.82±0.38 22.73 0.05 27 4948 14:49:14.54 +8:56:20.86 2.10 2.15±0.83 23.85 0.04 18 4954 14:49:14.87 +8:56:18.14 1.95 2.36±0.10 22.15 0.13 65 4970 14:49:13.97 +8:56:25.20 1.95 2.34±0.50 23.68 0.12 62 5080 14:49:14.11 +8:56:26.30 1.90 3.13±0.26 21.76 0.11 54 5125 14:49:14.08 +8:56:27.59 2.05 3.08±0.18 21.91 0.13 65 5138 14:49:14.16 +8:56:26.53 2.25 2.70±0.13 21.58 0.10 52 5225 14:49:13.42 +8:56:34.81 2.05 2.36±0.09 21.40 0.33 165 5262 14:49:14.07 +8:56:31.19 2.10 2.31±0.18 22.55 0.18 91 4489 14:49:14.99 +8:56:05.06 2.25 2.77±1.10 23.04 0.31 155 4518 14:49:14.60 +8:56:08.75 2.45 2.42±0.48 24.00 0.22 108 4608 14:49:14.33 +8:56:12.87 2.50 2.30±0.15 22.22 0.14 72 5018 14:49:14.10 +8:56:25.50 4.70 2.68±0.55 22.55 0.10 51 5045 14:49:15.13 +8:56:17.63 2.75 3.04±0.36 23.01 0.19 96 5113 14:49:14.48 +8:56:23.37 3.05 3.82±0.45 22.47 0.04 19
Table 2. Characteristics of the red galaxies in the overdensity: coordinates, photometric redshift, Y − Ks colour, Ks-band total
magnitude, and distance from the cluster centre in arc minutes and kiloparsecs. The first ten galaxies are the red members, with 1.9 < zphot <2.2. The bottom six objects, which are not formally inside the photometric redshift peak, might still belong to the
structure: e.g. galaxy 5113, which is the Chandra-detected AGN, a red spheroidal (nS ersic= 6) whose optical-NIR SED likely suffers
from AGN contamination.
reveals a ∼1” point source at the position of one of the red galaxies, while the soft X-ray emission seen by XMM is more extended than the 6” instrument PSF. To assess the significance of this extended emission, we fitted the XMM emission with a PSF profile at the position of the Chandra source and analysed the residual image. After subtraction of the point source, we found a residual X-ray emission in the soft band at the 3.5σ level on scales of 20–30”, three to five times more extended than the PSF of XMM-Newton. The excess flux over the background
is 47 ± 13 photons, the error including systematic uncertainties due to the point source subtraction. The total flux of this extended emission in the range 0.5–2 keV and over a 16” radius is ∼ 9.3 × 10⁻¹⁶ erg s−1, consistent with the presence of hot
ICM, typical of a “relaxed” cluster. This is thus faint emission, yet detected at a higher significance level than what reported for the z = 1.62 cluster (Tanaka et al. 2010, Papovich et al. 2010). As a consistency check, we carried out the same analysis on the Chandra data. While we do not detect any residual extended
Fig. 9. Spatial distribution of blue spectroscopic members, centred on the cluster. Galaxies with spectroscopic redshifts within 2σ
of the z = 2.07 peak are shown by blue open circles. The positions of galaxies with zphotwithin 2σ of the z = 2.05 peak are shown
by red crosses. The orange rectangle shows the field of MOIRCS and the 1, 2, and 3σ significance levels of the extended X-ray emission (as shown on Fig. 1 and discussed in Section 5) are drawn at the centre of the plot.
emission in the Chandra image, the implied upper limit is nevertheless consistent with the XMM result. Fig. 12 shows the XMM and Chandra detections and the extended emission after subtraction of the Chandra point source.
We emphasise that we kept the X-ray analysis simple and robust. We did not apply sophisticated wavelet-based detection techniques (Finoguenov et al. 2006), but only a standard back-ground subtraction, point-source subtraction, and photometry over a 16” radius. For visualisation purposes only, we smoothed the data with a 8” radius PSF to determine the X-ray contour levels shown in Fig. 1. For an accurate subtraction of point source X-ray emitters, we used the deep Chandra observations of the field, exploiting the fact that Chandra has a much better spatial resolution than XMM. On the other hand, we note that, as the Chandra data were taken one to three years after the XMM observations (Table 1), AGN variability could have affected our result (Papadakis et al. 2008). Our measurement should however be robust against variability for two strong reasons: first, the fact that the XMM residual emission is recovered over an extended area, after point source subtraction, implies that it is not an effect of variability. Furthermore, with the position of the AGN known, we fitted its flux using the XMM data itself only and found results fully consistent with what is observed in Chandra, excluding substantial variability. We also considered the possibility that the extended X-ray emission might actually arise from several faint AGNs, not individually detected by either XMM or Chandra and spatially dispersed in the overdensity. While detailed study of the AGN content in this cluster is deferred to a future paper, we carefully investigated which of the galaxies in the structure might be hosting an AGN on the basis of either a hard X-ray (2–8 keV) detection, the presence of a rising IRAC SED, or of mid-IR excess emission (Daddi et al. 2007b). For the latter, we used the archival Spitzer
MIPS 24µm imaging of the field, which reaches a 5σ detection limit of about 80 µJy. We find that there could be up to 4-5 AGNs in the cluster (as shown in Fig. 11), in addition to the Chandra point source. However, no soft X-ray photons were detected by Chandra at their position. Finally, we considered the possibility that the X-ray emission might come from a lower mass foreground (e.g. z . 1) galaxy group. Such a structure would be more loose and not immediately apparent against the backdrop of the main galaxy overdensity but should appear as a distinct peak in redshift space. To check for foreground structures, we estimated photometric redshifts for Y − Ks < 2
galaxies without spectroscopic redshifts. For these objects, which include star-forming galaxies as well as low redshift ellipticals, we used Coleman, Wu & Weedman 1980 templates, with the addition of a 100 Myr constantly star-forming model computed from Maraston 2005 templates, and included dust extinction up to E(B − V) = 1. We find no significant secondary structure in the redshift distribution of the 33 galaxies (3 spectroscopic and 30 photometric redshifts) within the 1σ confidence region of the extended X-ray emission. Three blue galaxies with zphot∼1.7 might be associated but their projected
centre of mass is offset by 15” with respect to the X-ray centroid.
We conclude that, all in all, the only likely explanation is that the extended X-ray emission seen by XMM is due to an ICM present in the structure’s potential well. The presence of an X-ray atmosphere and an evolved galaxy population is con-sistent with CL J1449+0856 being not a forming proto-cluster but an already mature galaxy cluster comparable to the massive structures observed at z < 1.6.
Gobat et al.: An old cluster in the young Universe
Fig. 10. Colour-magnitude diagram of the objects within 20” of the cluster centre. Blue galaxies are shown by blue crosses and
red galaxies by red squares. Red galaxies with a photometric redshift within 2σ of the peak of the distribution are indicated by filled squares, the bars showing the error in the colour. The greyscale shaded map shows the distribution of BzK-selected galaxies in the GOODS-South field (Daddi et al. 2007a). Colour limits at 3σ are shown by arrows. The typical error in the Y − Kscolour
and Ks,tot magnitude is shown in the bottom left. The solid and dashed lines show the expected colour and magnitude of stellar
population synthesis models (Kodama & Arimoto 1997), assuming that star formation begins at z = 10 and z = 3.5, respectively. The composite flux and colour of the “proto-BCG” galaxy assemblage are marked by a green star.
6. CL J1449+0856 and
z ∼ 2
structuresWhile several overdensities of Lyα emitters at z > 2 have been reported (Pentericci et al. 1997, Miley et al. 2006, Steidel et al. 2005, Overzier et al. 2006), CL J1449+0856 is different in some key aspects because of the evidence of extended X-ray emission from an intra-cluster medium and a centre occupied by old passively evolving early-type galaxies. These features make CL J1449+0856 much more mature than the high-redshift proto-clusters and a unique case among the
z > 2 structures.
6.1. MRC 1138-262
Among the large galaxy overdensities at z > 2, that around the massive radio galaxy PKS 1138-262 (Pentericci et al. 1997, Miley et al. 2006) at z = 2.16 is the one that can be most readily compared to CL J1449+0856. Located at a similar redshift, and thus at the same epoch in the history of the Universe, it is a massive structure characterised by a giant radio galaxy and a host of significantly less massive star-forming “satellite” galaxies (Miley et al. 2006). It has been extensively studied photometrically as well as spectroscopically and is understood to be a structure still in its formation phase, i.e. a “proto-cluster”. We emphasise that there are significant differences indicating that CL J1449+0856 is a very different type of structure, observed at a substantially more advanced evolutionary stage than MRC 1138-262.
MRC 1138-262 has been observed with Chandra and a number of AGNs were detected (Pentericci et al. 2002) as well as diffuse emission centred on the radio galaxy (Carilli et al. 2002). The latter is however clearly associated with the central AGN, which contributes to more than 80% of the total flux, aligned with the radio lobes, suggesting that it is due to inverse Compton scattered CMB photons (Celotti & Fabian 2004, Finoguenov et al. 2010), and overall quite different from the typical extended emission from an intra-cluster medium (Carilli et al. 2002). On the other hand, the only AGN in the X-ray emission of CL J1449+0856 does not contribute more than ∼50% of the total observed flux. The extended emission itself is not centred on any particular galaxy, but clearly spatially associated with the galaxy overdensity, fully consistent with a young cluster atmosphere.
The proto-cluster MRC 1138-262 was identified as an over-density of Lyα emitters (Pentericci et al. 2000) and the radio-galaxy itself is embedded in a giant emission-line nebula (Pentericci et al. 1997). The core of the proto-cluster is entirely dominated by star-forming galaxies, with a few redder galaxies located at the outskirts of the Lyα halo (Hatch et al. 2009). Of the latter, two have detected Hα emission (Doherty et al. 2010), indicating that they are actually actively star-forming galaxies. Red galaxies have been found in a broader field surrounding the radio-galaxy and Lyα overdensity, a subset of which have SEDs and morphologies consistent with a passive population, but the claimed overdensity is not concentrated in a putative cluster core (Zirm et al. 2008), mostly avoiding the central region around the radio-galaxy. In contrast, the structure of CL J1449+0856 is very different. Simply looking at colour images shows the striking
Fig. 11. Ks-band image of the 1.4’×1.4’ field centred on the galaxy cluster, as in Figs. 1 and 8, the green contours showing the fluxes
of the sources detected at 5σ or more in the MIPS 24 µm image. The red arrows show the positions of red (Y − Ks >2) galaxies
with rising IRAC fluxes ([5.8] − [8.0] > 0), suggesting the possible presence of obscured AGN activity.
Fig. 12. Left and middle: soft (0.5-2 keV) X-ray images of the field taken with XMM-Newton and Chandra (80ks each), showing,
respectively the diffuse emission and a point source, an active galactic nucleus corresponding to one of the red galaxies. Right: signal-to-noise map of the XMM residual image, after subtraction of the point source and smoothing with a FWHM of 16”.
difference between our cluster and MRC 1138-262 (compare Fig. 1 in this paper to Fig. 1 in Hatch et al. 2009, which displays a comparable field of view). Specifically, no analogue to the Lyα halo of MRC 1138-262 has been observed in CL J1449+0856. None of the red galaxies in the core is seen in the rest-frame UV and the space between the galaxies is void of light, save for the diffuse X-ray emission. And whereas the core of MRC 1138-262 is dominated by star-forming galaxies, the core population of CL J1449+0856 is constituted of red, morphologically early-type galaxies. This supports our conclusion that, if CL J1449+0856 experienced such a star-forming phase as the proto-cluster is un-dergoing, it lies in its past and that the red galaxies are now pas-sively evolving.
Finally, MRC 1138-262, having been discovered as a pow-erful FRII source (Pentericci et al. 1997), is in practice selected
over the whole sky and hence it is very difficult to assess its cos-mological relevance.
6.2. JKCS 041
Andreon et al. 2009 claimed the discovery of an evolved, colour-selected galaxy cluster at z ∼ 1.9, with extended X-ray emis-sion detected by Chandra. From the X-ray luminosity, the au-thors derive a total mass well above 1014 M⊙. The redshift of the structure, JKCS 041, was estimated from photometric red-shifts only: red-sequence galaxies were observed with FORS2 but proved too faint and no spectroscopic information was thus provided to support this identification. The redshift identification of this cluster has since been disputed using spectroscopic red-shifts from the VIMOS-VLT Deep Survey (Le F`evre et al. 2005) and new multi-band photometric redshifts; these data show that
Gobat et al.: An old cluster in the young Universe
JKCS 041 is not a single high-redshift cluster but a superposition along the line of sight of at least two rich galaxy structures, at
z ∼ 1.1 and z ∼ 1.5 (Bielby et al. 2010). While a z ∼ 2 structure
could still lurk in the background, this result suggests that the X-ray emission originates at z < 1.5.
7. Structure and mass of CL J1449+0856
With an estimated redshift of z = 2.07 for the cluster, we derive an X-ray luminosity of LX(0.1 −2.4 keV) = (7 ±2)×1043erg s−1.
On the basis of established LX − M correlations
(Leauthaud et al. 2010), the luminosity corresponds to a total mass of M200 = (5.3 ± 1) × 1013 M⊙, comparable to that of Virgo. The corresponding virial radius would be
R200 ∼ 0.37 Mpc, consistent with the scale of the observed
XMM emission (∼ 0.4 Mpc, as shown in Fig. 1), and a temperature of kT ∼ 2 keV, below the detection limit of current SZE facilities (Vanderlinde et al. 2010). We derive a consistent estimate for the total mass from the total stel-lar mass of the red member galaxies in the central 20”,
Mtot⋆ = 4.9 × 10¹¹ M⊙. Using the locally calibrated stellar mass-to-halo mass conversion of Moster et al. 2010, we find a halo mass of Mhalo = 8.0 × 10¹³ M⊙ and a corresponding virial radius of 0.42 Mpc (assuming Mhalo=M200). We note that
both estimates of the virial radius are comparable to the size of the overdensity from which we selected the red galaxies, 20” corresponding to ∼ 0.17 Mpc proper at z = 2.07. Furthermore, assuming that the core is in the first order spherical, at z = 2.07 a sphere of radius 0.17 Mpc with a mass of 8 × 10¹³ M
⊙ has a mean density of ∼ 3000ρc (where the critical density at
z = 2.07 is ρc = 8.63 × 10⁻²⁹ g cm−3), significantly above
the usual threshold of ∼ 178ρc for virialisation. Although
this estimate has substantial uncertainties, this might suggest that the core of CL J1449+0856 has already collapsed and (at least partially) virialised. Both total mass estimates might be regarded as lower limits, as the LX −M relation assumes that
the intra-cluster gas has fully reached its virial temperature, a state that CL J1449+0856 may still be approaching, and our census of massive galaxies is incomplete as we considered only the red members in a small central region, without including star-forming members or galaxies outside the immediate core. The agreement of the two estimates, however, suggests that the faint X-ray emission is reliable. It would seem to imply that not only the M⋆−M relation holds to z ∼ 2 and but that this cluster is, to the first order, already on the LX−M correlation.
With these halo mass estimates, we can now use the results of numerical simulations from the literature to attempt a prediction of the future growth of CL J1449+0856 and its final mass at z = 0. Based on the mass assembly histories of halos in the Millennium and Millennium-II simulations (Fakhouri et al. 2010), we estimate that CL J1449+0856 would reach a mass of 0.9 − 1.5 × 10¹⁴M⊙at z = 1.5 and 4.9 − 8.2 × 10¹⁴ at z = 0. These values are well within the range of cluster masses at these respective redshifts. At z = 1 − 1.5, CL J1449+0856 would be about one fourth as massive as the most massive
z > 1 clusters (Brodwin et al. 2010, Rosati et al. 2009) and
reach a z = 0 mass comparable to that of the Coma cluster (Kubo et al. 2007).
Assuming Gaussian initial conditions and concordance cos-mology with σ8= 0.8 (Vanderlinde et al. 2010), the probability
of finding a dark matter halo with z ≥ 2.07 and a mass greater than 5 × 10¹³M⊙in the survey area of 400 arcmin2is 3.3 × 10⁻².
Allowing some time before the dark matter halo formation and observation (Jimenez & Verde 2009), and the gas to settle in the deep potential well, would further lower this probability, e.g. down to 1.0 × 10⁻² for z
f = 2.30 (0.3 Gyr before the
observa-tions). Lowering σ8to 0.77 would further reduce these numbers
by roughly a factor of 3. Although based on a single object de-tection, our finding suggests an excess of massive high-redshift structures, consistent with the constraints derived from the ex-istence of a very massive cluster at z = 1.39 (Jee et al. 2009, Jimenez & Verde 2009). However, we note that no obvious sim-ilarly high-redshift candidate structure is detected in the 2 deg2
COSMOS field (Tanaka et al., in prep., Salvato et al., in prep.).
8. Summary
We have discovered a remarkable structure whose properties are consistent with it being a mature cluster at z = 2.07. This structure was selected as an overdensity of sources with IRAC colours satisfying [3.6] − [4.5] > 0. Deep follow-up observa-tions with Subaru and the VLT revealed a strong overdensity of galaxies with Y − Kscolours consistent with a passive population
at z & 2. We also obtained high resolution HST/NICMOS and Keck AO images, which revealed that the red galaxies have elliptical-like morphologies and compact cores.
From the VLT VIMOS and FORS2 spectra of sBzK galaxies around the core, we estimated a redshift of z = 2.07 for the structure. We estimated photometric redshifts from the 12-band SEDs of the red galaxies, whose distribution peaks at z = 2.05, in agreement with the spectroscopic redshifts.
Using XMM-Newton and Chandra observations of the field, we found an extended soft X-ray emission at the 3.5σ confidence level, at the position of the galaxy overdensity. The observed X-ray luminosity and the galaxy mass content of the core imply a total halo mass of 5–8×10¹³M⊙.
Our results show that virialised clusters with detectable X-ray emission and a fully established early-type galaxy content were already in place at z > 2, when the Universe was only
∼ 3 Gyr old. While it took us several years of observations to confirm this structure, upcoming facilities like JWST and future X-ray observatories should be able of routinely find and study similar clusters, unveiling their thermodynamic and kinematic structure in detail. The census of z > 2 structures similar to CL J1449+0856 will subject the assumed Gaussianity of the primor-dial density field to a critical check.
References
Andreon, S., Maughan, B., Trinchieri, G., Kurk, J., 2009, A&A 507, 147-157 Beers, T.C., Flynn, K., Gebhardt, K., 1990, AJ 100, 32-46
Bertin, E., Arnouts, S., 1996, A&AS 117, 393-404 Bielby, R.M. et al., 2010, http://arxiv.org/abs/1007.5236 Binggeli, B., Tammann, G.A., Sandage, A., 1987, AJ 94, 251-277 Blakeslee, J.P. et al., 2003, ApJ 596, L143-L146
Boselli, A., Gavazzi, G., 2006, PASP 118, 517-559 Brodwin, M. et al., 2010, ApJ 721, 90-97 Brusa, M. et al., 2005, A&A 432, 69-81 Campisi, M.A. et al., 2009, A&A 501, 485-494 Carilli, C.L. et al., 2002, ApJ 567, 781-789
Cay´on, L., Gordon, C., Silk, J., 2010, http://arxiv.org/abs/1006.1950 Celotti, A., Fabian, A.C., 2004, MNRAS 353, 523-528
Chabrier, G., 2003, PASP 115, 763-795
Coleman, G.D., Wu, C.-C., Weedman, D.W., 1980, ApJS 43, 393-416 Coles, P., Lucchin, F. 1995, Cosmology: The Origin and Evolution of Cosmic
Structure, Wiley
Daddi, E. et al., 2000, A&A 361, 535-549 Daddi, E. et al., 2004, ApJ 617, 746-764
Daddi, E. et al., 2005, ApJ 626, 680-697 Daddi, E. et al., 2007, ApJ 670, 156-172 Daddi, E. et al., 2007, ApJ 670, 173-189 Daddi, E. et al., 2009, ApJ 694, 1517-1538 De Lucia, G., Blaizot, J., 2007, MNRAS 375, 2-14 Demarco, R. et al., 2010, ApJ 725, 1252-1276 Doherty, M. et al., 2010, A&A 509, A83 Elbaz, D. et al., 2007, A&A 468, 33-48
Fakhouri, O., Ma, C.-P., Bolyan-Kolchin, M., 2010, MNRAS 406, 2267-2278 Finoguenov, A. et al., 2007, ApJS 172, 182-195
Finoguenov, A. et al., 2010, MNRAS 403, 2063-2076 Fiore, F. et al., 2008, ApJ 672, 94-101
Fiore, F. et al., 2009, ApJ 693, 447-462 Francis, P.J. et al., 1996, ApJ 457, 490-499
Gladders, M.D., Yee, H.K.C., 2001, AJ 120, 2148-2162 Hatch, N.A. et al., 2009, MNRAS 395, 114-125
Haiman, Z., Mohr, J.J., Holder, G.P., 2001, ApJ 553, 545-561
Hashimoto, Y., Oemler, A., Jr., Lin, H., Tucker, D.L., 1998, ApJ 499, 589-599 Hayashi, M. et al., 2010, MNRAS 402, 1980-1990
Henry, J.P. et al., 2010, http://arxiv.org/abs/1010.0688 Hilton, M. et al., 2010, ApJ 718, 133-147
Hwang, H.S., Park, C., 2009, ApJ 700, 791-798 Ilbert, O. et al., 2006, A&A 457, 841-856 Jee, M.J. et al., 2009, ApJ 704, 672-686 Jimenez, R., Verde, L., 2009, PhRvD 80, 127302 Kinney, A.L. et al., 1996, ApJ 467, 38-60 Kodama, T., Arimoto, N., 1997, A&A 320, 41-53 Kodama, T. et al., 2007, MNRAS 377, 1717-1725
Koekemoer, A.M., Fruchter, A.S., Hook, R.N., Hack, W., 2002, The 2002 HST Calibration Workshop: Hubble after the installation of the ACS and the NICMOS Cooling System, 337-340
Kong, X. et al., 2006, ApJ 638, 72-87 Kubo, J.M. et al., 2007, ApJ 671, 1466-1470 Kurk, J. et al. 2009, A&A 504, 331-346 Leauthaud, A. et al., 2010, ApJ 709, 97-114 Le F`evre, O. et al., 2005, A&A 439, 845-862
Magee, D.K., Bouwens, R.J., Illingworth, G.D., 2007, ASPC 376, 261-264 Maraston, C., 2005, MNRAS 362, 799-825
Maraston, C. et al., 2006, ApJ 652, 85-96 Miley, G.K. et al., 2006, ApJ 650, L29-L32 Moster, B.P. et al., 2010, ApJ 710, 903-923 Mullis, C.R. et al., 2005, ApJ 623, L85-L88 Overzier, R. et al., 2006, ApJ 637, 58-73 Overzier, R. et al., 2008, ApJ 673, 143-162
Papadakis, I.E., Chatzopoulos, E., Athanasiadis, D., Markowitz, A., Georgantopoulos, I., 2008, A&A 487, 475-483
Papovich, C. et al., 2010, ApJ 716, 1503-1513 Park, C., Hwang, H.S., 2009, ApJ 699, 1595-1609
Patel, S.G., Holden, B.P., Kelson, D.D., Illingworth, G.D., Franx, M., 2009, ApJ 705, L67-L70
Peacock, J.A., 1999, Cosmological Physics, Cambridge Univ. Press Peebles, P.J.E., 1993, Physical Cosmology, Princeton Univ. Press Peng, C.Y., Ho, L.C., Impey, C.D., Rix, H.-W., 2002, AJ 124, 266-293 Peng, Y.-J. et al., 2010, ApJ 721, 193-221
Pentericci, L., Roettgering, H.J.A., Miley, G.K., Carilli, C.L., McCarthy, P., 1997, A&A 326, 580-596
Pentericci, L. et al., 2000, A&A 361, L25-L28 Pentericci, L. et al., 2002, A&A 396, 109-115 Pierre, M. et al., 2003, JCAP 9, 11
Ponman, T.J., Cannon, D.B., Navarro, J.F., 1999, Nature 397, 135-137 Postman, M. et al., 2005, ApJ 623, 721-741
Press, W.H., Schechter, P., 1974, ApJ 187, 425-438 Rettura, A. et al., 2010, ApJ 709, 512-524
Romer, A.K., Viana, P.T.P., Liddle, A.R., Mann, R.G, 2001, ApJ 547, 594-608 Rosati, P., della Ceca, R., Colin, N., Giacconi, R., 1998, ApJ 492, L21-L24 Rosati, P., Borgani, S., Norman, C., 2002, ARA&A 40, 539-577
Rosati, P. et al., 2009, A&A 508, 583-591 Salvato, M. et al., 2011, in preparation
S´ersic, J.-L., Boletin de la Asociacion Argentina de Astronomia 6, 41 Schuecker, P., B¨ohringer, H., Collins, C.A., Guzzo, L., 2002, A&A 398, 867-877 Schuecker, P., B¨oringer, H., Collins, C.A., Guzzo, L., 2003, A&A 398, 867-877 Shapley, A.E., Steidel, C.C., Pettini, M., Adelberger, K.L., 2003, ApJ 588, 65-89 Scodeggio, M. et al., 2005, PASP 117, 1284-1295
Stanford, S.A. et al., 2006, ApJ 646, L13-L16 Steidel, C.C. et al., 2000, ApJ 532, 170-182 Steidel, C.C. et al., 2005, ApJ 626, 44-50
Tanaka, M., Finoguenov, A., Ueda, Y. A, 2010, ApJ 716, L152-L156 Tanaka, M. et al., 2011, in preparation
Toft, S. et al., 2007, ApJ 671, 285-302 Tran, K.-V.H. et al., 2010, ApJ 719, L126-L129 Vanderlinde, K. et al., 2010, ApJ 722, 1180-1196
van der Wel, A., Bell, E.F., Holden, B.P., Skibba, R.A., Rix, H.-W., 2010, ApJ 714, 1779-1788
Voit, G.M., 2005, RvMP 77, 207-258
Whiley, I.M. et al., 2008, MNRAS 387, 1253-1263 Wilson, G. et al., 2008, ASPC 381, 210-215 Zirm, A.W. et al., 2008, ApJ 680, 224-231
Acknowledgements. This work is based on data collected at the Subaru Telescope, which is operated by the National Astronomical Observatory of Japan; on observations made with ESO telescopes at the Paranal Observatory, under programmes 072.A-0506 and 381.A-0567; and on observations made with the NASA/ESA Hubble Space Telescope, which is operated by the Association of Universities for Research in Astronomy, Inc., under NASA contract NAS 5-26555. Support for programme #11174 was provided by NASA through a grant from the Space Telescope Science Institute, which is operated by the Association of Universities for Research in Astronomy, Inc., under NASA con-tract NAS 5-26555. Some of the data presented herein were obtained at the W.M. Keck Observatory, which is operated as a scientific partnership among the California Institute of Technology, the University of California and the National Aeronautics and Space Administration. We acknowledge funding ERC-StG-UPGAL-240039, ANR-07-BLAN-0228 and ANR-08-JCJC-0008 and Alvio Renzini acknowledges financial support from contract ASI/COFIS I/016/07/0. This work is partially supported by a Grant-in-Aid for Science Research (No. 19540245) by the Japanese Ministry of Education, Culture, Sports, Science and Technology. We thank Romain Teyssier for his help with the cosmological cal-culations, Monique Arnaud, David Elbaz and Piero Rosati for discussions.