HAL Id: hal-00777951
https://hal.archives-ouvertes.fr/hal-00777951
Submitted on 18 Jan 2013HAL is a multi-disciplinary open access archive for the deposit and dissemination of sci-entific research documents, whether they are pub-lished or not. The documents may come from teaching and research institutions in France or abroad, or from public or private research centers.
L’archive ouverte pluridisciplinaire HAL, est destinée au dépôt et à la diffusion de documents scientifiques de niveau recherche, publiés ou non, émanant des établissements d’enseignement et de recherche français ou étrangers, des laboratoires publics ou privés.
crystal defect arrays
Delphine Coursault, Johan Grand, B. Zappone, Habib Ayeb, G. Levi, Nordin
Félidj, Emmanuelle Lacaze
To cite this version:
Delphine Coursault, Johan Grand, B. Zappone, Habib Ayeb, G. Levi, et al.. Linear self-assembly of nanoparticles within liquid crystal defect arrays. Advanced Materials, Wiley-VCH Verlag, 2012, 24, pp.1461. �10.1002/adma.201103791�. �hal-00777951�
DOI: 10.1002/adma.((please add manuscript number))
Linear self-assembly of nanoparticles within liquid crystal defect arrays
By D. Coursault , J. Grand, B. Zappone, H. Ayeb, G. Lévi, N. Félidj and E. Lacaze*
[*] Prof. E. Lacaze Corresponding-Author, D. Coursault, Dr H. Ayeb
Institut des Nano-Sciences de Paris (INSP), UMR-CNRS 7588, Université Pierre et Marie Curie-Paris 6, 4 pl Jussieu 75005 PARIS, France E-mail: emmanuelle.lacaze@insp.jussieu.fr
Dr. J. Grand, Dr. G. Lévi, Prof. N. Félidj.
Université Paris Diderot, Sorbonne Paris Cité, ITODYS, UMR CNRS 7086, 15 rue J-A de Baïf, 75205 Paris Cedex 13, France
Dr. B. Zappone
CNR-IPCF, Liquid Crystal Laboratory, Università della Calabria, cubo 33/B, Rende, 87036, Italy
Keywords: Liquid crystal; gold nanoparticles; self-assembly; Surface Plasmon Resonance; Optically Active Materials.
Nanostructured materials with tunable optical properties are of great interest in the
perspective of optical transport of information. Gold nanoparticles (GNPs) exhibit unique
optical properties due to Localized Surface Plasmon Resonance (LSPR), which are highly
sensitive to the optical index of the embedding medium and the presence of neighboring
GNPs. Linear (1D) assemblies of GNPs are particularly interesting due to their strong
anisotropy. Various methods have been explored to create linear assemblies of nanoparticles
but obtaining straight structures over a large scale remains challenging. A promising approach
is the directed self-assembly of nano-objects within large-scale, ordered templates.[1, 2] This
approach is particularly promising for liquid crystals (LC) which are able to rapidly
self-arrange into large ordered anisotropic matrices which can contain linear structural defects.[3, 4,
5]
This kind of defect has been used so far as molt for polymerization.[6] Concerning assembly
of particles, many studies have been devoted to the trapping of !m-sized particles by nematic
and smectic defects.[7, 8, 9] In nematic LC matrices, !m-sized particles can create[10] and
interact with localized defects.[8, 9, 11] In case of attraction between LC defects and particles,
so-called nematic disclinations. [8,9,10] However, these assemblies are not really straight and
better trapping has been demonstrated for smectic defects compare to nematic ones, due to
higher distortion energy associated with the former.[11] Trapping of NPs by defects has been
evidenced through the accumulation within defects, especially in LC blue phases. [12,13,14] The
following question thus arises: can the trapping of NPs be controlled at the nanoscale, for 1D
geometry, even though NPs are expected to be too small to generate a long-range elastic LC
distortion? The smallest particles around which LC distortions have been evidenced have a
diameter of 125 nm.[15] In this article we show that ordered linear arrays of defects in the
smectic phase of a liquid crystal attract and organize NPs such as quantum dots (QDs) and
GNPs. The well-defined alignments of single GNPs provide new means of tuning their optical
response (e.g. their LSPR).
We have used films of smectic 8CB (4-n-octyl-4'-cyanobiphenyl) deposited on a solid
substrate inducing planar anchoring of the LC director while a homeotropic (normal)
anchoring was generated at the air interface. This produces a distorted texture, the so-called
'oily streaks', containing periodic curvature walls and disclination lines, perpendicular to the
planar anchoring (Fig.1a).[4, 5, 15] Due to the high energetic cost of their structural
deformations, the defects core thickness is expected to be limited.[16] We used well-defined
defects orientations to induce anisotropic assemblies of NPs. We performed optical extinction,
fluorescence microscopy, and scanning electron microscopy (SEM) to identify the role of
defects and study the influence of the NPs concentration. Discrete dipole approximation
(DDA) calculations were also performed for the analysis of extinction spectra.[17, 19] We have
considered two substrates: (a) a freshly cleaved surface of crystalline molybdenum disulfide
(MoS2), semi conductive and opaque to light, and (b) transparent coatings of poly-vinyl
alcohol (PVA) on glass, rubbed to induce planar anchoring. We used two types of NPs: (i)
in toluene solution, and (ii) fluorescent CdSe-ZnS QDs (Invitrogen) characterized by binary
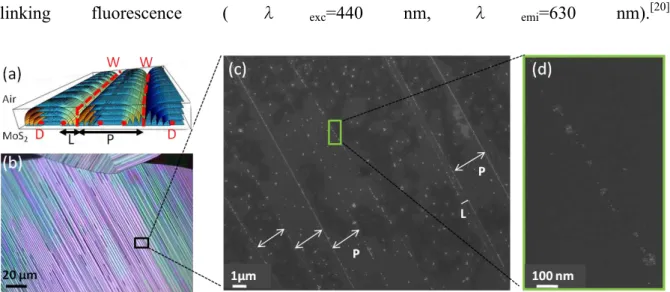
blinking fluorescence ( λ exc=440 nm, λ emi=630 nm).
[20]
Figure 1.a. Schematic illustration of a linear array of straight parallel oily streaks in which only smectic layers are represented, with disclination lines (D) and curvature walls (W). b. Polarized optical microscopy image of a single array of a 300nm thick film of 8CB on MoS2.
c. SEM image of the MoS2 substrate with GNPs chains. d. Enlarged view of a chain.
In order to visualize the GNPs by SEM, we first started experiments on the MoS2
substrate. When GNPs were deposited without LC, SEM images revealed dense GNPs areas
homogeneously dispersed on the substrate (not shown). They correspond to close-packed
GNPs separated by 1.5 nm on average, due to alkylthiols chains interdigitation. A solution of
3"1016 GNPs/L in toluene was then mixed with 5mM of 8CB and spin-coated 25 times to
obtain a large number of GNPs and a LC film thickness of 300nm.[3] The sample was heated 2
minutes at 60°C in a second step to allow appearance of 8CB oily streaks when cooling back
to room temperature. Polarized optical microscopy images did not show textural changes in
the 8CB/GNPs array compared to pure 8CB (Fig. 1b). In a third step 8CB was eliminated by
heating the substrate at 60°C for one week. The lamellar texture of MoS2 indeed allows
formation of 8CB monolayers at each basal planes,[21] leading to a draining of 8CB which
systematically occurs within MoS2 in contrast to other substrates, like rubber polymer on
glass. SEM images showed GNPs arranged in straight parallel chains with lengths up to
was of the same order than the distance between walls, P, (Fig. 1a), imposed by the LC film
thickness.[3] We occasionally observed double chains of GNPs separated by a smaller distance,
L, (Fig. 1c), comparable to the typical walls-disclination distance (about 300 nm).[15]
Disclinations can also trap GNPs, though less efficiently than walls. We observe other areas
with randomly oriented thicker alignments of GNPs (Fig. 2c). As the planar anchoring on
MoS2 is multi-directional, oily streaks are oriented in domains corresponding to different
azimuthal (in-plane) anchoring directions (Fig. 2a),[21] coexisting on the same cleavage plane
of MoS2. We identify regions between randomly oriented alignments of GNPs with small
anchoring domains of MoS2 and alignments of GNPs with domain (grain) boundaries. The
density of GNPs is the largest in regions where several domains meet each other (arrow on
Fig. 2c). Therefore, GNPs are preferentially trapped in grain boundary regions where the LC
director is highly distorted to accommodate the disorientation between 3 azimuthal directions.
The migration of GNPs from the oily streaks region to grain boundaries shows that different
types of defects have a different 'trapping efficiency': Grain boundaries are more efficient than
walls and disclinations to trap NPs, and disclinations turns out to be the least efficient
“trapping system” of all.
!"#$%&'$()*+($,*-)$./0(-12($34'$("4#/1$5678$3/*4#$3$(391$/"41&$:)"($(0##1(-($-)3-$
3;*"'"4#$ -)1$ 3##21#3-"*4$ *<$ ./0(-12($ /13'($ -*$ .)3"4($ *<$ "4'";"'03/$ 567($ "4$ *"/=$ (-213>(&$
?(*/3-1'$ 67($ 321$ *,(12;1'$ *4$ !"#&$ %@$ +)".)$ 9134($ -)3-$ -)1$ 67($ .*4.14-23-"*4$ *4$ -)1$
(0,(-23-1$ 90(-$ ,1$ adjusted. We have then decided to control the NPs concentration using
drop-casting on a rubbed PVA polymer substrate. This kind of substrate presents the
advantage of having a unique planar anchoring direction for 8CB. The deposition of a drop of
8CB, immediately followed by a 2 minutes heating at 60°C during solvent evaporation, makes
it possible to avoid the formation of NPs clusters. These clusters may be formed using
oily streaks (Figure 1c).We have then performed a study of the influence of the nanoparticles
concentration on rubbed PVA polymer substrate.
Figure 2. a. Polarized Optical Microscopy image of multiple anchoring domains of 8CB on MoS2 (the arrows show anchoring direction). b. Enlarged view with a high density of grain
boundaries. c. SEM image of the MoS2 with thick alignments of GNPs aligned along the grain
boundaries. The arrow points to a region where 3 grain boundaries meet each other.
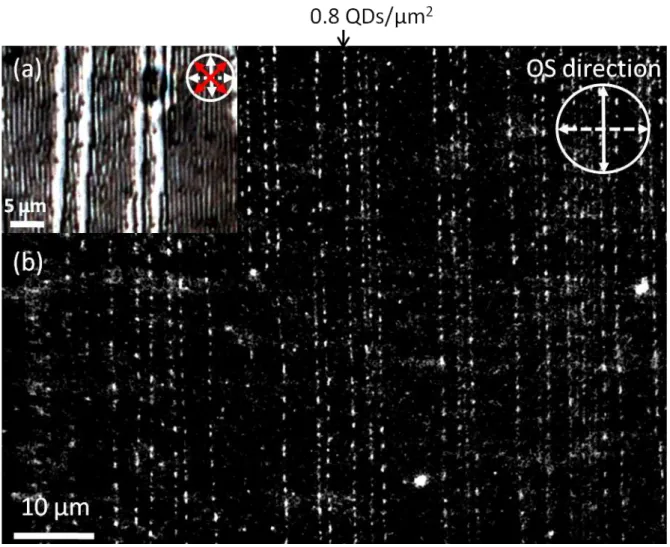
At low concentration, we have considered QDs of the same diameter (5 nm) as GNPs
which can be observed in-situ by fluorescence microscopy. We prepared a solution containing
3.5 x10¹² QD.L-1 and 5mM 8CB in toluene. We deposited a 30 !l drop on rubbed PVA
polymer, to form a 300nm thick film with an average surface density of 0.7 QD.!m-2. After
cooling back from 60°C in the smectic phase, array of oily streaks appeared (Fig. 3a). Using
fluorescence microscopy, without QD, no chain was visible. In presence of QDs, straight
chains of blinking fluorescent spots parallel to the oily streaks (Fig. 3b) are visible. The
distance between neighboring chains ranges between 0.64 and 7.5 !m, which is of the same
order than the distances between walls (Fig. 3a, 1c). The wide range of distances is due to
variations in the 8CB thickness. A careful analysis of the blinking QDs allows to identify one
bright spot on Fig. 3b as being 2 QDs in average. This is consistent with average spot size
which ranges from 0.5 to 1.7 !m, that is 1 to 3 times the calculated QD airy diameter (549 nm
forλemi=630 nm ). From the density of spots in Fig. 3b, we calculate a surface density of 0.8
QD.!m-2, which is very close to the estimated average density of 0.7 QD. !m-2. Therefore,
directing an assembly of NPs much smaller than the particles used in previous studies. [9, 15]
The length of the QDs chains is given by the one of the oily streaks, longer on PVA compare
to MoS2 because they do not end in grain boundaries, leading to chains of several hundreds of
micrometer, only interrupted by "dislocation-like" regions which accommodate thickness
variations.[5]
Figure 3. a. Polarized Optical Microscopy image of an array of oily streaks formed in a thin film of 8CB/QDs on rubbed PVA. Red crosses show the directions of polarization , the dashed white arrow the anchoring direction and the solid white arrow the oily streaks direction b. Image of an array obtained by unpolarized fluorescence microscopy on the same film, with QDs.
To evidence inter-particle coupling and also the NPs alignment by a different mean,
we replaced the QDs by GNPs at a concentration four orders of magnitude larger, 3"1016
GNP.L-1 We then measured the localized surface plasmon resonance (LSPR) of the GNPs in
curve), the extinction peak was very similar to the one of GNPs dispersed in pure toluene (λ
=516 nm, Fig. 4a, dashed line). For parallel polarization, the LSPR is red-shifted by about 40
nm compared to the NPs in solution (Fig. 4a, red curve). It is well known that in isotropic
media the LSPR moves to larger wavelengths as the refractive index increases.[20] Due to the
positive uniaxial birefringence of 8CB, we expect to probe the ordinary index (no=1.52) when
the polarization is set parallel to the oily streaks and a refractive index varying between
ordinary and extraordinary index (ne=1.67) for a polarization perpendicular to the oily streaks,
depending on the localization of GNPs (Fig. 1a). Therefore, the 8CB birefringence could only
lead to a blueshift of the LSPR for a polarization parallel to the oily streaks. The observed red
shift is indicative of a different phenomenon, the coupling between GNPs preferentially along
the oily streaks.
Figure 4. Extinction spectra recorded on rubbed PVA polymer with an incident light polarization set either parallel (red curves) or perpendicular (black curves) to the oily streaks. The dashed curve was obtained for GNP/toluene solution (3x 10¹⁶ GNP.L-1), divided by 20 for comparison (a) 8CB/GNPs on PVA (3x10¹⁶ GNP.L-1). (b) GNPs on PVA (3x10¹⁶ GNP.L
-1
). (c) 8CB/GNPs on PVA (6x10¹⁶ GNP.L-1).
In contrast, no polarization anisotropy of the LSPR was observed for the same amount of
GNPs deposited on PVA without LC (Fig. 4b). This is due to the presence of randomly
oriented clusters of optically coupled GNPs, like on MoS2 without LC. [23] We have
performed DDA calculations of the extinction spectra considering optically coupled gold/thiol
core-shell GNPs. We have taken into account that: (a) the minimum distance between the
metal cores of two GNPs was limited to 1.5 nm due to the presence of thiol coatings, (b) The
nm with respect to values calculated for uncoupled particles in toluene (ntoluene=1.497). The
covalent bond at the gold-thiol interface may modify the dielectric constant of gold close to
the interface. [19, 20] In the following we will only compare the experimental and theoretical
variations of the extinction maxima with respect to the spectrum of GNPs in toluene. The
calculated red-shift with respect to toluene was 10 nm for single GNPs embedded in ne and
only 2 nm for no. The fact that, for perpendicular polarization (Fig. 4a), no clear experimental
shift is observed with respect to toluene, shows that GNPs feel an optical environment closer
to no than to ne, as it should be in the vicinity of defects cores, associated with high local
disorder for the LC director. This also shows that no coupling between GNPs occurs in the
direction perpendicular to the oily streaks, which demonstrates a GNP organization in single
linear chains parallel to oily streaks, without clusters like the ones on MoS2 (Fig. 1d).
Moreover, for parallel polarization, no peak was observed around the wavelength for pure
toluene (516 nm) showing that only a minority of GNPs is isolated on the substrate. A shift
due to coupling between GNPs depends on the distance between particles and on the number
of coupled particles. [24] The larger width of the extinction peak for parallel polarization (Fig.
4a) shows that chains have a certain dispersion of length and/or separation between coupled
GNPs. For five different areas on the same sample, the peak was red-shifted between 34 nm
and 44 nm. Calculated extinction spectra for GNP chains, in no with a number of particles
separated by 1.5nm of thiol, going from 2 to infinity gave red shifts ranging from 17 nm to 40
nm with respect to the toluene reference. Long chains of closed-packed GNPs, longer than 8
GNPs, may consequently be formed in majority. The shift value is only limited by the
minimal separation between GNPs, associated with direct contact between thiol coatings.
These results finally demonstrate that well-oriented 1D chains are formed, in agreement with
results obtained for fluorescent QDs, which must be localized in regions as small as 5 nm,
within oily streaks defects. Doubling the GNPs concentration (6 x10¹⁶ GNP.L-1) leads to a
4c). The smaller red-shift observed for perpendicular polarization shows that a limited
assembly of coupled GNPs occurs also perpendicular to oily streaks, corresponding to an
overall shape still elongated along the oily streaks direction similar to a rod or a ribbon.
Therefore, the anisotropy remains effective at high concentration, when the most stable traps
within defects core have already been occupied. Variations of concentration allow tuning the
extinction shift between perpendicular polarizations, in relation with the length and width of
ribbons. A maximum value of 44 nm has been measured so far for single chains.
Our result agrees with the idea that NPs behave as impurities: they are stabilized by
the gain in defects core energy in defects like wall, whereas the trapping of particles larger
than the defect core is also due to a gain in elastic energy. [12, 13, 25, 26] The core energy per unit
area of the wall is of the order of K/l, where K=10-11 J.m-1 is the curvature modulus, l=1 nm is
the penetration length, and the core size is of the order of l. [11, 17] The trapping potential is
a2K/l # 80kT, where a=5 nm is the NP diameter, leading to a very stable and localized
trapping. The small size of the defect is specific to smectic defects, as opposed to nematic
defects, and constitutes a key point for successful aligning trapping of NPs. A limit size of the
NPs is expected below which gain in core energy becomes smaller than thermal energy.
Possibly, the trapping sites correspond to edge dislocations within walls joining highly
disoriented layers, [5] which are expected at the base of the oily streaks. [16] Dislocations have
also been observed within disclinations on MoS2 surfaces. [16] As the concentration increases,
the chains are transformed in aligned ribbons suggesting a profile of trapping efficiency,
associated with a gain in elastic energy outside the defects cores, in the direction
perpendicular to the defects, which becomes progressively occupied by NPs.
The causes of NP trapping in defects are complex and yet to be clarified. On one hand,
the formation of chains may be the result of a random process of diffusion and aggregation of
NPs. In nematics containing nm-size macromolecules, this process leads to the segregation of
in the form of aggregates. [26] In contrast, regions as wide as several µm between the defects
appeared almost completely depleted of NPs on rubbed polymer substrate, as if NPs were
attracted to the defects by a long-range interaction. In nematics, !m-size particles are known
to create defects and elastic distortions of the molecular director that produce forces between
particles and defects. [8, 9] It is known that NPs with alkylthiols (inducing homeotropic
anchoring) produce a disordering effect in LCs. [27] In the smectic phase, the distortion around
NPs may be enhanced. [28] The question remains whether NPs produce a local disturbance of
the smectic film, on a scale comparable with their size, or they create a distortion over a much
larger scale that may be coupled with the long-range elastic distortion associated with defects.
In the latter case, the distortion may produce a 'guided' diffusion of the NPs towards the
singularity of the distorted texture, in analogy with !m size particles in the nematic phase.
Three kinds of defects have been identified on MoS2, all of which constitute stable
trapping sites for NPs: grain boundary, curvature wall, and disclination, in order of decreasing
trapping efficiency. This is compatible with an attraction between GNPs and defects related to
the range of the distortion within the LC bulk. Grain boundaries involve the largest
disorientation of the layers at opposite side of the boundary. Straight vertical walls (Fig. 1(a))
are more effective than disclination, because they have an extension equal to the LC film
thickness whereas the disclinations on MoS2 have a diameter of the order of 100 nm. [16]
In conclusion, we have demonstrated that smectic defects can constitute efficient traps
for NPs as small as 5nm, due to the combination of highly localized trapping sites
characterized by deep trapping energy profile and large-scale elastic deformations induced in
the LC film. In oily streaks, they can be precisely oriented along directions of anisotropy
imposed by the substrate. This allowed us to produce arrays of straight chains of single NPs
separated by distances varying between some !m and 1.5 nm when the NP concentration is
increased. As a consequence, LSPR of GNPs/LC systems can be tuned by polarization, in a
matter controllable by the concentration of GNPs. These results also open the route for
alignments of a vast number of NP types.
Experimental
The optical properties of GNPs were investigated with a LOT Oriel MS260i spectrometer
coupled to an upright optical microscope (Olympus BX 51) to probe a 40x40 !m2area. QDs
fluorescence was investigated with an inverted Olympus IX71 optical microscope with an
oil-immersed objective (x100, NA=1.4) connected to a CCD camera. GNPs visualization was
performed on a field emission SEM, Zeiss Supra 40.
Acknowledgements
We thank Agence Nationale de la recherche (ANR) for financial support corresponding to
projects ANR-07-Nano-032 and ANR-09-Nano 003 and Laurent Coolen for fluorescence
microscopy experiments and discussions.
Received: ((will be filled in by the editorial staff)) Revised: ((will be filled in by the editorial staff)) Published online: ((will be filled in by the editorial staff)) _[1] M. Grzelczak, J. Vermant, E.M. Furst, and L.M. Liz-Marzan, ACS Nano, 2010,4, 3591.
_[2] G. M. Whitesides, J. K. Kriebel, and B. T. Mayers et al., in Nanoscale Assembly, (ed:D.J.
Lockwood), Chem. and Mat. Sci. Nanostruct. Sci. and Tech. , Springer, 2005, ch. 9.
_[3] J.P. Michel, E. Lacaze, M. Alba, M. de Boissieu, M. Gailhanou, and M. Goldmann,
Phys. Rev. E, 2004,70, 11709.
_[4] B. Zappone and E. Lacaze Phys. Rev. E, 2008,78, 061704.
_[5] B. Zappone, E. Lacaze, H. Ayeb, M. Goldmann, N. Boudet, P. Barois, and M. Alba, Soft
_[6] Y.H Kim, D.K.Yoon, H.S.Jeong, O.D. Lavrentovich and H.T. Jung, Adv. Funct. Mat.,
2011,21, 610.
_[7] D. K. Yoon, M. C. Choi, Y.H. Kim, M. W. Kim, O. D. Lavrentovich and H-T Jung, Nat.
Mat., 2007,6, 866.
_[8] J. B. Fleury,D. Pires, and Y. Galerne, Phys. Rev. Lett., 2009, 103, 267801.
_[9] D. Pires, J-B. Fleury, and Y. Galerne, Phys. Rev. Lett., 2007, 98, 247801.
_[10] P. Poulin, H. Stark, T. C. Lubensky and D. A. Weitz, Science,1997, 275, 1770.
_[11] A. Jakli, B. Senyuk, G. Liao, O.D. Lavrentovich, Soft Matter, 2008, 4, 2471
_[12] H.Yoshida, Y. Tanaka, K. Kawamoto, H. Kubo, T. Tsuda,
A. Fujii, S. Kuwabata, H. Kikuchi, and M. Ozaki, Appl. Phys. Express, 2009, 2, 121501.
_[13] E.Karatairi, B. Rozic, Z. Kutnjak, V. Tzitzios, G. Nounesis, G. Cordoyiannis, J. Thoen,
C. Glorieux, and S. Kralj, Phys. Rev. E, 2010, 81, 041703.
_[14] H. K. Bisoyi and S. Kumar, Chem. Soc. Rev., 2011, 40, 306.
_[15] M. Skarabott and I. Musevic, Soft Matter, 2010, 6, 5476.
_[16] J.P. Michel, E. Lacaze, M. Goldmann, M. Gailhanou, M. de Boissieu, and M. Alba,
Phys. Rev. Lett., 2006, 96, 027803.
_[17] M. Kléman, Lines and Walls in Liquid Crystals, Magnetic Systems and
Various Ordered Media, John Wiley & Sons, 1983.
_[18] G.A. Rance, D. H. Marsh, A. N. Khlobystov, Chem. Phys. Lett., 2008, 460, 230.
_[19] M. Nirmal, B. O. Dabbousi, M. G. Bawendi, J. J. Macklin, J. K. Trautman, T. D. Harris
and L. E. Brus, Nature, 1996, 383, 802.
_[20] P. Mulvaney, Langmuir, 1996,12, 788.
_[21] P. B. Johnson and R. W. Christy, Phys. Rev. B, 1972,6, 4370.
_[22] E. Lacaze,J.P. Michel, M. Goldmann, M. Gailhanou, M. de Boissieu, and M. Alba et al.
_[24] H. Yockell-Lelievre, D. Gingras, R. Vallee, A. M. Ritcey, J. Phys. Chem. C, 2009, 113,
21293.
_[25] N. G. Khlebtsov and L. A. Dykman, J. Quant. Spectrosc. Radiat. Transfer, 2010, 111, 1.
_[25] M. Ravnik, G.P.Alexander, J.M.Yeomans, S. $umer, Proc. Natl. Acad. Sci. U. S. A.,
2011, 108, 5188.
_[26] D. Voloschenko, O.P. Pishnyak, S.V. Shiyanovskii, , O.D. Lavrentovich,
Phys. Rev. E, 2002, 65, 060701
_[27] B. Rozic, V. Tzitzios, E. Karatairi, U. Tkalec, G. Nounesis, Z. Kutnjak, G.
Cordoyiannis, R. Rosso,E.G. Virga, I. Musevic, and S. Kralj, Eur. Phys. J. E, 2011, 34, 17.
Table of contents
Keyword: Liquid crystal; nanoparticles; self-assembly; Surface Plasmon Resonance; Optically Active Materials.
D. Coursault, J. Grand, B. Zappone, H. Ayeb, G. Lévi, N. Félidj and E. Lacaze*
Title
Linear self-assembly of nanoparticles within liquid crystal defect arrays.
ToC figure ((55 mm broad, 50 mm high, or 110 mm broad, 20 mm high))
In presence of oriented smectic liquid crystal defects, hybrid systems nano-particles/liquid crystals form straight chains of nano-particles of length larger than tens of !m and width equal to one single nano-particle. The interparticle distance in a chain can be varied between few !m and 1.5nm, highlighting the control of optical absorption by light polarization monitored by gold nano-particles concentration.