Accepted 8 July 2002 Published online 23 September 2002
Determinants of loss of mammal species during
the Late Quaternary ‘megafauna’ extinctions: life
history and ecology, but not body size
C. N. Johnson
School of Tropical Biology, James Cook University, Townsville, QLD 4811, Australia
(christopher.johnson@ jcu.edu.au)
Extinctions of megafauna species during the Late Quaternary dramatically reduced the global diversity of mammals. There is intense debate over the causes of these extinctions, especially regarding the extent to which humans were involved. Most previous analyses of this question have focused on chronologies of extinction and on the archaeological evidence for human–megafauna interaction. Here, I take an alterna-tive approach: comparison of the biological traits of extinct species with those of survivors. I use this to demonstrate two general features of the selectivity of Late Quaternary mammal extinctions in Australia, Eurasia, the Americas and Madagascar. First, large size was not directly related to risk of extinction; rather, species with slow reproductive rates were at high risk regardless of their body size. This finding rejects the ‘blitzkrieg’ model of overkill, in which extinctions were completed during brief intervals of selective hunting of large-bodied prey. Second, species that survived despite having low reproductive rates typically occurred in closed habitats and many were arboreal or nocturnal. Such traits would have reduced their exposure to direct interaction with people. Therefore, although this analysis rejects blitzkrieg as a general scenario for the mammal megafauna extinctions, it is consistent with extinctions being due to interaction with human populations.
Keywords: extinction risk; megafauna; Pleistocene extinctions; overkill
1. INTRODUCTION
Giant kangaroos, mammoths, ground sloths and other mammal ‘megafauna’ went extinct from many parts of the world between ca. 100 000 and 1000 years ago. Some human involvement in these extinctions has long been sus-pected because, where they have been securely dated, they followed quite closely the spread of modern Homo sapiens (Martin & Steadman 1999; Miller et al. 1999; Roberts et
al. 2001). However, there is persistent controversy over
both the degree to which the extinctions can be attributed to people rather than to other factors such as climate change, and over the nature of human impact on megafauna species.
Several authors, particularly Martin (1973, 1984), Flannery (1990) and Flannery & Roberts (1999), have proposed that the extinctions were due to heavy and selec-tive hunting by people of large-bodied prey. This model, often referred to as ‘blitzkrieg’, envisages that when people invaded new lands they found diverse populations of large-bodied mammals that were both abundant and easy to kill, and that they initially specialized in the hunting of these large prey. This intensive exploitation of large prey supported rapid growth and geographical expansion of invading human populations, but it quickly resulted in widespread hunting to extinction of megafauna species. The blitzkrieg model has recently been supported for the North American case by population models which suggest that hunting alone could have produced the observed pat-tern of extinctions within short periods of time (Alroy 2001). However, the idea is strongly contested, mainly on the grounds that the archaeological record provides too little support for heavy hunting of large mammals that
Proc. R. Soc. Lond. B (2002) 269, 2221–2227 2221 2002 The Royal Society
went extinct, and that many of the presumed victims of over-hunting cannot be shown with certainty to have been extant when humans appeared (Grayson 2001; Grayson
et al. 2001; Wroe et al. 2002). Also, in Australia, where
there is no firm evidence of hunting of extinct megafauna, chronologies of human arrival and megafauna extinction may be consistent with a long period of coexistence of people and at least some megafauna species (Roberts et
al. 2001; Wroe & Field 2001; Wroe et al. 2002).
There are counter-arguments to these objections: the extinctions may truly have been so rapid that little archae-ological evidence of killing was left behind (Martin 1984), and the sparseness of extinction chronologies for many species makes it unlikely that the fossil record would reveal overlap with people if that overlap was brief. There is debate over both the timing of human arrival and of megafauna extinctions in Australia (see Thorne et al. 1999; Field et al. 2001; Roberts et al. 2001; Wroe et al. 2002), and it may be many years before the pattern of temporal overlap can be satisfactorily resolved for this case. Thus, it may be that palaeontological and archaeol-ogical data will not be able to settle arguments over the causes of megafauna extinctions in the near future, and it is important that independent tests be applied to the ques-tion.
This paper introduces such an independent approach: I re-evaluate the selectivity of Late Quaternary mammal extinctions by comparing the characteristics of species that went extinct with those of survivors. This has been little explored in the literature to date, beyond the general observation that large (or relatively large) species were more likely to go extinct. The value of the approach is that it might identify characteristics of species that made them
vulnerable to extinction, and thereby indicate what causal factors were involved. Here, I use it to test the following two predictions of the hypothesis that blitzkrieg, or some other form of direct negative impact from people, caused Late Quaternary mammal extinctions in northern Eurasia, Australia, the Americas and Madagascar.
First, if blitzkrieg happened, body size should have been directly related to extinction risk, independent of effects of reproductive rate on extinction. Blitzkrieg assumes that large mammals were selectively hunted, because they pro-vided a large reward for hunting effort and, having few natural predators, were naive towards human hunters and easy to kill. Thus, the megafauna are thought to have been vulnerable as a direct result of their large size. However, large size is also generally associated with slow repro-duction, and slowly reproducing species are vulnerable to over-harvest because the rate at which a population can replace animals killed by hunters is low (Holdaway & Jacomb 2000; Alroy 2001). Slow reproduction could have predisposed large species to extinction by over-hunting even if hunting was not size-selective. Therefore, we need to separate the effects of body size and reproductive rate on extinction risk and test for a relationship of extinction risk to body size after the effects of reproductive rate have been removed.
Second, if the extinctions were caused by hunting, or some other interaction with people, then extinction risk should have been lower for species that had little direct exposure to people (Martin 1984). Because people are predominantly day-active, terrestrial and hunt by sight, species that were nocturnal, arboreal or lived in dense veg-etation or habitats that were otherwise visually occluded should have enjoyed some protection. Species that occurred at very high latitudes or altitudes may also have been protected because in such extreme environments human occupation may have been intermittent. There-fore, species that might otherwise have been at high risk because of body size, reproductive rate, or both, may have survived if they had some of these protective traits. This prediction follows from the blitzkrieg model, but also any other hypothesis that invokes interactions with people as the cause of extinction.
2. METHODS
The analysis dealt only with extinctions in Australia, North and South America (excluding the Antilles), northern Eurasia (as defined by Stuart (1991)) and Madagascar between 100 000 and 1000 years ago, because mammal extinctions in these regions and during this period are well documented and data are available for sufficient numbers of extinct species and living relatives to make the comparisons attempted below.
Separating the effects of body mass and reproductive rate on extinction risk presents difficulties, because among closely related species the two variables are strongly associated, and reproductive rates for extinct species are best estimated from relationships of reproductive rate to mass determined for living relatives. My approach was to: (i) identify groups of mammals in which some but not all species went extinct; (ii) use regressions of reproductive rate on body mass for living species to derive estimates of reproductive rate for extinct species in these groups; and (iii) test whether body mass or reproductive rate best accounted for variation in extinction among groups.
I conducted this analysis at the level of families (or in some cases super-families), because relationships between body mass and reproductive rate for mammals are typically strong within lineages at this taxonomic level, but reproductive rate relative to body mass varies widely among such lineages. All families or super-families with at least three known survivors and three extinct species from the study regions and for which data were available were included in this analysis. This criterion provided at least three points in each category for the regression analyses, and made it possible to identify the thresholds of body mass and reproductive rate that were associated with high risk of extinc-tion in each group.
I found nine groups of mammals that met these criteria (see table 1). (Super-familial classification of the lemurs is unsettled but they fall into two major groups (Purvis 1995): the Cheiroga-leidae (mouse lemurs), which are all small and suffered no extinctions, and other lemurs (including indris and aye-ayes) which form a monophyletic group containing both extant and extinct species over a wide range of body sizes. Accordingly, all lemurs other than mouse lemurs were included as a single group.) Data on body mass (means of males and females) of living species were taken from Eisenberg (1989), Redford & Eisenberg (1992), Strahan (1995), Eisenberg & Redford (1999) and Nowak (1999), and of extinct species from Anderson (1984), Murray (1991), Stuart (1991), Godfrey et al. (1997), Flannery & Roberts (1999) and Alroy (2001). Reproductive rate was measured as the number of offspring produced per adult female per year. This measure incorporates variation due to litter size and inter-birth interval. Data on reproductive rates were obtained from Eisenberg (1989), Redford & Eisenberg (1992), Hayssen et al. (1993), Eisenberg & Redford (1999), Nowak (1999) and Fisher et al. (2001). Habitat preference was scored under two categories to distinguish habitats with low and high visual occlusion: ‘open’ habitats were treeless or lightly wooded plains and low hills, including prairies, tundra, savannah and other such habitats; and ‘closed’ habitats were forests, moun-tainous regions with complex or broken topography, and flor-istically complex ecotonal habitats. Species that regularly used burrows were classified as occupying closed habitats. Data for living species were taken from Nowak (1999) and Macdonald (2001), and for extinct species from Kurten & Anderson (1980), Stuart (1982, 1991), Anderson (1984), Rich & Van Tets (1985), Murray (1991) and Godfrey et al. (1997). For many extinct species no reliable inferences on habitat preference can be made, so the dataset represents only a sampling of the habitats used by extinct species. I also recorded whether living species were nocturnal and whether the geographical range is predominantly at high latitude (more than 80°) or high altitude (defined as above the tree line). Species lists and raw data for all analyses are provided in an electronic appendix to this paper available on The Royal Society’s Publication Web site.
3. RESULTS
The relationships of body mass to extinction risk in the nine groups of mammals available for analysis are summa-rized in table 1. Risk of extinction increased with body mass in all cases, but the body mass threshold at which the probability of extinction exceeded 0.5 varied widely, from under 10 kg in lemurs to more than 350 kg in deer and bovids. I used regressions of reproductive rate (number of offspring produced per female per year) on body mass of living species in each group to derive for
Table 1. Thresholds of body mass above which 50% or more species went extinct in nine groups of mammals which lost three or more species in the Late Quaternary megafauna extinctions of Australia, northern Eurasia, the Americas and Madagascar, but which have three or more living species.
(Thresholds are defined by logistic regression (significance values of the regression models are shown). The ratio of mean body mass of extinct to living species, and the overall size range, is also shown for each group. Raw data are provided in the electronic appendix to this paper.)
mass threshold (kg)
group (with size range, kg) 2 p mass ratio
1. lemurs (0.70–200) 8 39.89 ⬍0.001 14.73 2. Vombatoidea: wombats and koala (5.1–200) 23 2.833 0.092 3.33 3. Macropodidae: kangaroos (1.3–250) 32 55.78 ⬍0.001 7.25 4. Dasypodidae: armadillos and pampatheres (0.1–312) 34 15.01 ⬍0.001 27.71 5. Tayassuidae: peccaries (20–73.5) 42 6.73 0.01 2.25 6. Felidae: cats (4–200) 96 16.01 ⬍0.001 5.48 7. Ursidae: bears (100–500) 315 3.37 0.066 1.69 8. Cervidae: deer (8.2–700) 371 6.92 0.008 3.24 9. Bovidae: cattle, goats, antelope etc. (32–1000) 386 10.11 0.002 4.04
body mass (kg) at extinction threshold
0 0.4 0.8 1.2 1.6 2 reproductive rate (offspring female–1 yr–1)
10 100 1000 2 3 4 5 6 7 8 1 9
Figure 1. Relationship between the standard reproductive rate (offspring female⫺1yr⫺1for a 54 kg species) and the body mass at which the probability of extinction exceeded 0.5 for the nine groups of mammals listed (with identifying numbers) in table 1.
it a size-standardized measure of reproductive rate. This measure was the predicted reproductive rate at 54 kg (the geometric mean of the extinction thresholds for all nine groups), and it was strongly related to the mass threshold for extinction (F1,7= 15.66, p ⬍ 0.01; figure 1). That is,
extinction reached down to smaller body sizes in groups with low reproductive rates relative to body mass. This relationship was re-tested using the method of inde-pendent contrasts (Purvis & Rambaut 1995) to control for effects of phylogeny (using the mammal phylogeny of Murphy et al. (2001)) and remained significant (F1,6= 9.03, p = 0.01).
These analyses demonstrate correlations of both body mass and reproductive rate with extinction. However, of these two variables, only reproductive rate is needed to
0 1 2 3
log mass (kg)
reproductive rate (offspring yr
–
1)
1
0.1 10 100 1000 10 000 > 4
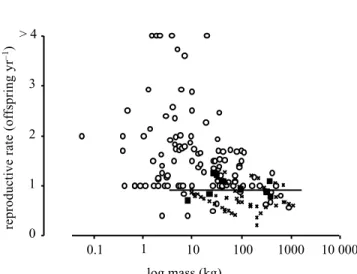
Figure 2. Relationship between body mass and reproductive rate for all species from the nine groups of figure 1 and table 1. Reproductive rates for extinct species were predicted from within-group relationships between (log) body mass and (log) reproductive rate among living species. Circles, extant species; crosses, extinct species. Solid squares represent the values of body mass and reproductive rates at which extinction probability reached 0.5 for each group, and the line is the regression fitted through these points.
explain the pattern of extinction. This is shown in figure 2, which plots body mass and reproductive rate for living and extinct species, together with the boundary between high and low extinction risk across all groups. This boundary was determined by deriving an estimate of reproductive rate at the body mass threshold for extinction in each group, and fitting a regression through those points (F1,7= 0.0003, p = 0.99). The boundary is horizontal on
this graph, a consequence of the fact that extinction elim-inated species at nearly the same threshold of reproductive rate in all groups, regardless of differences between groups in distributions of body size. If body size alone had determined risk of extinction, this boundary would have been vertical: an additive or interactive effect of body mass and reproductive rate on extinction would have been indi-cated by a sloped line.
alpine high latitude arboreal, closed habitat nocturnal, closed habitat arboreal, nocturnal,
closed habitat alpine
high latitude nocturnal arboreal closed habitat 0 2 4 6 8 10 12 14 16 18 20 number of occurrences (a) (b) closed habitat
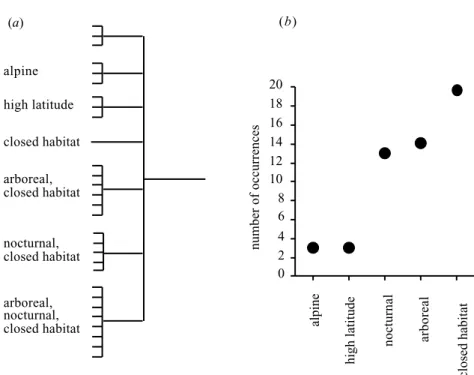
Figure 3. Ecological traits of ‘survivors’ (living species from the regions encompassed by this analysis with reproductive rates less than 0.98 offspring female⫺1yr⫺1). (a) Classification of species according to the number of traits possessed by each, where each tip of the tree diagram represents a single species and (b) frequency of occurrence of each trait in this set of species. The traits are those hypothesized in § 1 to have reduced exposure to humans.
Many species of extinct megafauna, such as diproto-dons, mammoths and glyptodonts, are not included in this analysis, because they belonged to groups that disap-peared entirely. Such species were all large with (almost certainly) very low reproductive rates, so they would fall in the lower right of figure 2. Because they left no survivors these groups cannot help us to characterize the boundary between extinction and survival in Late Quaternary mam-mals. However, if data on extinct species from such groups could have been included, it is very unlikely that they would have altered the pattern revealed in figure 2.
Over all groups, the mean reproductive rate at which
the probability of extinction reached 0.5 was
0.98 offspring female⫺1yr⫺1(95% confidence limits 0.81– 1.16). I found data on 29 living species, representing 14 families, from the regions covered by this analysis with reproductive rates below this threshold (see the electronic appendix to this paper; the search for slow-reproducing living species was not restricted to the nine groups used in the analysis above). Because these species survived despite their low reproductive rates, they can be used to test the prediction that if interaction with people caused extinc-tion, then species with less direct exposure to people would have been at lesser risk.
These ‘survivor’ species are predominantly from closed habitats, and many are arboreal and/or nocturnal (figure 3). Only three species possess none of the traits hypothes-ized above (see § 1) to reduce exposure to people (of these three, the European bison Bison bonasus and the American bison B. bison have almost been driven extinct by hunting in recent times; only the short-beaked echidna
Tachyg-lossus aculeatus remains abundant). There is a significantly
higher percentage of arboreal species among survivors than among extinct species (68% versus 22.8%, n= 29 and 160;2= 13.18, d.f. = 1, p ⬍ 0.001; this comparison
was restricted to species of less than 100 kg because there
are no arboreal species above this weight). The percentage of species from closed habitats is significantly higher for survivors (75%, n= 29) than for extinct species (41.7%,
n= 84;2= 9.17, d.f. = 1, p ⬍ 0.01). Proportions of
spec-ies that were nocturnal cannot be compared in this way because of uncertainty over whether extinct species were nocturnal or diurnal.
Most of the 29 survivors are from the Americas and Australia, with only three from northern Eurasia and two from Madagascar. In the Americas and Australia, the pat-terns of selectivity of extinction in relation to ecological traits were evidently very similar. Thus, in Australia, 86% (n= 7) of survivors are either arboreal or occupy closed habitats, while in the Americas, 85% (n= 13) of survivors have these characteristics (this comparison excluded American survivors from high latitudes or high altitudes, because such regions are either not represented or are of very small extent in Australia). Among extinct species in Australia, 28% (n= 29) are either arboreal or occupy closed habitats, while in the Americas this applied to 32% (n= 28) of extinct species.
4. DISCUSSION
The Late Quaternary ‘megafauna’ extinctions removed mammal species in ways that were highly consistent for different mammal groups and regions. A high proportion of species with low reproductive rates went extinct, except that species that were arboreal or lived in closed habitats were more likely to survive than were terrestrial species of open habitats; nocturnal species may also have enjoyed some protection. It is not possible to identify any general effect of body size on extinction risk that was independent of the association of body size and reproductive rate. This analysis identifies several groups in which extinction removed species at body mass thresholds well below those
typically used to define ‘megafauna’ (e.g. 44 kg or 100 kg (Stuart 1991; Martin & Steadman 1999)). The vulner-ability of these groups at relatively small body sizes is attributable to their very low reproductive rates relative to body size. Some groups for which there were insufficient data for inclusion in this analysis are also informative on this point. For example, all echidnas (family Tachyglossidae) above a body mass of about 7 kg went extinct in the Australian Late Pleistocene, and living ech-idnas have remarkably low reproductive rates for mam-mals of their small size. Likewise, all two-toed sloths and their relatives (super-family Megatherioidea) above a mass of ca. 6 kg were lost (these losses included some inter-mediate-sized forms (Webb & Perrigo 1985; Nowak 1999) as well as many of the gigantic ground sloths). Given the low reproductive rates of surviving sloths, any species above a mass of 6 kg presumably had exceptionally slow reproduction.
The results of this analysis reject the hypothesis that these extinctions were caused by selective hunting of large-bodied species, and by implication they cast doubt on some of the subsidiary elements of the blitzkrieg model, such as that the extinctions were very rapid and that naiv-ety to predation accounts for the apparent ease with which large species were driven extinct. These results have three other implications for our understanding of Late Quatern-ary mammal extinctions.
First, the megafauna extinctions in northern Eurasia, which are considered by most authors to have been less severe than the truly catastrophic losses in the Americas and Australia, actually left fewer survivors among species with reproductive rates in the susceptible range; viewed in this way, the northern Eurasian extinctions were at least as severe as those on the other two continents. The fact that fewer large-bodied species went extinct in northern Eurasia is explained by the relatively high reproductive rates of mammal groups there; extinctions cut deeper into the body size range of mammals in the Americas and (especially) Australia because of the large representation in those faunas of lineages of slowly reproducing mammals like xenarthans and marsupials. The comparable severity of the extinction events in northern Eurasia, the Americas and Australia further indicates that prey naivety was not a significant factor in the extinctions, because although mammals in the Americas and Australia had no prior experience of human predation when they met modern
Homo sapiens, Eurasian mammals had experienced a long
history of interaction with earlier human populations cap-able of hunting large mammals (Roebroeks 2001). On this point, it is interesting to note that the pattern of extinction of large carnivores (represented by cats and, to a lesser extent, bears; see figure 1) was very similar to that revealed for the other families. This is what one would expect if predators and herbivores were equally vulnerable to the same extinction-causing factor. Given that the large cats were very well-armed, it therefore seems unlikely that an inability to mount a defence against hunters was a factor in the vulnerability to extinction of large and slowly repro-ducing species in the Late Quaternary.
Second, the analysis provides an explanation for the low rates of Late Quaternary mammal extinction in southern Eurasia. One might think that the arrival of modern humans in southern Eurasia should have had similar
effects on mammal populations as in northern Eurasia but, although giant deer and mammoths went extinct in China (Anderson 1984; Tung-Shen & Xing-Guo 1984), eleph-ants, rhinos, large primates and other slowly reproducing species survived throughout the wetter parts of south Asia. Such species predominantly occupy closed forests and some are arboreal, so their persistence is consistent with the pattern of extinction and survival of mammal species elsewhere.
Third, although the pattern of selectivity of extinction shown here is inconsistent with selective and heavy pre-dation on large prey as a general scenario for the megafauna extinctions, the pattern of survival and extinc-tion of species with low reproductive rates is nonetheless consistent with some interaction with humans as the cause of extinction. This could have been low-level hunting by human populations not specialized for exploitation of large prey. Low rates of killing can have substantial impacts on species with low fecundity, because in such species a small increment of mortality from hunting may be capable of holding mortality rates above recruitment rates, and if populations remain susceptible to hunting even as density declines to critically low levels, this may ultimately cause extinction. There is no reason to think that these effects should have been rapid. It is not even necessary to assume that killing of adults was significant: occasional killing of juveniles or sub-adults can easily reduce recruitment rates in species that produce single young at long intervals, as was almost certainly true of practically all extinct mammal megafauna. Viewing human predation on megafauna in this way provides an alternative solution to the problem of why, if hunting caused extinction, the archaeological evidence of killing by people is so unconvincing: we need not assume that at any time human predation was responsible for a high pro-portion of deaths in species that were ultimately driven extinct by over-hunting. This is in contrast to the blitz-krieg model, which envisages brief intervals during which a high proportion of deaths were due to people. If the absolute rate of killing was never high, and most deaths continued to be ‘natural’ as populations declined towards extinction, the number of deaths caused by people and the proportion of fossils showing evidence of human pre-dation or interference might both have been low. In that case, the archaeological evidence of killing would be very sparse and in many cases could well be effectively veiled by its rarity. In particular, kill sites representing the simul-taneous slaughter of large numbers of prey need not be expected.
Other possible forms of interaction consistent with the pattern identified here are indirect effects of predation, whereby a low level of predation elicits such strong avoid-ance of the predator that access to key resources is severely curtailed, or direct competition for critical resources. It has been argued, for example, that competition with people for access to den sites contributed to the decline of the cave bear Ursus spelaeus in Europe (Grayson 2001). The pattern is also consistent with transfer of disease organisms from people as proposed by MacPhee & Marx (1997), but for counter-arguments to that proposal see Alroy (1999).
The major alternative to human impact as an expla-nation for the Late Quaternary megafauna extinctions is
environmental change, driven either by climate change or by human impact on the environment. In Australia, for example, it has been argued that a combination of increas-ing aridity durincreas-ing the period leadincreas-ing up the last glacial maximum (ca. 20 000 years ago), together with firing of the landscape by people, may have reduced the area of shrublands and woodlands and caused the extinctions of large species that depended on those habitats (Miller et al. 1999). According to this thinking, hunting need not have accompanied the extinctions, but it may have increased the risk of extinction for species already stressed by environmental change. Thus, Stuart (1991) suggests that large mammals from northern Europe may have gone extinct because the impacts of hunting were amplified by climate-driven reduction or fragmentation of geographical ranges. It is not always clear what predictions on the selec-tivity of extinction in relation to reproductive rate, habitat and behaviour are implied by these models, but in at least some cases they are certainly counter to the patterns described in this paper. For example, firing of the Aus-tralian landscape would presumably have harmed species that lived in dense vegetation or were arboreal, and ben-efited open-country species, but the pattern of survival and extinction actually went in the opposite direction.
Perhaps the most striking feature revealed by this analy-sis is the conanaly-sistency of the pattern of loss of species in the regions considered. In each case, the majority of spec-ies with reproductive rates below one offspring per female per year went extinct, unless they were arboreal or lived in closed habitats. The impact of reproductive rate on risk of extinction was quantitatively alike in different regions and for different groups of mammals, and the power of habitat and arboreality to alleviate that risk was similar. If consistency of effect implies consistency of cause, we can conclude that the same extinction-causing process oper-ated in all these cases. A common-sense view of the disap-pearance of the Late Quaternary ‘megafauna’ is that the causes of extinction of so many and varied mammal groups from such a range of environmental contexts may well have been multi-factorial, that different combinations of factors may have applied in each case, and that attempts to generalize processes across all cases are unrealistic. But perhaps the answer will turn out to be simple after all.
I thank David Bowman, Barry Brook, Sean Connolly, Chris Dickman, Peter Jarman, Andrew Krockenberger, Brad Mur-ray, Bert Roberts and Lin Schwarzkopf for comments on pre-vious versions of the manuscript. I am particularly grateful to Sean Connolly for his suggestions regarding indirect effects, and to Stephen Wroe for preprints and valuable discussion.
REFERENCES
Alroy, J. 1999 Putting North America’s end-Pleistocene megafaunal extinction in context: large-scale analyses of spa-tial patterns, extinction rates, and size distributions. In
Extinctions in near time: causes, contexts and consequences (ed.
R. D. E. MacPhee), pp. 105–144. New York: Kluwer/ Plenum.
Alroy, J. 2001 A multispecies overkill simulation of the end-Pleistocene megafaunal mass extinction. Science 292,
1893–1896.
Anderson, E. 1984 Who’s who in the Pleistocene: a mam-malian bestiary. In Quaternary extinctions: a prehistoric
revol-ution (ed. P. S. Martin & R. G. Klein), pp. 40–89. Tucson,
AZ: The University of Arizona Press.
Eisenberg, J. F. 1989 Mammals of the neotropics, vol. 1. The
northern neotropics. University of Chicago Press.
Eisenberg, J. F. & Redford, K. H. 1999 Mammals of the
neo-tropics: the central neotropics, vol. 3. University of Chicago
Press.
Field, J. (and 12 others) 2001 Archaeology and Australian megafauna. Science 294 (see www.sciencemag.org/cgi/content/ full/294/5540/7a).
Fisher, D. O., Owens, I. P. F. & Johnson, C. N. 2001 The eco-logical basis of life-history variation in marsupials. Ecology
82, 3531–3540.
Flannery, T. F. 1990 Pleistocene faunal loss: implications of the aftershock for Australia’s past and future. Archaeol.
Oce-ania 25, 45–67.
Flannery, T. F. & Roberts, R. G. 1999 Late Quaternary extinc-tions in Australasia: an overview. In Extincextinc-tions in near time:
causes, contexts and consequences (ed. R. D. E. MacPhee), pp.
239–256. New York: Kluwer/Plenum.
Godfrey, L. R., Jungers, W. L., Reed, K. E., Simons, E. L. & Chatrath, P. S. 1997 Subfossil lemurs. Inferences about past and present primate communities in Madagascar. In Natural
change and human impact in Madagascar (ed. S. Goodman &
B. Patterson), pp. 218–256. Washington, DC: Smithsonian Institution Press.
Grayson, D. K. 2001 The archaeological record of human impacts on animal populations. J. World Prehistory 15, 1–68. Grayson, D. K., Alroy, J., Slaughter, R. & Skulan, J. 2001 Did human hunting cause mass extinction? Science 294, 1459– 1462.
Hayssen, V., Tienhoven, A. V. & Tienhoven, A. V. 1993
Asdell’s patterns of mammalian reproduction. Ithaca, NY:
Com-stock.
Holdaway, R. N. & Jacomb, C. 2000 Rapid extinction of the moas (Aves: Dinornithiformes): model, test and impli-cations. Science 287, 2250–2254.
Kurten, B. & Anderson, E. 1980 Pleistocene mammals of North
America. New York: Columbia University Press.
Macdonald, D. (ed.) 2001 The newencyclopedia of mammals. Oxford University Press.
MacPhee, R. D. E. & Marx, P. A. 1997 The 40 000-year plague. Humans, hyperdisease, and first-contact extinctions. In Natural change and human impact in Madagascar (ed. S. Goodman & B. Patterson), pp. 169–217. Washington, DC: Smithsonian Institution Press.
Martin, P. S. 1973 The discovery of America. Science 179, 969–974.
Martin, P. S. 1984 Prehistoric overkill: the global model. In
Quaternary extinctions (ed. P. S. Martin & R. G. Klein), pp.
354–403. Tucson, AZ: University of Arizona Press. Martin, P. S. & Steadman, D. W. 1999 Prehistoric extinctions
on islands and continents. In Extinctions in near time: causes,
contexts and consequences (ed. R. D. E. MacPhee), pp. 17–
56. New York: Kluwer/Plenum.
Miller, G. H., Magee, J. W., Johnson, B. J., Fogel, M. L., Spooner, N. A., McCulloch, M. T. & Ayliffe, L. K. 1999 Pleistocene extinction of Genyornis newtoni: human impact on Australian megafauna. Science 283, 205–208.
Murphy, W. J., Eizirik, E., Johnson, W. E., Zhang, Y. P., Ryder, O. A. & O’Brien, S. J. 2001 Molecular phylogenetics and the origins of placental mammals. Nature 409, 614–618. Murray, P. 1991 The Pleistocene megafauna of Australia. In
Vertebrate palaeontology of Australasia (ed. P. Vickers-Rich,
J. M. Monaghan, R. F. Baird & T. H. Rich), pp. 1071– 1164. Melbourne: Pioneer Design Studio & Monash Univer-sity Publications Committee.
Nowak, R. M. 1999 Walker’s mammals of the world. Baltimore, MD: The Johns Hopkins University Press.
Purvis, A. 1995 A composite estimate of primate phylogeny.
Phil. Trans. R. Soc. Lond. B 348, 405–421.
Purvis, A. & Rambaut, A. 1995 Comparative analysis by inde-pendent contrasts (Caic): an Apple Macintosh application for analysing comparative data. Comput. Applicat. Biosci. 11, 247–251.
Redford, K. H. & Eisenberg, J. F. 1992 Mammals of the
neotrop-ics, vol. 2. The southern cone. University of Chicago Press.
Rich, P. V. & Van Tets, G. F. 1985 Kadimakara: extinct
ver-tebrates of Australia. Melbourne: Pioneer Design Studio.
Roberts, R. G. (and 10 others) 2001 New ages for the last Aus-tralian megafauna: continent-wide extinction about 46 000 years ago. Science 292, 1888–1892.
Roebroeks, W. 2001 Hominid behaviour and the earliest occu-pation of Europe: an exploration. J. Hum. Evol. 41, 437– 461.
Strahan, R. 1995 The mammals of Australia. Sydney: Reed Books.
Stuart, A. J. 1982 Pleistocene vertebrates in the British Isles. Lon-don: Longman.
Stuart, A. J. 1991 Mammalian extinctions in the Late Pleisto-cene of northern Eurasia and North America. Biol. Rev. 66, 453–562.
Thorne, A., Grun, R., Mortimer, C., Spooner, J. J.,
McCul-loch, M., Taylor, L. & Curnoe, D. 1999 Australia’s oldest human remains: age of the Lake Mungo 3 skeleton. J. Hum.
Evol. 36, 591–612.
Tung-Shen, L. & Xing-Guo, L. 1984 Mammoths in China. In
Quaternary extinctions: a prehistoric revolution (ed. P. S.
Mar-tin & R. G. Klein), pp. 517–527. Tucson, AZ: The Univer-sity of Arizona Press.
Webb, S. D. & Perrigo, S. 1985 New megalonychid sloths from El Salvador. In The evolution and ecology of armadillos,
sloths, and vermilinguas (ed. G. G. Montgomery), pp. 113–
120. Washington, DC: Smithsonian Institution Press. Wroe, S. & Field, J. 2001 Mystery of megafauna extinctions
remains. Australasian Sci. 25, 21–25.
Wroe, S., Field, J., Fullagar, R. & Jermiin, L. S. 2002 Taking the glitz out of blitzkrieg: another look at late Quaternary extinctions of megafauna and the global overkill parable. J.
World Prehistory. (In the press.)
As this paper exceeds the maximum length normally permitted, the author has agreed to contribute to production costs.
Visit http://www.pubs.royalsoc.ac.uk to see an electronic appendix to this paper.