HAL Id: cea-02439474
https://hal-cea.archives-ouvertes.fr/cea-02439474
Submitted on 26 Feb 2020HAL is a multi-disciplinary open access
archive for the deposit and dissemination of sci-entific research documents, whether they are pub-lished or not. The documents may come from teaching and research institutions in France or abroad, or from public or private research centers.
L’archive ouverte pluridisciplinaire HAL, est destinée au dépôt et à la diffusion de documents scientifiques de niveau recherche, publiés ou non, émanant des établissements d’enseignement et de recherche français ou étrangers, des laboratoires publics ou privés.
recombiners
E. Studer, J. Alengry, D. Abdo, F. Dabbene, S. Kelm, J. Baggemann, E.
Reinecke, H.-J. Allelein
To cite this version:
E. Studer, J. Alengry, D. Abdo, F. Dabbene, S. Kelm, et al.. hydrogen mobilization by passive autocatalytic recombiners. NUTHOS 11 - The 11th International Topical Meeting on Nuclear Reactor Thermal Hydraulics, Operation and Safety, Oct 2016, Gyenongju, South Korea. �cea-02439474�
1/16
Hydrogen mobilization by Passive Autocatalytic Recombiners
E. Studer
1, J. Alengry
2, D. Abdo
1, F. Dabbene
1,
1
CEA/DEN/DM2S
Thermal Hydraulics and Fluid Mechanics Section, CEA Saclay, France,
2
Manpower Company, France,
S. Kelm
3, J. Baggemann
3,E. Reinecke
3, H.-J. Allelein
4.
3
Institute for Energy and Climate Research, Nuclear Waste Management and Reactor Safety (IEK-6), Forschungszentrum Jülich, Germany,
4
Institute for Reactor Safety and Reactor Technology, RWTH Aachen University, Germany.
ABSTRACT
During the course of a severe accident in a Pressurized Water Reactor (PWR), large amount of hydrogen can be released into the containment. As a consequence, the integrity of this third barrier can be compromised by severe combustion events. The strength of hydrogen combustion processes strongly depends on range of gas concentration and thermodynamic variables. It is therefore imperative that accurate gas distribution and mixing experiments and related calculations related to severe accident are conducted. The recent Fukushima accident has recalled that such a massive hydrogen explosions still represents an open safety issues. Consequently, stress tests have been performed and a number of projects have been launched to address identified safety gaps. The MITHYGENE project funded by the French Research Agency ANR and industrial partners (EDF, AREVA and Air Liquide) aimes at improving knowledge on hydrogen risk and related safety management during a severe accident. In this project, the MISTRA facility operated by CEA is used to investigate the capability of a natural convection flow, induced by Passive Autocatalytic Recombiners (PAR) operation, to remobilize an accumulation of light gas trapped below. This important safety issue for designers and safety engineers was identified in several previous projects such as SARNET and SETH-II. As a first step, pre-test calculations with CFD models were performed to design the tests. In the second step, different series of tests were realized in the MISTRA facility, and finally, post-test calculations were conducted to improve the modeling. This experimental and analytical work demonstrates the limited effect on the destratification and the importance for designers to install the PARs also in the lower part of the nuclear reactor containment.
KEYWORDS
MITHYGENE, HYDROGEN, MIXING, PAR, CFD, SEVERE ACCIDENT
1. INTRODUCTION
Hydrogen gas generated during a postulated severe accident due to reactor core degradation is a major safety issue, because a large explosive gas cloud could be formed inside the containment. Therefore, the nuclear research community has ranked the containment atmosphere mixing and stratification phenomena as high-priority issues for nuclear power plant safety [1]. The MITHYGENE project [2] , funded by the French Research Agency ANR and industrial partners (EDF, AREVA and Air Liquide) and launched in early October 2013, has been set-up in order to improve knowledge of hydrogen risk and to support severe accident management. Consequently, it will also enhance hydrogen risk assessment tools by assessing and improving capabilities of the computer codes to predict accident situations, not yet addressed by national and international accident models.
Passive autocatalytic recombiners (PARs) are used in present reactors to mitigate hydrogen risk issues and will continue to be installed in future Pressurized Water Reactors (PWRs). During operation, the
2/16
PARs produce heat, which induces natural convection inside the containment. In the PARIS benchmark organized within the SARNET framework [3], large discrepancies between the participants have been observed on the predicted transient of hydrogen consumption in the lower part of the containment due to a thermal stratification. Similar conclusions have been obtained in the OECD/SETH-2 program [4] in which computer code benchmarks have been conducted based on experiments performed in the PANDA facility (PSI, Switzerland). Full scale PAR performance tests conducted in the German THAI facility have also demonstrated that a thermal stratification resulting from PAR operation affects the hydrogen mixing inside a compartment [5]. Consequently, dedicated experiments are necessary to measure the time scale connected to this intermediate transfer between convection and molar diffusion.
The performed MISTRA tests aim to study the capability of the convective flow induced by the heat source to eliminate a helium pocket simulating hydrogen which could be formed in the lower region of a compartment and below a PAR. In this experiments, PAR operation is simulated by electrical heaters. The tests provide data on natural circulation flow and on the overall distribution of helium in the different regions. Two tests have been conducted with one or two heat sources and a reference test, without heat sources, for comparison. These tests show two different characteristic time scales: a fast mixing phenomenon for the gas mixture surrounding the heat source and the much slower mixing phenomenon for the mixture situated below the source. In parallel, calculations were conducted by JÜLICH and CEA with their respective CFD tools, RD-CFX [5] and TONUS [6]: First of all in a pre-test phase to define the pre-test conditions and then in a post-pre-test phase to improve the models.
The PAR models are described in Section 2 with the associated validation based on separate effect tests performed at CEA. Then, scaling-up issues are examined in Section 3 by the use of large scale experimental results obtained in the MISTRA facility. Finally, validation of both CFD models according to these later results are presented in Section 4. Conclusions and perspectives follow.
2.
DESCRIPTION OF CFD AND PAR MODELS
2.1 CEA models
The CAST3M platform is a computer code for structural analysis and for fluid mechanics modeling, making use of the finite element method (FEM). The code was originally developed by the Commissariat à l’Energie Atomique. A low Mach number asymptotic solver was developed to simulate compressible and incompressible flow of multicomponent gas mixture (TONUS code). Several turbulence models are available. In the present calculations focusing on large scale 3D simulations of containment, turbulence is modelled with a single scale generalized mixing length algebraic equation. A saturation parameter equal to 200 times the molecular viscosity was also introduced to suppress excessive turbulent eddy viscosity near injection areas.
The heater model [7] in the CAST3M/TONUS computer code is based on lumped steady-state mass conservation equation between the inlet and the outlet of the device. For the momentum conservation, a Bernoulli equation is solved:
1 2[𝐾𝑖𝑛+ 𝑘𝑝𝐿𝑝 𝜑𝑝 + 𝐾𝑜𝑢𝑡] 𝑚̇ 𝜌𝑔𝑠𝑝2= 𝑔[(𝜌𝑖𝑛− 𝜌𝑔)𝐿𝑝+ (𝜌𝑖𝑛− 𝜌𝑜𝑢𝑡)𝐿𝑐ℎ] (1)
Finally, two energy balances are used for the plates and the gas: 𝑄 = 𝑚𝑝𝐶𝑝𝑝𝑑𝑇𝑝
𝑑𝑡 + 𝑆𝑝ℎ(𝑇𝑝− 𝑇𝑖𝑛) (2)
𝑚̇𝐶𝑝𝑔(𝑇𝑜𝑢𝑡− 𝑇𝑖𝑛) = 𝑆𝑝ℎ(𝑇𝑝− 𝑇𝑖𝑛) (3)
In these equations, the pressure loss coefficients are obtained according to a) Idel’cik correlations for the inlet and the outlet and b) Hagen-Poiseuille correlations for laminar flow and thin rectangular channels. The heat exchange coefficient is computed according to the Elenbaas formula. This simple model can be coupled with the LP or the CFD approach thanks to the definition of the inlet and the outlet surfaces of the heater device.
This model has been extensively used and validated to model the heater behavior in the ERCOSAM test series [8] and real PAR behavior in the KALI and the H2PAR tests [9]. For the latter cases, the
3/16
chemical reaction has been incorporated assuming a single step complete reaction.
2.2 JÜLICH RD-CFX approach
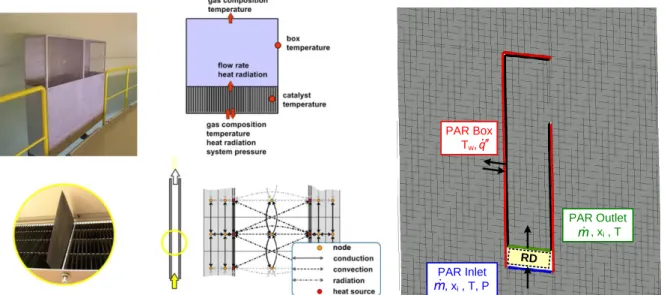
In order to simulate PAR operation as well as its interaction with the hydrogen transport inside containment compartments, the detailed PAR model REKO-DIREKT (RD) [10] has been coupled explicitly to the commercial CFD code ANSYS CFX 16.1 [11] or [12]. Data handling between RD and CFX is performed by means of the CFX Memory Management System (MMS), which can be accessed by both codes. The coupling is performed on a master-slave base, i.e. the RD execution is fully controlled by CFX. For this purpose, the program flow of RD has been modified to run only a single time step for each call. All variable fields are stored in the MMS and read out as an initialization for the next RD call. Figure 1 illustrates the fundamental representation of a PAR in RD as well as the domain decomposition and interface data handling of RD and CFX. The necessary input parameters for a RD run are provided by CFX. Besides the geometrical information of the PAR and the CFD time step size these are the averaged gas composition and temperature at the PAR inlet cross section as well as the absolute pressure level. Based on this information, RD predicts the gas, catalyst and box temperature, the change of the gas composition along the catalyst sheets as well as the gaseous mass flow through the PAR. This mass flow and PAR outlet conditions are fed back to the CFX simulation afterwards. The heat transfer rate between gas and PAR box is calculated based on the averaged PAR box temperature. In order to model the present test cases, the chemical reaction rate has been replaced by a prescribed heat input.
Figure 1: Representation of a AREVA-type PAR (left) in the REKO-DIREKT code (middle) and interface to ANSYS CFX (right)
A more detailed description of the code coupling and data management is given in [13]. The CFD approach based on the SST model used to predict the transport and mixing of hydrogen has been extensively validated for containment typical flows e.g. [14] or [15].
2.3 PAR separate effect tests
Separated effect tests (SET) were performed at CEA to characterize the thermal hydraulic behaviour of Heater devices used to simulate real PARs. These tests were conducted in an open atmosphere in steady-state conditions at different power levels.
The design of the electrically powered heater is is based on the real PAR model Siemens FR90/1-150 [16] (full scale). The flow inlet is located at the bottom face of the Heater while the flow outlet is located at the top, on the front side (see Figure 2). Each Heater is built using stainless-steel and is equipped with a heating module located in a rack at the bottom part of the housing. This module mimics the heating area according to the exothermic hydrogen conversion area of the real PAR: the
RD PAR Inlet , xi , T, P m PAR Box Tw,q PAR Outlet , xm i , T
4/16
Heater is representative of thermal effects but not of chemical effects (hydrogen consumption and steam production). The main geometrical and electrical characteristics of a Heater are summarized in Table 1.
Table 1: main characteristics of MISTRA heater design External dimensions of the housing:
Height (mm) x Width (mm) x Depth (mm) 1003 x 204 x 171
Figure 2: Front picture of the MISTRA heater Internal dimensions of the housing:
Height (mm) x Width (mm) x Depth (mm) 1000 x 200 x 166 Flow inlet dimensions:
Width (mm) x Depth (mm) 200 x 166
Flow outlet dimensions:
Height (mm) x Width (mm) 220 x 160
Number of heating plates 14
Dimension of each heating plate:
Height (mm) x Width (mm) x Depth (mm) 140 x 5.9 x 160
Space between heating plates (mm) 7.83
Maximum electrical power (W) 6000
The characterization test series were conducted at room temperature and pressure in open atmosphere in an experimental hall equipped with a laser diagnostics apparatus. These tests were performed to measure the thermal behaviour of the device at different power levels, the buoyant flow rate through the heater and the flow pattern produced by the plume at the outlet. This data supports CFD model development and code validation.
2.3.1
Description of the CEA separated effect tests
The heater was installed vertically in an experimental hall (Figure 3). The power supply system was set-up in order to impose constant power levels between 500 W to 6 kW with an accuracy of 1% maximum relative deviation. The device was equipped with 54 thermocouples located at the gas inlet (5), on the heating plates (14), in the gas between the plates (6), on the housing (15) and at the outlet (14). During the experiments, the results were recorded in a data acquisition system with a frequency of 1 Hz.
After the thermal characterization of the Heaters, optical measurements were performed to study the buoyancy effects at the Heater outlet, on one hand, and to assess the air mass flow rate at the Heater inlet on the other hand. This supports characterization of the flow resistance of the heater as well as the heat transfer to the gas. Particle Image Velocimetry technique (PIV) was used to perform measurements of instantaneous and mean velocity fields. A light sheet was provided by a double 200 mJ Nd:YAG pulsed laser and this plane was vertically or horizontally oriented depending on the location of the measurements (inlet or outlet of the device). Spanwise measurements were also performed. The images were taken using a 2048x2048 pixels Charge Coupled Device (CCD) camera and the velocity field was recorded at a frequency of 10 Hz. The error is expected to be less than 10 % of the measured value. Background Oriented Schlieren (BOS) was also set-up to visualise density gradients at the outlet. The surrounding atmosphere was seeded by insense or smoke. The first series of optical results has been obtained in 2012. A second series of PIV measurements has been performed
5/16
in 2015 with a much more detailed investigation around the inlet of the device (Figure 3 - right).
Figure 3: Heater in the SET experimental hall equipped for the BOS measurements at the outlet (left) – PIV laser sheet at the entrance of the heater (right)
2.3.2
Main test results
Several experiments were performed in order to check the reproducibility of the experimental data. The main results of these thermal characterisation tests are reported in Table 2. Due to thermal inertia of the plates, about 40 minutes were needed to stabilize the plate temperature at each power level. The housing temperature was higher close to the outlet at the top than at the inlet. Heat transfer by convection between the hot flowing gas and the cold housing is responsible for this temperature increase. However, the small temperature difference between the inner and the outer side does not allow a quantitative evaluation of the heat losses. At the outlet, the gas temperature experienced rather large temperature difference between the upper and the lower locations: 50°C at 3 kW and 100°C at 6 kW and only the arithmetic mean value of the 10 locations is given in Table 2. Finally, at the inlet, the measured deviations from the ambient temperature (19°C) are due to thermal radiation affecting the thermocouple.
Table 2: Main results of the thermal characterization tests
1000W 3000 W 6000 W
Mean Plate Temp. (°C) 132 295 484
Mean Gas outlet Temp. (°C) 58 115 192
Mean Inlet Temp. (°C) 25 28. 31.
Housing Temp. (°C) 26 to 44 50 to 80 100 to 140
Buoyant Mass Flow rate (g/s) 14.7 21.3 21.0
Background Camera PAR Background Camera PAR
6/16
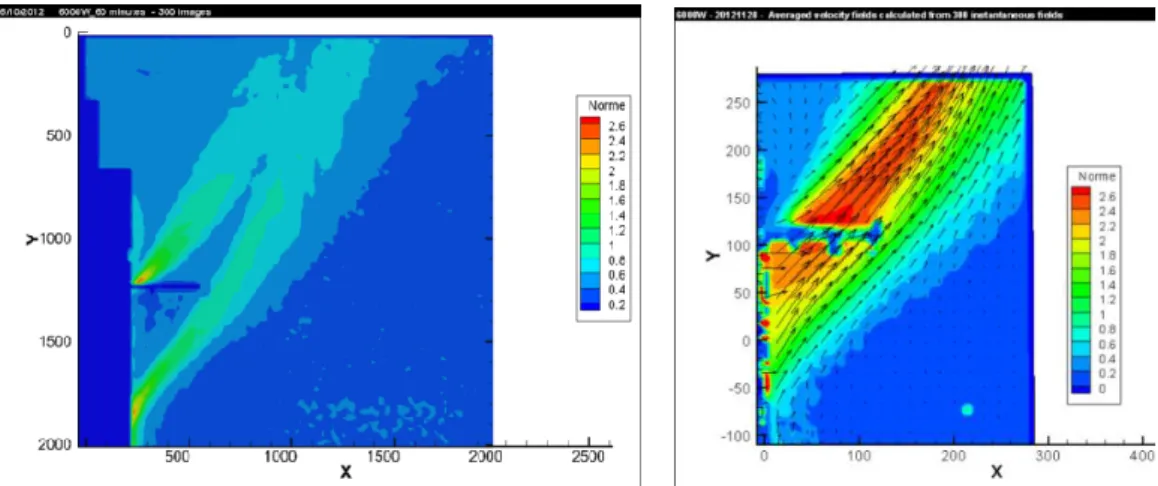
Figure 4: Examples of optical measurements performed at the outlet at 6000 W – BOS normalized temperature gradients (left) – PIV along the central plane (right).
Illustrations of optical measurements are reported on Figure 4. At the outlet, the flow is buoyant and the inclination of the rising plume is about 60° above the horizontal axis. Maximum outlet velocity was about 2.8 m/s and cold flow re-entry at the bottom of the outlet was also measured (Figure 4 – right). Regarding the 2012 test series, an approximate reconstruction of the 3D inlet velocity profile was calculated from six vertical 2D velocity fields. The calculated mass flow rate amounts to ~12g/s at 3000W and ~15g/s at 6000W. The new tests performed in 2015 resulted in higher values: 21.3 g/s and 21.0 g/s at 3000W and 6000W respectively. These measurements were obtained at about 5 mm below the inlet plane and were probably underestimated due to lateral fluxes between the laser sheet and the inlet. An underestimation of 5 % was assessed based on the evolution of lateral fluxes versus elevation. By knowing the flow rate through the heater device and combining Eq. 2 and 3 for steady-state, it can be concluded that only about 70 % of the delivered power is transferred to the gas, the remaining 30 % correspond to heat losses by convection and thermal radiation.
2.4 Model verification
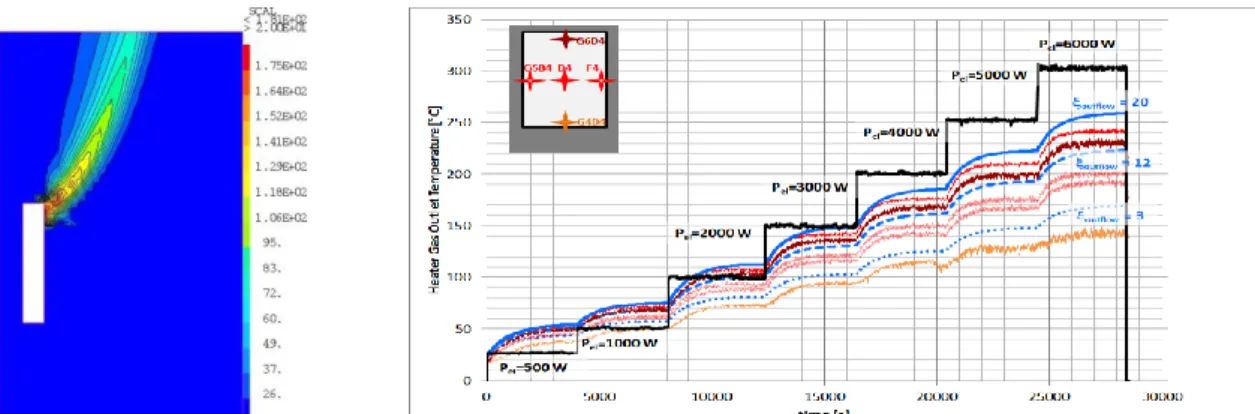
With the new model calibration based on the simultaneous knowledge of the mass flowrate through the heater and the thermal behavior of its different components i.e. plates, gas and housing at different power levels, CFD calculations with CAST3M code of these separated effect tests have been rerun and the steady state solution was much closer to the experimental results (Table 3) with a realistic outgoing plume (Figure 5 left).To obtain these results, pressure drops have been increased compared to previous validation work but none of the tests used for validation delivered simultaneously the temperatures and the flowrates for a real PAR.
Table 3: Computed results of the SET.
3000 W 6000 W
CAST3M RD-CFX Exp. CAST3M RD-CFX Exp.
Mass flowrate (g/s) 20.3 19.5 21.3 24.2 21.2 21.0
Plate Temp. (°C) 269 332 295 464 566 484
Gas outlet Temp. (°C) 112.9 118 115 181.2 194 192
Outlet mean velocity (m/s) 0.52 0.75 - 0.72 0.97 -
Parametric variations of the pressure loss coefficient performed with RD-CFX showed that
with a slight increase from zeta=3 (halved FR380, used at THAI [5]) to zeta=5 the massflow
and heat-up rate can be predicted quite consistent to the measurements. This slightly higher
pressure loss coefficient can be explained by the thicker plates and instrumentation wires.
7/16
Figure 5: CFD results of the SET: CAST3M temperature field at 6000 W (left) – RD-CFX predicted outlet temperature depending on flow resistance (right).
The Heater design is based on the real PAR model Siemens FR90/1-150 (full scale). Thus, we have estimated that 70% of 6kW delivered to the gas corresponds to a PAR operating at 1 bar and 20°C at the inlet with 3.5 vol% of hydrogen in the air/hydrogen mixture. The CAST3M 3D calculations have been performed with these boundary conditions and a real PAR model with and without increasing the pressure losses through the device. If the device is scaled with the power delivered to the gas, a real PAR leads to a higher mass flowrate through it (Table 4) and so, a lower outlet temperature and an higher outlet velocity leading to a less buoyant plume at the outlet (Figure 6). By increasing the pressure losses, the heater behavior is recovered with a slightly less buoyant flow at the outlet.
Table 4: CAST3M Computed results of the Heater and Real PAR at 6kW.
PAR PAR with
enhanced Pressure Losses
Heater
Mass flowrate (g/s) 30.7 23.8 24.2
Plate Temp. (°C) 528 528 464
Gas outlet Temp. (°C) 164 201 181
Outlet mean velocity (m/s) 0.90 0.74 0.72
Figure 6: CAST3M temperature field at 6000 W: Real PAR (left) – Real PAR with enhanced pressure losses (center) - Heater (right).
The heater power of 3 kW corresponds to a recombination rate of 0.025 g of hydrogen per second, similarly 0.05 g/s for 6 kW heat release. In [16] for the FR1-150 a reaction rate of 0.18 kg/h is specified (4 vol.% of H2, 1.5 bar). Considering the latter as full-load, the heater power levels
correspond to full-load and 50% load. Furthermore, [16] specifies a flow rate (at 1 bar and 60°C) of 50 m3/h, while the SET gives ~65 m3/h. Regarding the differences, heaters flow resistance is slightly higher than for a real PAR. The thermal inertia of the heater is significantly higher (thicker plates) and the temperature magnitude and profile on the heater plates differs from a real PAR (maximum at the bottom vs/ maximum in the middle). Future detailed experiments with continious mass flowrate and temperature measurements with a real PAR will be welcome for further validation purposes.
8/16
3. LARGE SCALE EXPERIMENTAL RESULTS
In the frame of the MITHYGENE project, the CEA was responsible for the heat source tests in the MISTRA facility. These tests aimed to study the capability of the convective flow induced by the heat source to eliminate a light gas pocket which could form in the lower region of the containment. Therefore, dedicated experiments were planned to measure the time scale connected to this intermediate transfer between convection and molar diffusion. For safety reasons, helium is used instead of hydrogen in the MISTRA facility. Hence the heater activation does not induce chemical effects (hydrogen consumption of oxygen and steam production), only the thermal effects were considered.
3.1 Description of MISTRA facility
The MISTRA facility is a stainless steel containment thermally insulated with a free volume of 97.6 m3 operated by CEA since 1999 (Figure 7 - left). The MISTRA facility comprises 2 cells, a flat cap and a bottom that are fixed together with twin flanges. Three cylindrical thermally regulated walls, inserted inside the containment along the stainless steel containment wall on top of each other, are called condensers. A detailed description of the equipment and experimental arrangement may be found in [8]. For the tests addressed in the present paper, air and helium mixture was injected vertically upward with a low momentum through the central injection device (72 mm diameter) located at the bottom of the inner cylinder (Figure 7 - left) and the two heaters were installed in the upper part of the inner cylinder (Figure 7 – left and right). The elevation of the inlet of the heaters was 4715 mm just above level 11. The facility was closed during the tests in order to record pressure transients for the mass and energy balances.
The MISTRA facility is equipped with numerous measurement points including more than 200 thermocouples, 70 sampling lines, etc. , distributed in the gas volume and along the inner and the outer structures. For these test series, mini-katharometers (Figure 7 - center) were also installed along 3 vertical lines in the upper part of the facility to measure the helium content in the mixture. These sensors were thermal conductivity gauges (TCG-3880Pt) made using silicon technology [17]. The measurement principle relies on the decrease in effective thermal resistance between the sensitive area of the sensor and the ambient, caused by the thermal conductivity of the surrounding gas. This method is attractive for helium/air mixture, due to the fact that the thermal conductivity of helium and air are very different and thus concentration changes are readily detected. They were carefully calibrated with air-helium mixture from 1% to 50% helium molar fraction in air and typical response time was about 5 seconds.
Different test series were performed. First, the MM0 test series was the reference test dedicated to the stratified atmosphere set-up in the bottom part of the inner cylinder and the natural evolution of the stratified atmosphere in the MISTRA facility without heater activation. To create this stratified atmosphere, the upper condenser was first heated up to 140°C. Thus a hot air layer appeared on the top of the MISTRA facility. In a second phase, cold air and helium mixture was slowly injected at the bottom of the inner cylinder. Due to density differences, most of the helium stayed in the inner cylinder and only a small amount was swept out by the upper convection loop. This extraction process was recorded during seven hours after the end of helium injection.
Then, in the MM1 test series, the two heaters called heater #1 (ref T5GN-01) and #2 (ref T5GN-02) installed inside the MISTRA facility were activated during the injection phase and the associated effects on the gas mixing process were recorded. The power delivered to the heaters started with a rising ramp from 1 to 6 kW during 3000 seconds in order to limit the effect of the thermal inertia of the stainless-steel plates. After that a plateau at 6 kW was maintained for the same period of time and at the end, the decreasing ramp started at the end of the injection. Finally, in the MM2 test series only one heater (heater #1) was activated.
9/16
Figure 7: MISTRA facility – Overview of the geometry (left) – Mini-katharometer design (center) – 2 heaters fixed on the flat cap of MISTRA facility (right).
3.2 Test sequence and main experimental results
The gaseous flow patterns in these experiments are quite simple: first of all, addition of heat by the upper condenser created a convection loop flowing upwards along the condensers and downwards in the center of the facility. Then, the central injection of the cold mixture of 10 vol% of helium in air is performed with reduced inertia not to perturb the upper convection loop. Finally, the operation of the heaters created an ascending natural convection flow near the center of the facility which was able to perturb the upper convection loop and to extract more helium of the inner cylinder by sucking gas below its inlet. In the absence of heater action, the upper convection loop was also going to extract some helium from the inner cylinder by continuous erosion.
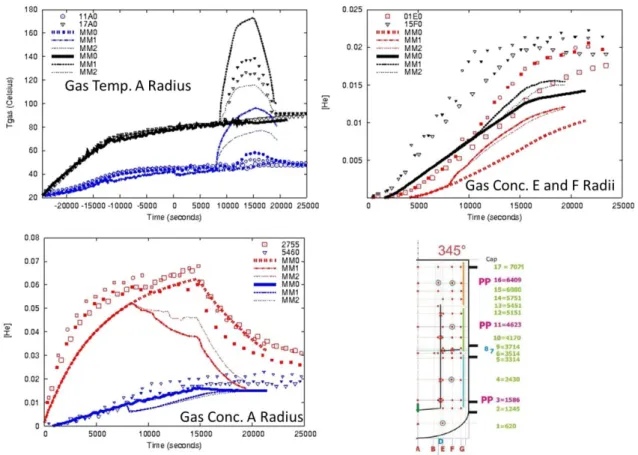
The main results of these three test series is reported in Figure 8. First-of-all, the heaters operation can be clearly seen from the gas temperature measurements along A radius (vertical central axis of the facility - Figure 8 – top left). With two heaters in operation, the increase of temperature can reach localy values of 60°C. This effect is also recorded at level 11 close to the heater inlet due to the convection loop and at level 3 well below the heaters. Adiabatic compression level due to pressure increase during heater operation has the same order of magnitude of this latter temperature increase (3 % in Kelvin). Gas injection leads to a helium concentration of about 6.5 vol.% in the inner cylinder homogeneously distributed up to the level 10 (4170 mm) where a sharp decrease is observed. Two heaters in operation reduce this maximum and lead to a faster decrease (Figure 8 – bottom left). If only one heater is activated, the effect is less pronounced. Outside the inner cylinder, a change of slope can be observed during heater rising power ramp (Figure 8 – top right) for the various measurements locations with a different time sequence. A decrease is also recorded for the MM1 case at level 15F0 (6080 mm) and at time about 11000-12000 seconds. Complex coupled phenomena probably occur for this test and detailed CFD computations are expected probably help to understand such behavior.
9mm
10/16
Figure 8: Some experimental results of MM0 (big open symbols), MM1 (small filled symbols) and MM2 (small open symbols) – Time zero corresponds to the beginning of helium/air injection
4. MODELS VERIFICATION AGAINST FULL-SCALE EXPERIMENTS
4.1 Pre-test calculations
The precalculations were realized for the following reasons:
Confirm the creation of a helium rich gaseous zone at the bottom of the inner cylinder, measure the helium extraction by the upper convection loop,
define the moment of starting up of the heaters during the transient of gas mixing in order to optimize their effect,
predict the effect of heaters on the helium dispersion.
It is interesting to compare the results of these precalculations with the experimental measurements. First of all, in the CAST3M precalculations, the temperature of the injection was supposed to be 33°C while experimentally only the value of 23°C was measured. This hypothesis influences the thermal behavior of the gas on the central axis with a decrease of the measured temperature at elevation below level 11 (Figure 9 – top left). The rise in pressure is also affected because of the overestimation of the injected enthalpy. Then, the injection of the 10 vol.% of helium mixture allows the constitution of a gaseous pocket helium rich at the bottom of the central cylinder. A maximal concentration of 6 vol.% was predicted by the model and agrees well with the later measured concentration (Figure 9 – bottom left). However, extraction of helium by the upper convection loop during MM0 test series was underestimated by the model probably due to a larger convection loop in the model compared to the experiments (Figure 9 – top right). Heaters operation lead to overestimated temperature level at 17A0 position coming from a less buoyant flow at the outlet of the heaters in the CAST3M code (Figure 10 – left) despite a correct evaluation of the thermal behavior of the heater itself. These computations were performed before the model improvement based on the SET. Finally, the effect of the heaters operation on the helium dispersion was as important in the computations as in the experiments (Figure 9 – top right and bottom left). The computed flow rate through the heaters was overestimated (more
11/16
than 30 g/s at 6 kW) and, their influence was probably stronger. Post-tests computations were consequently started for these interesting issues and are on-going.
Figure 9: Some experimental results of MM0 (big open symbols), MM1 (small filled symbols) and MM2 (small open symbols) compared to pre-test computation with TONUS code
Figure 10: Some details of the pre-tests computations: Left- temperature field at the end of helium/air injection for MM2 test (TONUS), Center – TONUS CFD mesh, Right – RD-CFX
temperature filed for MM1 test (short term and long term)
Pre-test calculations performed with RD-CFX have shown that during the reference case MM0 the mixing process is governed by a slow convective mixing of the confined helium layer driven by heat transfer along the upper condenser and colder structures (cap / walls/ inner compartment). When heaters are in operation (MM1 case), different flow patterns occurred: during the early phase when Tgas,out is lower than Tupper,cond a counter current flow between heater and upper condenser) is observed
(Figure 10) and later when Tgas,out becomes greater than Tupper,cond a reverse circulation is computed.
Despite these modifications only diffusive mixing of the confined helium pocket is predicted. For this MM1 case only 70% of the heater energy is transferred to the fluid and the rest corresponds to thermal inertia of the plates and radiation from housing to walls. These computaions also suggested that the heat losses seem to be important for the reference case and closing the MISTRA vessel for the tests
12/16
will lead to pressurization and provide further information on power to gas heat transfer.
4.2 Post test calculations
This paper focuses on the post-test calculations of MM1 test series with two heaters in operation. For the post test analysis with RD-CFX, a 90° symmetry of the test setup was applied in order to reduce the computational effort for the long transient. The mesh applied is rather fine (~250.000 nodes) and was built according to the well-known best practice guidelines [18], [19] and [20]. Grid independency was proven. An unsteady RANS approach, closed by the SST turbulence model and ideal gas equation of state was used.Thermal radiation is modeled by a Monte Carlo model, assuming that air and helium are fully transparent and the walls have an emissivity of 60%. This fundamental modeling approach has been comprehensively validated for different momentum or buoyancy driven flow and mixing processes (e.g. [21] or [15]). For CAST3M simulations, the model used for pre-test calculations has been reconducted for the post-test analysis. Initial and boundary conditions were derived from experimental data and prescribed as vertical profiles.
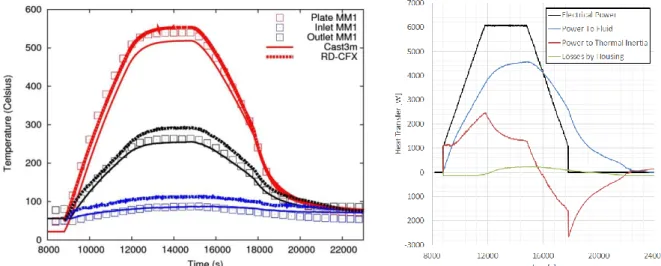
Considering that the heater operation is driving the mixing process, validation has to prove a consistent representation of the heat transfer and buoyant mass flow rate before comparing the layer behavior. Figure 11 compares the thermal behavior of the heater to the measurements. The averaged plate temperatures (Figure 11 left) show a more homogeneous profile and a slightly higher average temperature level than in the experiment. Nevertheless, a very good representation of the gas heat-up can be concluded for both models. The heater heat balance (Figure 11 right) confirms that, consistent to the experiment, only 2/3 of the electrical heat is transferred directly to the gas, while the remaining part is used to heat up the structures or lost at the outer side of the housing to the ambient gas. Once the heater is shut down (t~18000 s), heat transfer to the fluid continues due to a cool down of the hot structures. The gas heat up induces a buoyant flow through the heater. The flow rate, in- and outlet velocity are given in Figure 12 without experimental reference. Nevertheless, a comparison with the chacterization data (Table 3) shows that the results are reliable but under the investigated conditions (inlet temperature > room temperature) a lower mass flow rate is predicted due to higher pressure losses. Summarizing, a consistent representation of the heater in the model is concluded.
13/16
Figure 12: Heater mass flow rate and resulting inlet and outlet velocity
Due to the fact that the vessel is closed and no condensation occurs, the pressure evolution (see Figure 13) can be used as an integral measure of the gas energy balance. It is obvious that the pressure increase is over predicted by a constant rate, while the cool down-phase is predicted rather well, i.e. with the same slope. Consequently, heat losses from the facility are not considered as reason for the deviation, which needs further clarification. During the data processing a leakage in the MISTRA facility has been identified after the first MM0 test. Even though it allows correct the pressure measurement for the MM1 tests, both models still overpredict the pressure transient.
The gas temperatures (compared in Figure 14) show that the expected thermal stratification above the heater is predicted quite well, however, the gas temperature in the vicinity of the heater is over predicted for both models (compare also Figure 12 left) due to transport of hot gas back into the compartment. This larger extension of the hot gas cloud may explain the higher pressure level.
14/16
Figure 14: MM1-1 Comparison of gas temperature histories
In order to illustrate the stability and mixing of the layer, several concentration measurements inside and outside the compartment are considered (Figure 15). For RD-CFX results, while outside the compartment, the concentration histories are consistent, one can observe an over prediction of the helium concentration inside the compartment during the injection (till t=14800s). However, even if this reduces its density difference to the ambient, the layer is predicted to be stable in contrast to the experiment, where is dissolved towards the end of the transient. Regarding CAST3M results, the improvement of the heater model and the change of the injection temperature has not improved the model between pre and post test analysis (Figure 9 bottom left and Figure 15). These large deviations need further explanations.
Figure 15: MM1-1 Comparison of helium concentration histories at different locations inside and outside the inner compartment (helium layer)
5. CONCLUSIONS
Passive auto-catalytic recombiners (PARs) are used in present reactors to mitigate hydrogen risk issues and will continue to be implemented in future Pressurized Water Reactors (PWRs). During operation, the PARs produce heat, which induces natural convection inside the containment. MISTRA large scale tests have been conducted to study the capability of the convective flow induced by the heat source to
15/16
eliminate a helium pocket simulating hydrogen which could form in the lower region of the facility and below the PAR. These tests have provided data on natural circulation flow and on the overall distribution of helium in the different regions. These tests show two different characteristic time scales: a fast mixing phenomenon for the gas mixture surrounding the heat source and the much slower mixing phenomenon for the mixture situated below the source. In parallel, calculations were conducted by JÜLICH and CEA with their respective CFD tools, RD-CFX and TONUS. After calibrating the heater models with separated effect tests conducted at CEA the models resulted in a good prediction of the gas heat-up and buoyant mass flow for the MISTRA tests. However, there are considerable deviations observed with regard to the gas flow and mixing processes, which need further clarification. Nevertheless, both experiment and model show that a cold bottom layer can hardly be remobilized by a PAR located above.
Finally, the experimental and the computed results recall the limited effect of the heaters on the destratification and the importance for designers to install the PARs also in the lower part of the containment.
ACKNOWLEDGMENTS
The authors would like to acknowledge the French Research Agency (ANR) for the funding of this project.
REFERENCES
[1] SARP, «SARNET Description of Work,» 2009. [En ligne]. Available: http://www.irsn.fr/FR/Larecherche/Organisation/Collaborations/SARNET/Documents/SARNET-DoW-final-march09.pdf.
[2] A. Bentaib, E. Studer, N. Chaumeix, S. Magne, E. Reinecke et D. Pinet, «MITHYGENE project: Towards the improvement of hydrogen risk assessment models and safety management procedures,» chez International Workshop on Nuclear Safety and Severe Accidents
(NUSSA-2014), Chiba, Japan, September 3-5, 2014.
[3] F. Dabbene et H. Paillère, «SARNET PARIS Benchmark results,» SARNET-CONT-P04, 2007. [4] D. Paladino, G. Mignot, R. Kapulla, R. Zboray, M. Andreani, I. Tkaschenko, E. Studer et J.
Binster, «OECD/SETH-2 Project: PANDA and MISTRA Experiments adressing key safety issues for water reactor containment,» chez 15th International Topical Meeting on Nuclear Reactor
Thermalhydraulics (NURETH-15), Pisa, Italy, 2013.
[5] S. Kelm, W. Jahn, E.-A. Reinecke et A. Schulze, «Passive autocatalytic recombiner operation - Validation of a CFD approach against OECD/THAI HR2 tests,» XCFD4NRS conference, Korea, 2012.
[6] S. Kudriakov, F. Dabbene, E. Studer, A. Beccantini, J.-p. Magnaud, H. Paillère, A. Bentaib, A. Bleyer, J. Malet, E. Procheron et C. Caroli, «The TONUS CFD code for hydrogen risk analysis: physical models, numerical schemes and validation matrix,» Nuclear Engineering and Design, vol. 238, pp. 551-565, 2008.
[7] F. Dabbene, «Heater modelling with a lumped model (ERCOSAM project),» Rapport STMF/LATF/13-010/A, 2013.
[8] F. Dabbene, J. Brinster, D. Abdo, E. Forcheron, P. Lemaitre, G. Mignot, R. Kapulla, S. Paranjape, M. Kammev et A. Khizbullin, «Experimental activities on stratification and mixing of a gas mixture under the conditions of a severe accident with intervention of mitigating measures performed in the ERCOSAM-SAMARA project,» chez International Congress on Advances in
Nuclear Power Plants (ICAPP 2015), Nice, France, May 3-6, 2015.
[9] F. Dabbene, «PAR elevation influence on hydrogen floor layer depth,» chez 14th International
Topical Meeting on Nuclear Reactor Thermalhydraulics (NURETH-14), Toronto, 2011.
[10] J. Boehm, «Modelling of processes in catalytic recombiners,» Forschungzentrum Jülich, Energy Technologies 61, 2007.
16/16
[11] I. ANSYS, ANSYS CFX-Solver Theory Guide and Solver Modeling Guide, Release 15, Canonsburg, 2013.
[12] E. A. Reinecke, S. Kelm, P.-M. Steffen, M. Klauck et H.-J. Allelein, «Validation and application of the REKO-DIREKT code for the simulation of passive auto-catalytic recombiners (PARs) operational behavior,» chez Proc. 16th International Topical Meeting on Nuclear Reactor
Thermal Hydraulics NURETH-16, Chicago, Illinois, USA, August 30-September 4, 2015, Paper No. 13895, 2015.
[13] S. Kelm, E.-A. Reinecke, W. Jahn et H. Allelein, «Simulation of hydrogen mixing and mitigation by means of catalytic recombiners,» chez 14th International Topical Meeting on Nuclear Reactor
Thermalhydraulics (NURETH-14), Toronto, Ontario, Canada, 2011.
[14] R. Kapulla, S. Kelm, G. Mignot, S. Paranjape et D. Paladino, «Experimental and numerical results for the erosion dynamics of a vertical helium-air jet interacting with a helium rich layer,» chez International Congress on Advances in Nuclear Power Plants (ICAPP 2015), Nice, France, May 3-6, 2015.
[15] S. Kelm, M. Ritterath, H.-M. Prasser et H.-J. Allelein, «Applications of the MiniPANDA test case erosion of a stratified layer by a vertical jet for CFD validation,» Nuclear Engineering and
Design, vol. 299, pp. 124-135, 2016.
[16] AREVA, «Passive Auto-catalytic Recombiners, Tec-Sheet,» 2011. [En ligne]. Available:
http://us.areva.com/home/liblocal/docs/Solutions/literature/G-008_V1PB-2011-ENG_PAR_reader.pdf.
[17] X. Integration, «Thermal Conductivity Gauge XEN-TCG3880 for gas type measurement and vacuum measurement,» Xensor Integration Company, Smart Sensor, 2015.
[18] F. Menter, «CFD best practise guidelines for CFD Code validation for Reactor Safety Applications,» chez EU-ECORA Project EC Contract N° FIKS-CT-2001-00154, 2001.
[19] M. Casey et T. Wintergerste, «ERCOFTAC special interest group on quality and trust in industrial CFD - Best practise guidelines,» ERCOFTAC, 2000.
[20] J. Mahaffy, «Best practise guidelines for the use of CFD in nuclear reactor safety applications,» NEA/CSNI/R(2007)5, 2007.
[21] S. Kelm, J. Lehmkuhl, W. Jahn et H.-J. Allelein, «A comparartive assessment of different experiments on buoyancy driven mixing processes by means of CFD,» Annals of Nuclear
Energy , vol. 93, pp. 50-57, 2016.
[22] S. Kelm, J. Lemkuhl, W. Jahn et H.-J. Allelein, «A comparative assessment of different experiments on buoyancy driven mixing processes by means of CFD,» chez European Review
Meeting on Severe Accident Research (ERMSAR), Marseille, France, March 24-26, 2015.