HAL Id: hal-00001219
https://hal.archives-ouvertes.fr/hal-00001219v2
Preprint submitted on 16 Mar 2004
HAL is a multi-disciplinary open access
archive for the deposit and dissemination of
sci-entific research documents, whether they are
pub-lished or not. The documents may come from
teaching and research institutions in France or
abroad, or from public or private research centers.
L’archive ouverte pluridisciplinaire HAL, est
destinée au dépôt et à la diffusion de documents
scientifiques de niveau recherche, publiés ou non,
émanant des établissements d’enseignement et de
recherche français ou étrangers, des laboratoires
publics ou privés.
Superconducting phase diagram of the filled
skuterrudite PrOs4Sb12
M.-A. Measson, D. Braithwaite, J. Flouquet, G. Seyfarth, J.P. Brison, Elsa
Lhotel, C. Paulsen, H. Sugawara, H. Sato
To cite this version:
M.-A. Measson, D. Braithwaite, J. Flouquet, G. Seyfarth, J.P. Brison, et al.. Superconducting phase
diagram of the filled skuterrudite PrOs4Sb12. 2004. �hal-00001219v2�
ccsd-00001219 (version 2) : 16 Mar 2004
M.-A. Measson1, D. Braithwaite1, J. Flouquet1, G. Seyfarth2, J.P. Brison2, E. Lhotel2, C. Paulsen2, H. Sugawara3, and H. Sato3
1
D´epartement de Recherche Fondamentale sur la Mati`ere Condens´ee, SPSMS, CEA Grenoble, 38054 Grenoble, France
2
Centre de Recherches sur les Tr`es basses temp´eratures, CNRS, 25 avenue des Martyrs, BP166, 38042 Grenoble CEDEX 9, France
3
Department of Physics, Tokyo Metropolitan University, Minami-Ohsawa 1-1, Hashioji, Tokyo 192-0397, Japan
We present new measurements of the specific heat of the heavy fermion superconductor PrOs4Sb12,
on a sample which exhibits two sharp distinct anomalies at Tc1 = 1.89K and Tc2 = 1.72K. They
are used to draw a precise magnetic field-temperature superconducting phase diagram of PrOs4Sb12
down to 350 mK. We discuss the superconducting phase diagram of PrOs4Sb12 and its possible
relation with an unconventional superconducting order parameter. We give a detailed analysis of Hc2(T ), which shows paramagnetic limitation (a support for even parity pairing) and multiband
effects.
PACS numbers: 65.40.Ba,71.27.+a,74.25.Dw,74.25.Op,74.70.Tx
I. INTRODUCTION
The first Pr-based heavy fermion (HF) superconductor PrOs4Sb12 (Tc ∼1.85K) has been recently discovered1. Evidence for its heavy fermion behavior is provided mainly by its superconducting properties, like the height of the specific heat jump at the superconducting tran-sition or the high value of Hc2(T ) relative to Tc1. PrOs4Sb12is cubic with Thpoint group symmetry2, and has a nonmagnetic ground state, which in a single ion scheme can be either a Γ23doublet or a Γ1singlet, a ques-tion which remains a matter of controversy. Presently, most measurements in high field seem to favor a singlet ground state3,4,5,6. In any case, whatever the degeneracy of this ground state, the first excited state (at around 6K) is low enough to allow for an induced electric quadrupo-lar moment on the Pr3+ ions7,8, that could explain the heavy fermion properties of this system by a quadrupo-lar Kondo effect1. Thus, while the pairing mechanism of usual HF superconducting compounds (U or Ce-based) could come from magnetic fluctuations, the supercon-ducting state of PrOs4Sb12 could be due to quadrupolar fluctuations. Yet at present, this attractive hypothesis is backed by very few experimental facts, both as re-gards the evidence of a quadrupolar Kondo effect in the normal phase and as regards the pairing mechanism in the superconducting state. Even the question of the un-conventional nature of its superconductivity is still open. Indeed, several types of experiments have already probed the nature of this superconducting state, but with appar-ently contradictory results. Concerning the gap topology, scanning tunneling spectroscopy measurements point to a fully open gap, with some anisotropy on the Fermi surface9. Indication of unconventional superconductivity might come from the distribution of values of the resid-ual density of states (at zero energy) on different parts of the sample surface. This could be attributed to a pair-breaking effect of disorder. The same conclusion as
re-gards the gap size was reached by µSR measurements10 and N QR measurements11, although unconventional su-perconductivity is suggested in the latter case by the ab-sence of a coherence peak below Tc in 1/T1.
This should be contrasted with recent penetration depth measurements, that would indicate point nodes of the gap12, or the angular dependence of the thermal con-ductivity which suggests an anisotropic superconducting gap with a nodal structure13. This latter measurement also suggests multiple phases in the temperature (T ) -field (H) plane, which could be connected to the dou-ble transitions observed in zero field14,15,16. Recent µSR relaxation experiments17 detected a broadening of the internal field distribution below Tc, suggesting a multi-component order parameter or a non unitary odd parity state, with a finite magnetic moment.
In this context, our results bring new insight on the question of the parity of the order parameter, and draw a definite picture of the (H,T) phase diagram as deduced from specific heat measurements. With reference to the historical case of UPt3, we emphasize that the present status of sample quality may explain the discrepancies between the various measurements : definite claims on the nature of the superconducting state in PrOs4Sb12 are at the very best too early, the key point being the sample quality.
II. EXPERIMENTAL DETAILS
We present results on single crystals of PrOs4Sb12 grown by the Sb flux method18,19. These samples are aggregates of small single crystals with well developed cubic faces. They have a good RRR of about 40 (between room temperature and 2K), a superconducting transition (onset of Cp or ρ) at 1.887 K and, they present a very sharp double superconducting transition in the specific heat.
2 1.5 1.6 1.7 1.8 1.9 C p /T ( a .u .) T (K) sample n°1 T c2 T c1
0
0.5
1
1.5
2
2.5
3
3.5
4
0
1 2
3
4 5
6
T (K)
C
p
/T
(J
/K
2
.m
o
l)
3 samples of the same batch
including
sample n°1
FIG. 1: Specific heat of samples of the same batch including sample n◦1 as Cp
T versus T at zero field measured with a quasi-adiabatic method. The inset is a zoom on the double superconducting transition of sample n◦1 measured with an
ac method: Tc1= 1.887 K and Tc2= 1.716 K.
Two different techniques have been used for the specific heat measurements. The first is a quasi-adiabatic method with a Au/Fe-Au thermocouple controlled by a supercon-ducting quantum interference device (SQUID) in a3He calorimeter. It is well suited to quantitative studies in zero field (the addenda are precisely known), and was used on samples with a total mass of 8 mg. The second technique was ac calorimetry, used to follow the super-conducting transitions under magnetic field in order to draw a complete phase diagram of the two superconduct-ing transitions. This ac calorimetry uses a strain gauge heater (PtW alloy), a sensitive SiP thermometer (silicon doped with phosphorus close to the critical concentra-tion of the metal-insulator transiconcentra-tion), and a long gold wire (25µm diameter) as a heat leak. For the ac method, we choose a frequency of 0.04 Hz and a large integration time of 350 s. The SiP thermometer is measured with a four lead resistance bridge at 500 Hz, whose analog out-put is sent to the lock-in detection. The heating power was chosen so that the SiP temperature oscillations re-main smaller than 6 mK in order to avoid broadening of the transitions. Thermometry under field was controlled by thermometers located in the (zero field) compensated region of the magnet.
III. SPECIFIC HEAT RESULTS
Figure 1 displays the specific heat Cp(0, T )/T of 3 sam-ples of the same batch measured together, of total mass 8 mg. The inset of fig. 1 is the ac specific heat Cp(0, T )
0
5 10
-71 10
-60.9
1.2
1.5
1.8
0T
70mT
250mT
400mT
700mT
900mT
1.4T
C
p
/T
(J
/K
2
)
T(K)
T
c2
T
c1
sample n°1
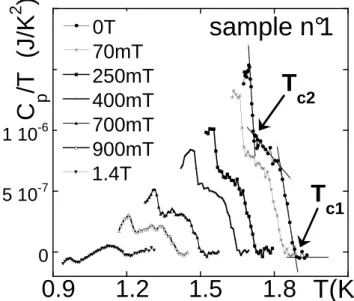
FIG. 2: Temperature sweeps of the ac specific heat of sample n◦1 at several fields below 1.4 T. The normal state was
sub-tracted. The arrows indicate the double transition Tc1 and
Tc2.
of one of these three samples (thereafter called sample n◦1). As it has been previously observed1, PrOs
4Sb12 shows a Schottky anomaly with a maximum in Cp/T near T = 2.2K. Absolute values of Cp/T are the high-est ever reported: at T = 1.7K, Cp/T = 3.65J/ K2.mol and at T = 2K, Cp/T =2.9 J/mol.K2. Sample n◦1 has a well defined double transition: to our knowledge, it is the sharpest ever reported in the literature, although we are aware of similar (yet unpublished) results by Y. Aoki20 on samples grown in the same group. The width of the two transitions was estimated to be 16mK and 58mK, with respectively Tc2= 1.716K and Tc1= 1.887K ( with the junction criterion).
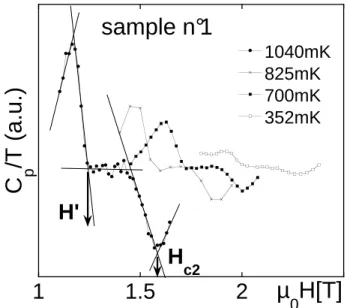
Shown in fig. 2 and fig. 3 are the ac specific heat measurements Cp(H, T ) at, respectively, constant mag-netic field (Tc1 ≥ 1.16 K) and constant temperature (Tc1 ≤ 1.15 K) of the same sample n◦1. The normal state specific heat, or an arbitrary line between the two transitions, has been subtracted for the temperature or field sweeps respectively. Even under field, the transi-tions remain very sharp, so that we were able to detect them down to 350 mK and to draw a precise phase dia-gram (Fig. 4). The width of the two transitions does not exceed ∆Hc2= 80 mT and ∆H
′
= 50 mT at 500 mK. The phase diagram has the same features as reported by Tayama et al.5 from magnetization measurements. The advantage of specific heat is to give an unambigu-ous signature of a bulk phase transition, that cannot be confused with other physical phenomena like peak-effect. The two transition lines remain almost parallel and we will see that they can be deduced from each other simply by scaling Tc.
1
1.5
2
1040mK
825mK
700mK
352mK
C
p/T
(
a
.u
.)
µ
0H[T]
H
c2H'
sample n°1
FIG. 3: Field sweeps of the ac specific heat of sample n◦1 at
several temperatures. An arbitrary line between the two tran-sitions was subtracted. We follow the two trantran-sitions (Hc2
and H′) down to 350 mK.
0
0.5
1
1.5
0
0.5
1
1.5
H'
H
c2
µ
0
H
(
T
)
T (K)
sample n°1
FIG. 4: H − T superconducting phase diagram of PrOs4Sb12
determined by specific heat measurements on sample n◦1.
The field dependence of Tc1and Tc2 are completely similar.
The lines are fits by a two-band model of the upper critical field (Section V B 2). Only Tchas been changed from Hc2to
H′.
IV. SAMPLE CHARACTERIZATION Three pieces of sample n◦1 have been used for further characterizations, called 1a, 1b and 1c. As well as the specific heat of sample n◦1a (2 mg), we have measured the resistivity of samples n◦1b (0.2 mg) and n◦1c, and the ac susceptibility and dc magnetization of samples n◦1a and n◦1b.
Concerning the specific heat, the high absolute value of Cp as well as the large height of the two supercon-ducting jumps (∆(Cp/T ) = 350 mJ/mol.K2 at Tc1 and ∆(Cp/T )=300 mJ/mol.K2at Tc2) must be linked to the high quality of these samples (absence of Sb-flux and/or good stoichiometry). Moreover, the heights of the two steps of sample n◦1a are quantitatively similar to those of the entire batch (7.5 mg) as Vollmer has already pointed out14.
Like in previous work1,21, we have noticed that the resistivity at 300K is very sample dependent ( from 200 to 900 µΩ.cm). On all samples, the value of ρ at 300 K seems to scale with the slope at high temperature (T ≥ 200K), i.e. the phononic part of the resistivity, as if the discrepancies were due to an error on the geometric factor. This error could be explained by the presence of microcracks in the samples. We have taken this problem into account by normalizing all data to the slope dρ/dT at high temperature (T ≥ 200K) of sample n◦1c, chosen arbitrarily. For samples n◦1b and n◦1c respectively (Fig. 5), the RRR (ratio between 300K and 2K values) are 44 and 38, the onset Tc are 1.899 K and 1.893 K (match-ing the critical temperature obtained by specific heat), and the temperatures of vanishing resistance (TR=0) are 1.815 K and 1.727 K. TR=0 of sample n◦1c is equal to Tc2 and this remains true under magnetic field. So, in sample n◦1c, the resistive superconducting transition is not complete between Tc1 and Tc2.
Figure 6 shows the superconducting transition for sam-ples n◦1a and n◦1b by ac-susceptibility (Hac= 0.287Oe), corrected for the demagnetization field. The onset tem-perature is the same for the two samples (1.88K). The transition is complete only at around 1.7K and two tran-sitions are visible. The field cooled dc magnetization of samples n◦1a and n◦1b (Hdc= 1Oe), shown in fig.7, gives a Meissner effect of, respectively, 44% and 55%, indicat-ing (like specific heat) that the superconductivity is bulk. The two transitions are also visible.
V. DISCUSSION
A. Double superconducting transition Let us first discuss the nature (intrinsic or not) of the double transition observed in our specific heat mea-surements. The remarkable fact, compared to previous reports14,15, is the progress on the sharpness of both tran-sitions. If for previous reports, a simple distribution of Tc due to a distribution of strain in the sample could
4 0 5 10 15 20 1.7 1.75 1.8 1.85T(K) T R=0 of sample n°1c
0
200
400
1000
0
50 100 150
300
sample n°1b
sample n°1c
T(K)
ρ(
µΩ
.
c
m
)
FIG. 5: Resistivity of samples n◦1b and n◦1c normalized to
the slope at high temperature of sample n◦1c. The inset is
a zoom on the superconducting transition. The resistivity of sample n◦1c is zero only at T
c2.
-0.08
-0.07
-0.06
-0.05
-0.04
-0.03
-0.02
-0.01
0
1.5
1.6
1.7
1.8
sample n°1a
sample n°1b
χ
i'
A C(
e
m
u
/c
m
3)
T(K)
FIG. 6: Real part χ′of the AC susceptibility of samples n◦1aand n◦1b measured with an AC magnetic field of 0.287Oe
at 2.11Hz. Like in the results of resistivity measurement, the superconducting transition is not complete at Tc1and the two
transitions are visible.
have explained the transition width, it is not the case anymore for the sharp features observed on these new samples. Also the explanation recently proposed22 that the lower transition at Tc2 would be induced by Joseph-son coupling of one sheet of the Fermi surface to another with transition temperature Tc1is excluded, owing to the
-0.08
-0.07
-0.06
-0.05
-0.04
0
1
1.2
1.4
1.6
1.8
FC
ZFC
M
em
u/
cm
3T (K)
sample n°1a
FIG. 7: DC magnetization of sample n◦1a at H
DC = 1Oe
with zero field cooled (ZFC) and field cooled (FC) sweeps. The Meissner effect is 44% for this sample and 55% for sample n◦1b (not shown). The superconductivity is bulk.
sharpness of both transitions and particularly of that at Tc2: see the broadening calculated by the authors22 for the Josephson induced transition. Nevertheless, some of our results still cast serious doubts on the intrinsic na-ture of the double transition. Indeed, the susceptibility also shows a ”double” transition, and resistivity becomes zero only at Tc2. If the first transition at Tc1 was bulk-homogeneous, the resistivity should immediately sink to zero below Tc1, and the susceptibility (χ) should also show perfect diamagnetism far before Tc2 : the sample diameter is at least 1000 times larger than the penetra-tion depth (λ) so that the temperature dependence of λ cannot explain such a transition width of χ (contrary to the statements of E.E.M. Chia12). So both resistiv-ity and susceptibilresistiv-ity are indicative of remaining sample inhomogeneities.
Nevertheless, in our opinion, even the comparison of the various characterizations of the superconducting transition by resistivity, susceptibility and specific heat on the same sample does not allow for a definite conclu-sion.
Two historical cases are worth remembering. URu2Si2 showed a double transition in the specific heat in some samples, with inhomogeneous features detected in the susceptibility23. In that case, the authors of reference23 could clearly show that it was not intrinsic (maybe aris-ing from internal strain ?) because different macroscopic parts of the same sample showed one or the other tran-sition. In PrOs4Sb12, the specific heat results are repro-ducible among various samples of the same batch (see samples n◦1 and n◦1a of the present work), and such an easy test does not work.
The second case is of course UPt3: it is now well estab-lished that the two transitions observed in zero field are intrinsic and correspond to order parameters of different symmetries. But the first results on samples that were not homogeneous enough showed exactly the same be-haviour as the present one in PrOs4Sb12: two features in the susceptibility and a very broad (covering both tran-sitions) resistive transition24. It was not until the sample quality improved significantly that resistivity and suscep-tibility transitions matched the higher one25. The puz-zling result for PrOs4Sb12, compared to UPt3, is that despite the sharpness of the specific heat transitions, re-sistivity and susceptibility reveal inhomogeneities, which means that this new compound probably has unusual metallurgical specificities.
Continuing the parallel with UPt3, basic measure-ments rapidly supported the intrinsic origin of the two transitions: they were probing the respective field and pressure dependence of both transitions. Indeed, a com-plete (H-T) phase diagram was rapidly drawn, showing that in UPt326, like in U1−xT hxBe1327, the two transi-tions observed in zero field eventually merged under mag-netic field, due to a substantial difference in dTc/dH. It is even more true for the pressure dependence of Tc1,2, as the thermal dilation has jumps of opposite sign at the two transitions, indicating opposite variations of Tc1,2 under pressure (Ehrenfest relations)28. So in this compound, the two transitions could be rapidly associated with a change of the symmetry of the order parameter indicating the unconventional nature of the superconducting state. We are not so lucky in the case of PrOs4Sb12: indeed, the field dependence of Tc2 seems completely similar to that of Tc1 (fig. 4), a claim that will be made quantita-tive below. It is the same situation as in URu2Si223, and nothing in favor of an intrinsic nature of the double tran-sition can be deduced from this phase diagram. Another phase diagram has already been established by transport measurements, with a line H∗(T ) separating regions of twofold and fourfold symmetry in the angular depen-dence of thermal conductivity under magnetic field13. It may seem likely13,29 that this line would merge with the double transition in zero field. From the line H′(T ) drawn from our specific heat measurements (Tc2(H), fig. 4), we can onclude that this is not the case : H′(T ) does not match the line H∗(T ) drawn in reference13, unless there is an unlikely strong sample dependence of these lines.
Comparison of the pressure dependence of Tc1and Tc2 seems more promising: contrary to case of UPt328 the jump of the thermal expansion at the two superconduct-ing temperatures does not change sign16, but from the relative magnitude of these jumps and our specific heat peaks, we get a value dT c1/dp ≈ −0.2K/GPa, and twice as much for dT c2/dp. This supports a different origin for both transitions. The weak point is that the ther-mal expansion measurements were done on two samples mounted on top of each other, that were early samples with rather broad specific heat transitions. Thus, the
question of the intrinsic nature of the double supercon-ducting transition remains open.
B. Upper critical field
Another quantity which has not been thoroughly dis-cussed is the upper critical field Hc2(T ). In heavy fermion superconductors, Hc2(T ) has always proved to be an in-teresting quantity, mainly due to the large mass enhance-ment of the quasiparticles. Indeed, the usual orbital lim-itation is very high in these systems, due to the low Fermi velocity, so that the authors of reference1 could, from their Hc2(T ) data, confirm the implication of heavy quasiparticles in the Cooper pairs (revealed also by the specific heat jump at Tc). They also gave an estimate of the heaviest mass: ≈ 50 m0, where m0is the free electron mass.
But, as the orbital limitation is very high, Hc2(T ) is also controlled by the paramagnetic effect. A quantita-tive fit of Hc2(T ) easily gives the amount of both limi-tations, except that on this system, Hc2(T ) has an ex-tra feature: a small initial positive curvature close to Tc. This feature has been systematically found, what-ever the samples and the techniques used to determine Hc2(T ) (ρ, χ and Cp)1,13,14,21. Our data, obtained by ρ on sample n◦1c and Cp on sample n◦1, matches all other published results. So we can now consider this curvature of Hc2(T ) as intrinsic, and not due to some artifact of transport measurements, or coming from inhomogeneity in the sample. Such an intrinsic positive curvature also appears in MgB230or in borocarbides like YNi2B2C and LuNi2B2C31.
1. Physical inputs
We propose an explanation based on different gap am-plitudes for the different sheets of the Fermi surface of PrOs4Sb12, which is made quantitative through a ”two-band” model32. Microscopically, STM spectroscopy also reveals an anisotropic gap, with zero density of states at low energy (fully open gap) but a large smearing of the spectra9. Recent microwave spectroscopy measurements also discuss a two band model22, but in order to explain the double transition. We insist that our model has noth-ing to do with the double transition, which clearly in-volves heavy quasiparticles both at Tc1and at Tc2(see the size of the two specific heat jumps): our aim is a quan-titative understanding of Hc2(T ), based on the normal state properties of PrOs4Sb12, as in MgB2 or borocar-bides where no double transition has ever been observed. The physical input of a multi-band model for Hc2(T ) is to introduce different Fermi velocities and different in-ter and intra band couplings. As a result, Tc is always larger than for any of the individual bands33. The slope of Hc2 at Tc is larger for slower Fermi velocity (heavier) bands. Positive curvature of Hc2(T ) is easily obtained
6 if the strongest coupling is in the heaviest bands (large
Hc2), with a slight Tc increase due to the inter band cou-pling to the lightest bands (small initial slope)31.
2. The two-band model:
There are at least three sheets for the Fermi surface of PrOs4Sb12, but in the absence of a precise knowl-edge of the pairing interaction, a full model would be unrealistic, having an irrelevant number of free parame-ters. A two band model is enough to capture the physics of anisotropic pairing, although only the correspondence with band calculations becomes looser. In our model, band 2 would correspond to the lightest (β) band de-tected by de-Haas van Alphen measurements, and band 1 would be a heavy band having most of the density of states. Indeed, the de Haas-van Alphen experiments on PrOs4Sb1234,35 reveal the presence of light quasiparti-cles (band β) and heavier partiquasiparti-cles (band γ). The heavi-est quasiparticles are at present only seen by thermody-namic measurements (Cp or Hc2). Anisotropic coupling between the quasiparticles is considered in the framework of an Eliashberg strong coupling two-band model32in the clean limit, with an Einstein phonon spectrum (charac-teristic ”Debye” frequency Ω). Let us point out that the results do not depend on (and a fortiori do not probe) the pairing mechanism, which is likely to be much more exotic than the usual electron-phonon mechanism. Com-pared to a single band calculation, there is now a matrix of strong coupling parameters λi,j describing the diffu-sion of electrons of band i to band j by the excitations responsible for the pairing.
What matters for Hc2(T ) is the relative weight of the λi,j, not their absolute value: we consider Tcor the renor-malized Fermi velocities as experimental inputs. λi,j de-pends both on the interaction matrix elements between bands i and j, and on the final density of states of band j33. In MgB
2, it is claimed that electron-phonon coupling is largest within the σ bands. Here, knowing nothing about the pairing mechanism, we assume con-stant inter and intra band coupling, so that the rela-tive weight of the λi,j is only governed by the density of states of band j. This density of states is itself pro-portional to the contribution of that band to the specific heat Sommerfeld coefficient: 500mJ/K2.mol1 for band 1, 20mJ/K2.mol for band 234,35. The Fermi velocity of band 1 (not observed by de Haas-van Alphen measure-ments) is the main adjustable parameter of the fit : we find vF 1 = 0.0153 106m/s−1, in agreement with1 where the Fermi velocity has been inferred from the slope of Hc2(T ) at Tc ignoring the initial positive curvature. All other coefficients are either arbitrary (λ1,1=1) (in agree-ment with the strong coupling superconductivity con-cluded in11), conventional values (gyromagnetic ratio for the paramagnetic limitation g = 2, Coulomb repulsion parameter µ∗
i,j = 0.1δi,j), or fixed by experimental data (Tc = 1.887 K=⇒ Ω = 21.7K, vF 2 = 0.116.106m.s−1
0
0.5
1
1.5
2
3.5
0
0.5
1
1.5
µ
0
H
(
T
)
T (K)
sample n°1
FIG. 8: Open circles show the data of Hc2(T ) by specific heat
measurement on PrOs4Sb12(sample n◦1) . The lines show fits
with a two-band model (solid line), with a single-band model (dashed line), without the paramagnetic limit (g=0) (dotted line). It shows that the increase of Tc due to the coupling
with light qp band is rapidly suppressed in weak magnetic fields. Hc2is also clearly Pauli limited, supporting a singlet
superconducting state. The parameters for the solid line fit are: g = 2, µ∗ i,j = 0.1δi,j, vF 1 = 0.0153 10 6 m/s−1 (heavy band), vF 2 = 0.116.10 6
m.s−1 (lightest band, from de
Haas-van Alphen oscillations35
), Tc= 1.887 K=⇒ Ω = 21.7K.
from the de Haas-van Alphen data on the β band). The model fits well the experimental data (cf. fig. 4), includ-ing the small positive curvature. Before discussinclud-ing the interpretation of the fit as regards the values of the rameters and the parity of the superconducting order pa-rameter, let us note that we can fit the H′(T ) line (fig. 4) with the same parameters as for Hc2 except Ω, adjusted to give Tc = 1.716K. There is a good agreement with all data except at very low temperature or near Tc where the curvature is reduced compared to Hc2(T ). However, these deviations are weak, and this is why we claim that H′(T ) has the same behavior than Hc2(T ), which does not help to identify the second transition with a symme-try change of the superconducting order parameter.
3. Interpretation
Shown also in fig. 8 are the calculations of Hc2(T ) for a single band model: vF 1, the characteristic frequency Ω and λ1,1 have the same values as before, but all other λi,j coefficients have been turned down to zero, elimi-nating the effects of the light electron band. Tc is then reduced (down to 1.78 K) and the positive curvature dis-appears. We also observe that the fit of Hc2 is
basi-cally unchanged above 1 T, meaning that low fields sup-press the superconductivity due to the light electron band restoring a ”single band” superconducting state. This is the same effect observed more directly in MgB2 with specific heat measurements under magnetic field : the smaller gap rapidly vanishes, leading to a finite density of states at the Fermi level under magnetic fields due to the π band36. This suppression of the light quasi-particle superconductivity would have here an effect on specific heat too small to be observed (contribution of the light quasiparticles to the specific heat of order 4% of the Sommerfeld coefficient, itself buried in the large Schottky anomaly). But it may have much larger ef-fects on transport. Let us note that the clean limit is a posteriori justified: from vF 1, we find a coherence length ξ0∼110˚A, whereas from a residual resistivity ρ0and spe-cific heat coefficient γ ∼ 0.5J/K2.mol∼ 2.103J/K2.m3, we get vF 1l ∼
3L0
ργ ∼2.10
−3m2/s yielding a mean free path l ∼ 1300˚A > 10ξ0.
More interestingly, the quantitative fit of Hc2 also al-lows a discussion of the parity of the order parameter in PrOs4Sb12. Indeed, like other heavy fermion super-conductors, despite the low-Tc value, Hc2 can be sen-sitive to the Pauli limit in case of singlet pairing. The fit in fig. 8 includes this paramagnetic limitation, with the conventional free electron value for g (g = 2). Also shown in fig. 8 is the calculation of Hc2(T ) with the same parameters but for g = 0, i.e. without any paramag-netic limit. The strong deviations observed demonstrate that the paramagnetic effect controls Hc2 at low T in PrOs4Sb12. Quantitatively, the paramagnetic effect de-pends on the coupling strength. Yet, we choose arbitrar-ily λ = 1. A rather strong coupling regime is supported by N QR experiments11. Even for a weak coupling pic-ture (λ = 0.6), the fit yields g = 1.55. In both cases, the paramagnetic limit remains important, supporting a singlet nature of the superconductivity, contrary to that had been suggested in37,38,39and in agreement with the supposition in7,29. This result should be quite robust, independent of the two band model. It could be inval-idated if the mass renormalization mechanism was field dependent, which could be an explanation for the dif-ference in the large specific heat Sommerfeld coefficient
obtained in low field, and the de Haas-van Alphen mea-surements performed at high field8. In such a case, the ”saturation” of Hc2(T ) at low temperature could arise from a reinforcement of the orbital limitation alone.
VI. CONCLUSION
To conclude, we have drawn a very precise supercon-ducting phase diagram of PrOs4Sb12 down to 350 mK, by a specific heat measurement. We have yet no clear ev-idence of the unconventional nature of the superconduct-ing order parameter from this phase diagram. The su-perconducting phase diagram with the symmetry change of the order parameter drawn by K. Izawa et al13 from transport measurements does not seem related to the double transition observed with specific heat measure-ments. Despite the high quality of the sample, we can-not completely exclude that there are still two parts with different Tc in our sample, as H
′
(T ) is just scaled from Hc2 with respect to Tc. The puzzling result is that de-spite sharp specific heat transitions, inhomogeneities are still present in the samples. This calls for caution in the claim of various types of nodes of the gap by different sophisticated techniques: the most urgent task is to un-derstand the problem of sample quality. Contrastingly, the upper critical field is very reproducible, independent of samples and types of measurements. It has been ana-lyzed with a strong coupling two-band model taking ac-count of the spread in the effective masses of the quasi-particles and of the pairing strength as suggested also by STM spectroscopy measurements9. The strong influence of the paramagnetic limit on Hc2is the first experimental argument for a singlet superconducting order parameter.
Acknowledgments
We acknowledge many fruitfull discussions with K. Izawa, H. Harima, V. Mineev, H. Suderow, J-L. Tho-lence, P.C. Canfield and G. Lapertot. This research was supported by the Grant-in Aid for Scientific Research on the Priority Area ”Skutterudites” from MEXT in Japan.
1
E.D. Bauer, N.A. Frederick, P.-C. Ho, V.S. Zapf, and M.B. Maple, Phys. Rev. B 65, 100506(R) (2002).
2
K. Takegahara, H. Harima and A. Yanase, J. Phys. Soc. Jpn. 70, 1190 (2001).
3
M. Kohgi, K. Iwasa, M. Nakajima, N. Metoki, S. Araki, N. Bernhoeft, J.-M. Mignot, A. Gukasov, H. Sato, Y. Aoki and H. Sugawara, J. Phys. Soc. Jpn. 72, 1002 (2003).
4
Y. Aoki, T. Namiki, S. Ohsaki, S.R. Saha, H. Sugawara, and H. Sato, J. Phys. Soc. Jpn. 71, 2098 (2002).
5
T. Tayama, T. Sakakibara, H. Sugawara, Y. Aoki, and H. Sato, J. Phys. Soc. Jpn. 72, 1516 (2003).
6
C.R. Rotundu, H. Tsujii, Y. Takano, B. Andraka, H. Sug-awara, Y. Aoki, and H. Sato, Phys. Rev. Letters 92, 037203 (2004).
7
K. Maki, H. Won, P. Thalmeier, Q. Yuan, K. Izawa and Y. Matsuda, Europhys. Letters. 64, 496, (2003).
8
H. Harima (private communication).
9
H. Suderow, S. Vieira, J.D. Strand, S. Bud’ko and P.C. Canfield, Phys. Rev. B 69, 060504 (2004).
10
D.E. MacLaughlin, J.E. Sonier, R.H. Heffner, O.O. Bernal, B.L. Young, M.S. Rose, G.D. Morris, E.D. Bauer, T.D. Do and M.B. Maple, Phys. Rev. Letters 89, 157001 (2002).
8
11
H. Kotegawa, M. Yogi, Y. Imamura, Y. Kawasaki, G.-q. Zheng, Y. Kitaoka, S. Ohsaki, H. Sugawara, Y. Aoki, and H. Sato, Phys. Rev. Letters 90, 027001 (2003).
12
E.E.M. Chia, M.B. Salamon, H. Sugawara, and H. Sato, Phys. Rev. Letters 91, 247003 (2003).
13
K. Izawa, Y. Nakajima, J. Goryo, Y. Matsuda, S. Osaki, H. Sugawara, H. Sato, P. Thalmeier, and K. Maki, Phys. Rev. Letters 90, 117001 (2003).
14
R. Vollmer, A. Faißt, C. Pfleiderer, H. v. L¨ohneysen, E.D. Bauer, P.-C. Ho, V. Zapf and M.B. Maple, Phys. Rev. Lett. 90, 057001 (2003).
15
M.B. Maple, P.-C. Ho, V.S. Zapf, N.A. Frederick, E.D. Bauer, W.M. Yuhasz, F.M. Woodward, and J.W. Lynn, J. Phys. Soc. Jpn. 71 (2002), Suppl. 23.
16
N. Oeschler, P. Gegenwart, F. Steglich, N.A. Frederick, E.D. Bauer, and M.B. Maple, Acta Physica Polonica B 34, 959 (2003).
17
Y. Aoki, A. Tsuchiya, T. Kanayama, S.R. Saha, H. Sug-awara, H. Sato, W. Higemoto, A. Koda, K. Ohishi, K. Nishiyama, and R. Kadono, Phys. Rev. Letters 91, 067003 (2003).
18
N. Takeda and M. Ishikawa, Physica B 259-261, 92 (1999).
19
E.D. Bauer, A. ´Slebarski, E.J. Freeman, C. Sirvent, and M.B. Maple: J. Phys: Condens Matter 13, 4495-4503 (2001).
20
Y. Aoki (private communication).
21
P.-C. Ho, N.A. Frederick, V.S. Zapf, E.D. Bauer, T.D. Do, M.B. Maple, A.D. Christianson, and A.H. Lacerda, Phys. Rev. B 67, 180508 (2003).
22
D.M. Broun, P.J. Turner, G.K. Mullins, D.E. Sheehy, X.G. Zheng, S.K. Kim, N.A. Frederick, M.B. Maple, W.N. Hardy, and D.A. Bonn, cond. mat. 0310613
23
A.P. Ramirez, T. Siegrist, T.T.M. Palstra, J.D. Garrett, E. Bruck, A.A. Menovsky and J.A. Mydosh, Phys. Rev. B 44, 5392 (1991).
24
A. Sulpice, P. Gandit, J. Chaussy, J. Flouquet, D. Jaccard, P. Lejay and J.L. Tholence, J. Low Temp. Phys 62, 39
(1986).
25
K. Hasselbach, L. Taillefer and J. Flouquet, Phys. Rev. Letters 63, 93 (1989).
26
G. Bruls, D. Weber, B. Wolf, P. Thalmeier, B. L¨uthi, A. de Visser and A. Menovsky, Phys. Rev. Letters 65, 2294 (1990);
S. Adenwalla, S.W. Lin, Q.Z. Ran, Z. Zhao, J.B. Ketterson, J.A. Sauls, L. Taillefer, D.G. Hinks, M. Levy and B.K. Sarma, Phys. Rev. Letters 65, 2298 (1990).
27
D.S. Jin, S.A. Carter, T.F. Rosenbaum, J.S. Kim, and G.R. Stewart, Phys. Rev. B 53, 8549 (1996).
28
K. Hasselbach, A. Lacerda, K. Behnia, L. Taillefer, and J. Flouquet, J. of Low Temp. Phys. 81, 299 (1990).
29
Jun Goryo, Phys. Rev. B 67, 184511 (2003).
30
S.L. Budko and P.C. Canfield, Phys. Rev. B 65, 212501 (2002).
31
S.V. Shulga, S.-L. Drechsler, G. Fuchs, K.-H. M¨uller, K. Winzer, M. Heinecke, and K. Krug, Phys. Rev. Letters 80, 1730 (1998).
32
M. Prohammer and E. Schachinger, Phys. Rev. B 36, 8353 (1987).
33
I.I. Mazin and V.P. Antropov, Physica C 385, 49 (2003).
34
H. Sugawara, S. Osaki, S.R. Saha, Y. Aoki, and H. Sato, Acta Physica Polonica B 34, 1125 (2003).
35
H. Sugawara, S. Osaki, S.R. Saha, Y. Aoki, H. Sato, Y. Inada, H. Shishido, R. Settai, Y. Onuki, H. Harima, and K. Oikawa, Phys. Rev. B 66, 220504(R) (2002).
36
F. Bouquet, Y. Wang, I. Sheikin, T. Plackowski, A. Junod, S. Lee and S. Tajima, Phys. Rev. Letters 89, 257001 (2002).
37
F.B. Anders, Eur. Phys. J. B 28, 9-28 (2002).
38
K. Miyake, H. Kohno, and H. Harima, J. of Phys. Cond. Matter 15, L275-84 (2003).
39
M. Ichioka, N. Nakai, and K. Machida, J. of the Phys. Soc. of Japan 72, 1322 (2003).