ISBN: 978-85-89274-32-6
Editor: Incaper Format: digital/printed May 2019
INCAPER EDITORIAL BOARD - CEO
President: Nilson Araujo Barbosa
Technology and Knowledge Transfer Management: Sheila Cristina P. Posse Research, Development and Innovation Management: Luiz Carlos Prezotti Technical Assistance and Rural Extension Management: Celia J. Sanz Rodriguez Editorial Coordination: Aparecida de Lourdes do Nascimento
REPRESENTATIVE MEMBERS: Anderson Martins Pilon André Guarçoni M.
Cíntia Aparecida Bremenkamp Fabiana Gomes Ruas
Gustavo Soares de Souza José Aires Ventura
Marianna Abdalla Prata Guimarães Renan Batista Queiroz
GRAPHIC DESIGN, ELECTRONIC EDITING, FINAL ARTWORK AND COVER
Laudeci Maria Maia Bravin
ENGLISH TRANSLATION
Marcelle Gualda Pasolini
CATALOGING
Merielem Frasson da Silva
PHOTO CREDIT
Augusto Barraque, Incaper and authors’ collection © 2019 - Incaper
Capixaba Institute for Research, Technical Assistance and Rural Extension
Rua Afonso Sarlo, 160 - Bento Ferreira - CEP: 29052-010 - Vitória-ES - Brasil - Caixa Postal: 391
Telephone: 55 27 3636 9888; 55 27 3636 9846 - [email protected] | www.incaper.es.gov.br
All rights reserved under the Law No 9610, which protects the copyright. Any reproduction, in whole or in part, of this book
or of one or several of its components, by whatsoever process, is forbidden without the express authorization of Incaper or publishers.
GOVERNMENT OF THE STATE OF ESPÍRITO SANTO
Governor of the State of Espírito Santo
Renato Casagrande
DEPARTMENT OF AGRICULTURE, SUPPLY, AQUACULTURE AND FISHERIES - SEAG State Secretary for Agriculture, Fisheries,
Aquaculture and Fisheries
Paulo Roberto Foletto
CAPIXABA INSTITUTE FOR RESEARCH, TECHNICAL ASSISTANCE AND RURAL EXTENSION - INCAPER President director
Antonio Carlos Machado
Technical director
Nilson Araujo Barbosa
Administrative and financial director
Cleber Guerra
EDITORIAL COORDINATION AND PROOFREADING OF STANDARDIZATION
Liliâm Maria Ventorim Ferrão
Conilon Coffee / technical editors, Romário Gava Ferrão ... [et al.]; english translation Marcelle Gualda Pasolini. - 3edition updated and expanded. - Vitória, ES : Incaper, 2019.
974p.: il. color.
Translated from: Café Conilon, 2017 - Incaper. System Required: Adobe Reader
Access mode: https://bibliotecaruitendinha.incaper.es.gov.br/
ISBN: 978-85-89274-32-6
1. Brazil. 2. Espírito Santo (State). 3. Coffee Cultivation. 4. Conilon Coffee I. FERRÃO, Romário Gava (Ed.). II. FONSECA, Aymbiré Francisco Almeida da (Ed.). III. FERRÃO, Maria Amélia Gava (Ed.). IV. DE MUNER, Lúcio Herzog (Ed.). V. Capixaba Institute for Research, Technical Assistance and Rural Extension. VI. Title.
CDD: 633.73 Incaper - Rui Tendinha Library
International Cataloging Data in Publication (ICP)
Elaborated by Merielem Frasson da Silva - CRB-6 ES/675 C129
30
Technical Coefficients and
Production Costs of Conilon Coffee in
Espírito Santo
Lúcio Herzog De Muner, Edileuza Aparecida Vital Galeano, Romário Gava Ferrão,
João Luiz Perinni, Abraão Carlos Verdin Filho, Wander Ramos Gomes, Sérgio Marins Có, Marcone Comério, Luiz Antonio Bassani, Roberto Passon Casagrande and Levy Heleno Fassio
1 INTRODUCTION
The economic and social environment in which coffee cultivation is inserted is becoming increasingly complex and competitive, demanding efficiency and increasing professionalism of producers. According to Callado, A. A. C. and Callado, A. L. (2015), what was once understood as an economic exploitation of isolated rural properties, is currently part of a wide complex productive system with technological and market interrelations.
The rural producer or manager needs to know how the profitability of his productive activity is, what the results are, and how they can be optimized by evaluating results, income sources and expenses types and how to seek better profitability (CREPALDI, 2012).
The costs calculation presents one of its greatest implantation and development difficulties in the productive system due to the necessity of rigor in the control of its elements in order to obtain a correct appropriation of the costs of each product, mainly on the general expenses, that must be shared by the several products cultivated by the producer (CALLADO, A. A. C.; CALLADO, A. L., 2015).
So, the coffee grower must be aware to the proper management of his property, making decisions based on technical, economic and market information. Among these information, production cost is an important tool, reflecting parameters related to the agricultural enterprise profitability and providing indicative of future decisions, such as the activity expansion, retraction or extinction.
The agricultural production cost is an exceptional tool to control and manage productive activities and generates important information to support rural producers’ decisions, as well as the formulation of strategies by the public sector (CONAB, 2010).
In coffee-growing, several factors contribute to form the production cost, so the producer finds difficulties in preparing and analyzing cost sheets. These difficulties are inherent to the technology used, the production period, the correct evaluation of the productive factors and
the technical coefficients and the useful life of fixed resources, among others.
The analysis and knowledge of production costs are essential factors for the effective control of the rural enterprise, providing subsidies to the use of resources rationalization, with a purpose of improving the activity economic results. In general, this increase can be achieved by increasing productivity rates, which, in most cases, lead to costs reduction and/or profitability increase.
The high productivity in the coffee conilon agribusiness was achieved thanks to the research with new, more productive varieties, highlighting new genetically superior materials, the densification of cultivation plots, the diffusion of good harvesting and post-harvesting practices, the harvesting mechanization and the use of irrigation (BLISKA et al., 2009). In Espírito Santo, the Instituto Capixaba de Pesquisa, Assistência Técnica e Extensão Rural - Incaper (Capixaba Institute for Research, Technical Assistance and Rural Extension) has made a great contribution to the advancement of crop productivity. Data from the Companhia Nacional de Abastecimento - Conab (National Supply Company) indicate that the average conilon coffee productivity in Espírito Santo increased from 14.9 bags/ha in 2000 to 34.7 in 2012 (CONAB, 2015).
According to Pezzopane et al. (2009) and Teixeira et al. (2012), irrigation has been an instrument to raise productivity and improve the quality of the coffee produced, besides guaranteeing employment and income for the sector. The irrigation use reduces the risk of production losses, but requires investments, which should be considered in the production costs evaluation.
The productivity achieved depends on the set of inputs and technologies used. In the Espírito Santo coffee culture there are highly specialized producers who use the most advanced technologies, but many still do not have access to these technological innovations. In this chapter, the technical coefficients will be presented for each level of productivity that can be achieved, given the resources used by the producers. The technical coefficients and production cost presented provide subsidies to coffee growers in the economic evaluation of the enterprise.
This chapter presents: (i) the technical coefficients for the implantation and maintenance of conilon coffee plantations, according to the predominant production systems in the State; (ii) coffee production costs in different levels of technology and management, in properties with different levels of productivity; and (iii) the productivity level from which it is recommended to adopt irrigation; (iv) indicators of investment return in conilon coffee production.
2 AGRICULTURAL PRODUCTION COST
The need to establish a new reference standard for the granting of agricultural financing meant that from 1979 the government started to use the production costs structure of the then Companhia de Financiamento da Produção - CFP (Production Financing Company), currently Conab. This structure was built based on the elaboration of technical production coefficient matrices, which allowed to estimate production costs more safely. The purpose of
this initiative was to subsidize studies to determine minimum prices and provide information to subsidize other agricultural policies (CONAB, 2010). In the mid-1990s, internal studies led the CFP to develop and disseminate a methodology for elaborating agricultural production costs. The methodology indicates, as variable cost, the expenses with machines, temporary and permanent labor, seeds, fertilizers, pesticides, external transport, classification, storage, transportation and insurance. In fixed costs, the methodology establishes the recording of depreciated expenses, periodic machinery maintenance, social charges, fixed capital insurance and expected payment on fixed capital and land (CONAB, 2010). The production costs monitoring provides conditions for studies of public policies and government programs, as well as subsidizing technical discussions to improve the production and marketing process.
In the production cost calculation, all items of expenditure, whether explicit or not, must be taken into account by the producer, from the initial stages of soil correction and preparation to the initial stage of product commercialization.
Explicit costs are amounts disbursed that can be directly measured, are determined according to the prices practiced by the market. Examples of explicit costs include inputs (seeds, fertilizers and agrochemicals), temporary labor, machinery and animal services, interest, taxes and others.
Implicit costs are those that are not directly disbursed in the production process. They correspond to the remuneration of factors that are already owned by the farm, but can not fail to be considered, since they constitute, in fact, in expenditures. The measurements are made in an indirect way, through the imputation of values that should represent the opportunity cost of their use. Examples of implicit costs are expenses with depreciation of improvements, facilities, machinery and agricultural implements, and remuneration of fixed capital and land (CONAB, 2010).
As for fixed costs, according to Santos, Sagatti and Marion (2009) and Crepaldi (2012), any permanent crop that produces fruits will be subject to depreciation. In this case, the calculation is made as follows: the acquisition or formation cost of the crop is depreciated in as many years as the production costs. In this case, the calculation is made as follows: the acquisition or formation cost of the crop is depreciated in as many years as the production costs. The depreciation will be applied to the culture after it has been formed (never under development), from the first harvest. According to the authors cited above, the people indicated to determine depreciation rates in agricultural activities are agronomists, agricultural technicians or the farmers themselves, who are aware of the useful life or productive capacity of the enterprise.
Depreciation can be calculated by the straight-line method, which considers depreciation at constant annual rates over the useful life of the crop or according to the estimated permanent crop production. According to Crepaldi (2012), this method is advantageous because it entails lower costs since it does not provide excessive reduction of profit or loss and avoids large fluctuations in results over several years. For Santos, Sagatti and Marion (2009), the depreciation calculated according to the estimated production, on the one hand, has the advantage of having less depreciation cost in the bad years since the rate is calculated in proportion to the production. On the other hand, in the year of higher production, depreciation will be higher.
For this work, the straight-line method was chosen.
By the economic analysis of an enterprise, it is possible to verify how the production technology, together with the prices of the inputs, determines the cost of production. According to Pindyck and Rubinfeld (2014), the inputs can be combined in different ways so that a certain amount of product is obtained. The important thing is to choose an optimal combination that minimizes costs and results in the highest production possible. According to Reis (2007), the estimation of costs is linked to the technology management, that is, the efficient allocation of productive resources and the knowledge of their prices.
The domain of technology and knowledge of the results of expenditure on inputs and services in each productive phase of farming, which has in the cost an important indicator of the choices of the producer, is essential for the efficient and effective management of an agricultural production unit (CONAB, 2010).
In the cost evaluation, it must distinguish the accounting analysis from the economic one. The concept of production cost involves economic costs that refer to the use of resources in the production. According to Pindyck and Rubinfeld (2014), the economic word implies that we must distinguish the costs that the company can control from those it can not. The economic cost considers the explicit costs, which refer to the disbursement actually made, and the implicit ones, related to those for which no effective disbursements occur, as is the of depreciation and the opportunity cost case, also called alternative. Among the costs that are not possible to control, we have the opportunity one, which is associated with the opportunities left aside, if the company does not use its resources in the best way possible.
Short-term costs refer to expenditure on resources, whose duration is shorter than the production cycle, that is, they are fully incorporated into the product in this period, and can not be used for another harvest. In general, they are costs with fertilizers, pesticides, fuels, labor, machinery and equipment services and expenses in general (CÓ, 2003). They are, therefore, short-term direct monetary expenditures that provide, when added to the opportunity cost, the total variable cost.
Fixed costs do not vary with the production level and must be paid even if it does not occur. They can only be eliminated if the company ceases to operate. The variable costs oscillate when the production level changes. The distinction of which costs are fixed and which are variable depends on the deadline with which we are dealing. Fixed resources are those that last longer than the production cycle and, therefore, are not fully incorporated into the product in the short term, doing so in as many cycles as they allow for their useful life. In general, this category includes land, improvements, machinery, equipment, taxes and fixed rates, crops implementation, irrigation assemblies, etc. Because they are not easily changed, these resources determine the production scale of the company, establishing the maximum limit of the product quantity per unit of time that can be produced. For the total fixed cost determination, the depreciation of durable goods and their opportunity cost are considered (PINDYCK; RUBINFELD, 2014),
Opportunity cost, also called alternative cost, is the return that the capital used in the agricultural activity would be providing if it was applied in other alternatives. It allows to verify
if the enterprise in question is economically viable, provided that its financial return is equal or superior to the other alternatives of capital use (real interest rate of the saving book, land rental, other activities profitability, etc.). According to Vasconcelos (2011), we can consider two types of relations between the amount produced and the amount of factors used. The first is the short term analysis that is the period in which there is at least one fixed factor of production. The second is long-term analysis where all factors are variable.
The operating cost includes all resources that require monetary disbursement by the productive activity for its reconstitution, such as expenditures on inputs, labor, maintenance and general expenses, including the fixed resources depreciation. The total operating cost is shared into fixed operating cost, composed of depreciation, and variable operating cost, consisting of disbursements or operating expenses. Adding the operational cost to the opportunity cost, it is obtained the economic cost. Its purpose in the analysis is the decision option in cases where the financial returns are lower to those of other alternatives, represented by the opportunity cost (REIS, 2007). Total cost represents the sum of all fixed and variable costs, and is also called economic cost. Its division by quantity produced provides the average total or unit cost, which is the cost of producing a unit of the product. Proceeding in a similar way, we arrive at the average variable costs, average fixed and average operational.
2.1 SIMPLIFIED ECONOMIC ANALYSIS AND VIABILITY INDICATORS
The results of the market conditions and income of the agricultural enterprise (or productive activity) are evaluated by the price of the product or the average revenue. The latter can be considered the price of the product plus the sales value of secondary products (by-products). By comparing the average revenue, or the price, with the average total costs, it obtains the economic analysis of the activity per productive unit, determining the enterprise profitability. In the operational analysis case, when comparing the average revenue or the price with the operational costs, one has the concept of residue or margin (REIS, 2007).
Considering the short term, in simplified economic analysis of costs, it is essential to verify how the resources used in a production process are being remunerated and how profitability can be compared to other alternatives of time and capital. The variables revenue and prices are fundamental to verify economic profit and normal profit (REIS, 2007).
The production costs analysis over time, at each productivity level, given the technical coefficients, allows the evaluation of which variables imply in the cost increase, in the short term to achieve lower production cost in the long term, in other words, it is possible to observe the most efficient range in which production is the most economical.
Therefore, this study is presented to the coffee producer as a diagnosis of the harvest economic-financial behavior, regarding the remuneration obtained, the coverage of short (variable costs) and long (fixed costs) term resources and the comparison between the remuneration obtained by the productive activity and that one which would be obtained in other alternatives (opportunity costs) (REIS, 2007).
several situations, depending on the price position (or average revenue) compared to the costs. The economic result of the producer’s activity may present super normal or economic profit when the activity is obtaining returns greater than the best possible alternatives of time and capital use. In this case, average revenue (AR) is greater than the average total cost (ATC), which includes the alternative costs. This indicates that all the resources invested are paid, providing an additional profit, superior to that of other market alternatives. The medium- and long-term trend is for the expansion and entry of new companies into the activity, attracting competitive investments (REIS, 2007; PINDYCK; RUBINFELD, 2014).
The normal profit occurs when the activity is obtaining returns equal to those that would be obtained in the best possible alternatives of resources use. This means stability, maintaining the production level in the short and long term. Occurs when AR (or price) is equal to ATC. The normal profit is, therefore, the own alternative or opportunity cost.
When the product price or AR does not cover the ATC, the operational cost can be used to analyze the enterprise profitability, since the concept of residue allows a more detailed view of the company economic situation. The positive residue occurs when the AR is lower than the ACT, but higher than the average total operational cost (ATOC). In this situation, all the resources invested in the enterprise are paid (fixed and variable operating costs). However, the remuneration is lower than that of other activities (alternative cost). The trend is to remain in business, however, in the long term, the entrepreneur could seek other better alternatives for the capital application (REIS, 2007).
If AR (or price) is equal to ATOC, the residue is zero. For Reis (2007), in this case, the activity covers all operating costs, but does not provide the remuneration of the capital tied in the enterprise The trend is to remain in the activity, but the entrepreneur may abandon it if the results do not improve. In cases of negative residual, if the price is lower than the ATOC, but still higher than the average variable operating cost (AVOC), the activity is covering all variable operating costs (operating expenses) and only part of the fixed operating cost (depreciation). In these circumstances, the enterprise can only be sustained in the short term, not considering the capital remuneration and the replacement of part of the fixed resources. When the price equals the average variable operating cost, the activity only covers variable cost funding expenses, and is also sustained for a short time. Even in cases where the price is lower than AVOC, the activity, to cover variable cost funding expenses that are mandatory in the short term, will have to inject resources from other sources, which is a subsidy. Therefore, the activity way out is a decision that reduces the losses.
The economic analysis should also include the economic and financial evaluation of the investment using tools that allow to measure the enterprise viability. Such evaluation methods can be found, for example, in Gitman (2010). Among the techniques used, we have the simple
payback, which would be the time needed for the producer to recover the investment made,
without considering the amount of money in time, and the discounted payback that considers the value of money over time. In this case, the cash flows of each year are discounted to a minimum rate of TMA attractiveness which, in the specific case of this work, it was considered the rate of 6% per year.
Another method of economic evaluation of investments is the net present value (NPV), which would be the sum of the values present of the cash flows, deducted the initial investment value. For the enterprise viability, the NPV must be higher than zero.
The internal return rate (IRR) is the rate that makes NPV equal to zero. According to Gitman (2010), the internal rate of return is defined as the discount rate that equals the present value of the cash inflows to the initial investment related to an enterprise. The IRR is one of the most used methods in economic and financial analysis, since it allows the comparison between interest rates and rates of return obtained in other investment alternatives.
2.2 COFFEE CULTURE PRODUCTION COSTS: RECENT STUDIES
With increasing competitiveness in the agricultural sector, demand for research on production costs has grown. According to Nasser et al. (2012), the economic analysis of the production cost produces strategic information, since it allows the producer or rural entrepreneur to establish more effective criteria in the effort to achieve positive results in rural production.
Lima et al. (2008) estimated the production costs in coffee culture for the states of Minas Gerais, Paraná, Espírito Santo and São Paulo, measuring the productivity impact on the project financial results and showing that the productivity differential presents itself as decisive for the activity feasibility. Sarcinelli and Rodriguez (2006) presented the economic analysis of coffee production results in conventional and agroecological systems. Teixeira, Caixeta and Donzele (2008) analyzed the economic viability of coffee production by family farmers in the Zona da Mata of Minas Gerais and showed that all the analyzed properties showed a profitability capable of promoting the sustainable development of the farm from the economic point of view. Bliska et al. (2009) presented the coffee production costs in the main producing regions of Brazil, comparing these estimates with other studies. Silva et al. (2013) presented the analysis of the procedures and equipment to be used in production and the production costs of peeled cherries. Oliveira et al. (2012) presented the economic performance of alternative coffee production systems in Rondônia. Oliveira et al. (2013) presented the cost structure of coffee production for a family property.
Nasser et al. (2012) presented the economic analysis of arabica coffee production in Minas Gerais and, due to the bi-annual production of coffee, the authors recommend that the producer diversify the activities within the property to ease the critical situation of low production in a few years. The researchers also suggest that, in the coffee crop implantation and under development phases, it is important to adopt denser planting spacing and to use intercropping in the first and second years of development in order to reduce the expenses with the crop implantation. In crop management, they recommend the adoption of mechanized or semi-mechanized production systems, especially in the coffee harvesting, and, when possible, producing organic fertilizers inside the property to reduce costs with externally purchased fertilizers, such as returning straw from the coffee to the crop (NASSER et al., 2012).
Production System, regardless of their size, obtain a better economic-financial return compared to the production in the conventional system.
3 DETERMINATION OF COSTS AND REVENUES
The information collection to build the production cost was done through a panel, which is a technical meeting where the participants, by a consensus, characterize the modal productive unit of the region and indicate the technical coefficients related to the inputs, the machines, the implements, the services and price vectors that make up the technological package of this unit. In this round-table panel, extension agents and researchers from Incaper and the Cooperativa Agrária dos Cafeicultores de São Gabriel da Palha - Cooabriel (Agrarian Cooperative of Coffee Growers of São Gabriel da Palha) participated.
In the event, the resource structures, the operations and the technical coefficients for the implantation and conduction of crops with different technological levels and productivity were defined. Non-irrigated crops with yields of 25, 35 and 45 bags/ha and irrigated crops were considered for the production costs calculation, with yields of 45, 60, 80, 100 and 120 bags/ ha. The latter are conducted under the intensive use of technologies, as can be seen in the appendices, which present the technical coefficients of the different systems.
The evaluation of the conilon coffee production costs was based on the operationalization of the economic resources that make up the fixed and variable costs, as suggested by Reis (2007). In the analysis of fixed resources, the appropriate depreciation was used by the linear method, according to the methodology described in Santos, Sagatti and Marion (2009) and Crepaldi (2012). In the land case, only its opportunity cost was considered.
As for the variable costs, the expenses with inputs (fertilizers, organic matter, chemical pesticides, etc.), labor, conservation and maintenance of improvements and equipment, power, mechanized services, including drying and harvest processing were considered, and also general expenses.
For the purpose of analyzing the alternative cost or remuneration of the variable productive resources used in coffee cultivation, it was considered the real interest rate of 3% per year and for the fixed alternative costs, 6% per year, which were calculated based on the investment in inputs and labor in the crop implantation, that is, in the first year. It should be noted that the costs and revenues estimate was based on prices prevailing in the regional market in December 2014, with the conilon coffee bag quoted at R$ 263,00, free from taxes and fees.
4 ANALYSIS OF CONILON COFFEE PROFITABILITY
Table 1 shows the conilon coffee production costs in the fifth year of activity, as well as the percentage participation of the items that compose them in non-irrigated crops. From the data presented, it is noted that for the productivity level of 25 bags/ha, the fixed costs represented 15.2% of the final cost of coffee production and 84.8% of the variable cost. It is also observed
that as productivity increases, the variable costs share in the total cost composition rises. In the case of production at the productivity level of 35 bags/ha, the variable cost share reaches 87.8%, which indicates a higher expenditure on inputs and services.
Table 1. Conilon coffee production costs in Espírito Santo, according to different levels of productivity
in non-irrigated crops (fifth year of production)
Specifications 25 bags/ha 35 bags/ha 45 bags/ha R$/ha/year % R$/ha/year % R$/ha/year % 1 TOTAL COST 6.113,66 100.0 8.298,58 100.0 9.538,31 100.0 1.1 TOTAL VARIABLE COST 5.185,29 84.8 7.283,90 87.8 8.370,02 87.8
Inputs 1.803,77 29.5 2.561,59 30.9 2.959,07 31.0
services 3.230,50 52.8 4.510,17 54.3 5.167,17 54.2
Alternative cost 151,03 2.5 212,15 2.6 243,79 2.6
1.2 TOTAL FIXED COST 928,37 15.2 1.014,67 12.2 1.168,29 12.2
Depreciation 488,61 8.0 534,04 6.4 614,89 6.4
Alternative cost 439,75 7.2 480,63 5.8 553,40 5.8
2 TOTAL OPERATING COST 5.522,88 100.0 7.605,79 100.0 8.741,12 100.0 Variable operating cost 5.034,27 91.2 7.071,75 93.0 8.126,23 93.0 Fixed operational cost 488,61 8.8 534,04 7.0 614,89 7.0
Source: Elaborated by the authors.
Among the components of total variable cost, services (manual and mechanized) were the largest item accounting for 52.8%, 54.3% and 54.2% for the levels of 25, 35 and 45 bags/ha of dried conilon, respectively. From the economic costs presented in Table 1, it is possible to decompose the operational and alternative (or opportunity) costs. The expenses with inputs and services constitute the variable operating cost, that is, the disbursements actually made in the analysis period, which totaled R$5.185,29 for the first level of productivity, R$7.283,90 for the second and R$8.370,02 for the third. Fixed operational cost, mainly represented by crops depreciation and improvements, was estimated at 8.8%, 7.0% and 7.0% of the total operating cost for those productivity levels, respectively.
On the other hand, the financial burden represented by the alternative fixed cost of the capital invested in coffee production accounted for 7.2% of the cost of each coffee bag produced in the first level, 5.8% in the second and 5.8% in the third.
In Table 2, the cost structure of the irrigated production system is presented in the fifth year of activity, which, as a whole, followed the same tendency of non-irrigated crops.
Table 2. Costs of conilon coffee production in Espírito Santo, according to different productivity levels
in irrigated crops (fifth year of production)
Specifications
45 bags/ha 60 bags/ha 80 bags/ha 100 bags/ha 120 bags/Ha R$/ha/
year % R$/ha/year % R$/ha/year % R$/ha/year % R$/ha/year % 1 TOTAL COST 10.803,30 100.0 13.229,02 100.0 16.132,37 100.0 18.217,93 100.0 20.164,86 100.0 1.1 TOTAL VARIABLE COST 8.971,87 83.0 10.797,56 81.6 13.527,81 83.9 15.518,47 85.2 17.424,33 86.4
Inputs 3.143,39 29.1 3.712,41 28.1 4.656,13 28.9 5.241,81 28.8 5.663,49 28.1
services 5.567,17 51.5 6.770,67 51.2 8.477,67 52.6 9.824,67 53.9 11.253,33 55.8
Alternative cost 261,32 2.4 314,49 2.4 394,01 2.4 451,99 2.5 507,50 2.5
1.2 TOTAL FIXED COST 1.831,44 17.0 2.431,45 18.4 2.604,56 16.1 2.699,46 14.8 2.740,53 13.6
Depreciation 963,91 8.9 1.279,71 9.7 1.370,82 8.5 1.420,77 7.8 1.442,38 7.2
Alternative cost 867,52 8.0 1.151,74 8.7 1.233,74 7.6 1.278,69 7.0 1.298,15 6.4
2 TOTAL OPERATING COST 9.674,47 100.0 11.762,78 100.0 14.504,62 100.0 16.487,24 100.0 18.359,21 100.0 Variable operating cost 8.710,55 90.0 10.483,07 89.1 13.133,80 90.5 15.066,47 91.4 16.916,83 92.1 Fixed operational cost 963,91 10.0 1.279,71 10.9 1.370,82 9.5 1.420,77 8.6 1.442,38 7.9
Source: Elaborated by the authors.
It is observed that the total production cost ranged from R$10.803,30 for the productivity level of 45 bags/ha to R$20.164,86 for a productivity level of 120 bags/ha. The variable operating cost for the irrigated system accounted for 90.0% for the productivity level of 45 bags/ha and 92.1% for 120 bags/ha. Due to increased investment in non-irrigated crops, the depreciation cost represented 8.9% for a production level of 45 bags/ha, higher than in the dryland condition.
The technical and economic efficiency is achieved when the best use of the production factors leads to the productivity increase implying in the dilution of costs by the greater volume produced. This can be proven by analyzing the decrease in average total cost as the productivity rises (Figure 1). 300 250 200 150 100 50 0 245 237 212 240 220 202 182 168 25 35 45 60 80 100 120 Bag/ha CT M e (R$/bags) Irrigated crop Non-irrigated crop
Figure 1. Average total cost (ATC) of conilon coffee production in the state of Espírito Santo, in different
farming systems and productivity levels in the fifth year of production. Source: Elaborated by the authors.
In the study period, the average price of the processed conilon coffee 60 kg bag was R$ 263,00, a price higher than the production cost observed in the fifth year, that is, the average revenue, represented by the bag price, was enough to cover costs, in all situations, the average total cost, which includes services, inputs, depreciation and opportunity cost. However, it is necessary to analyze the NPV to know if the revenues obtained are enough to cover the initial investment, that is, the crop implementation.
Figure 2 presents the economic results, in total values, for each hectare cultivated in the fifth year of activity, at the different productivity levels. In the non-irrigated system, for the productivity level of 25 bags/ha, the production cost was very close to the revenue, with a profit of only R$461,34 per hectare. For the productivity levels of 35 and 45 bags/ha, the profits were, respectively, R$906,42 and R$2.296,69. This result indicates that it is worth investing a little more to produce at a higher productivity level.
Figure 3 presents the economic results for irrigated crops. Profit ranged from R$1.031,70 to the productivity level of 45 bags/ha, and R$11.395,14 to the level of 120 bags/ha. It is possible to observe that profit increases with each higher level of productivity.
Table 3 presents a comparison of the results observed in the production of 45 bags/ha considering non irrigated and irrigated crops in the years 2006 and 2014. The results of 2006 were presented in Fassio et al. (2007).
Figure 2. Revenues, costs and profitability of conilon coffee grown without irrigation considering the
fifth year of production. Source: Elaborated by the authors.
11.835 R$/ha 14.000 12.000 10.000 8.000 6.000 4.000 2.000 0 Total Cost Total Revenue 6.575 6.114 9.205 8.299 9.538 2.297 461 906 25 35 45 Bag/ha Profit
Table 3. Comparison of the profit and total cost ratio for production of 45 bags/ha considering irrigated
and non-irrigated agriculture in the fifth year of production (in %)
Comparative in the level of 45 bags/ha 2006 2014
Ratio profit irrigated/non-irrigated agriculture 14% 45% Ratio total cost irrigated/non-irrigated agriculture 130% 113%
Source: Elaborated by the authors.
Considering the productivity level of 45 bag/ha in 2006, the profit obtained in the irrigated agriculture represented 14% of that obtained in the non irrigated. In 2014, this percentage increased to 45%, that is, greater profitability of irrigated agriculture regarding that observed in 2006. The total cost of irrigated and non-irrigated agriculture in 2006 was 130%. This means that the irrigated agriculture cost was approximately 30% higher than the cost of non-irrigated agriculture. In 2014, this ratio fell to 113%, that is, the non-irrigated agriculture cost for the production of 45 bags/ha is approximately 13% higher than the non irrigated one. This result indicates a decrease in production costs compared to 2006. Although the results observed for the production of 45 bags/ha are better for the irrigated crop, in the economic analysis, they indicate that this production option is still not profitable considering the technical coefficients Figure 3. Revenues, costs and profitability of coffee conilon cultivated with irrigation considering the
fifth year of production. Source: Elaborated by the authors.
30.000 25.000 20.000 15.000 10.000 5.000 0 11.835 R$/ha Total Cost Total Revenue 10.803 1.032 15.780 13.229 2.551 21.040 16.132 4.908 26.300 18.218 8.082 31.560 20.165 11.395 45 60 80 100 120 Bag/ha Profit
presented.
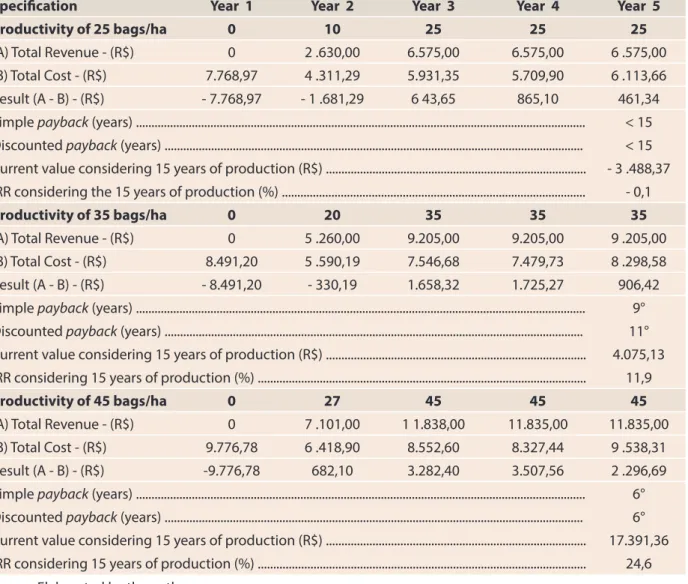
The table 4 presents the results of economic and financial analysis for conilon coffee production without irrigation considering a hurdle rate of 6% per year. This means that projects with a rate of return lower than 6% per year will be considered economically unfeasible. For the profitability analysis, it was considered the total cost, which allows a view of the project economic situation and to calculate the rate of return and NPV, were considered 15 years of useful life. As costs and revenues estimates from the fifth year, it was taken into account the same structure presented for the third, fourth and fifth years alternately until the 15th year. The payback in this case will indicate only the year in which the producer can obtain return on investment, without indicating precisely the month in which this return occurred.
Table 4. Economic and financial analysis of conilon coffee production in Espírito Santo under different
levels of productivity in non-irrigated crops
Specification Year 1 Year 2 Year 3 Year 4 Year 5
Productivity of 25 bags/ha 0 10 25 25 25
(A) Total Revenue - (R$) 0 2 .630,00 6.575,00 6.575,00 6 .575,00 (B) Total Cost - (R$) 7.768,97 4 .311,29 5.931,35 5.709,90 6 .113,66 Result (A - B) - (R$) - 7.768,97 - 1 .681,29 6 43,65 865,10 461,34 Simple payback (years) ... < 15 Discounted payback (years) ... < 15 Current value considering 15 years of production (R$) ... - 3 .488,37 IRR considering the 15 years of production (%) ... - 0,1
Productivity of 35 bags/ha 0 20 35 35 35
(A) Total Revenue - (R$) 0 5 .260,00 9.205,00 9.205,00 9 .205,00 (B) Total Cost - (R$) 8.491,20 5 .590,19 7.546,68 7.479,73 8 .298,58 Result (A - B) - (R$) - 8.491,20 - 330,19 1.658,32 1.725,27 906,42 Simple payback (years) ... 9° Discounted payback (years) ... 11° Current value considering 15 years of production (R$) ... 4.075,13 IRR considering 15 years of production (%) ... 11,9
Productivity of 45 bags/ha 0 27 45 45 45
(A) Total Revenue - (R$) 0 7 .101,00 1 1.838,00 11.835,00 11.835,00 (B) Total Cost - (R$) 9.776,78 6 .418,90 8.552,60 8.327,44 9 .538,31 Result (A - B) - (R$) -9.776,78 682,10 3.282,40 3.507,56 2 .296,69 Simple payback (years) ... 6° Discounted payback (years) ... 6° Current value considering 15 years of production (R$) ... 17.391,36 IRR considering 15 years of production (%) ... 24,6
Considering the productivity level of 25 bags/ha not irrigated, the results of the economic-financial analysis indicate that production with this level of productivity is economically unfeasible, since the investment is not recovered in the useful life of the project, which is 15 years of production. The rate of return obtained is negative. In this case, the revenue obtained only covers the operating cost, which includes expenditures on labor, inputs and depreciation. In this situation, the enterprise may be sustained only in the short term, since it covers the operating cost, but not the capital remuneration.
In the case of non-irrigated production at the productivity level of 35 bags/ha, the producer can recover the investment in the eleventh year of the activity. IRR for 15 years of production was estimated at 11.9% per year. In this case, the revenue obtained covers all operating costs, labor, inputs and depreciation and also alternative costs. The rate of return obtained is higher than the minimum rate of 6% considered, which indicates that the producer can obtain a higher return compared to other market alternatives. In the case of non-irrigated production at productivity level of 45 bags/ha, the IRR for the 15 years of production was estimated at 24.6%. For a better view of the presented indicators, Figure 4 shows a summary of these data.
The results point that for non-irrigated crops between productivity levels and coefficients considered, it is more economically feasible to produce at the level of 45 bags/ha. In it, the producer can recover the investment in the sixth year of activity. With this return, it is possible to cover all the project costs and the producer obtains profit higher to other alternatives of market, in other words, he can earn profit considered supernormal. The Table 5 shows the economic and financial analysis results for the irrigated conilon coffee production in different productivity levels presented.
Figure 4. Economic viability indicators for Investment in non-irrigated conilon coffee.
Source: Elaborated by the authors.
35 bags/ha 45 bags/ha 25 bags/ha VPL (R$ 1.000) -3,49 TIR (%) -0,08
Deducted Payback (years)
17,39 24.63 11.87 6 11 15 4,08
Table 5. Economic and financial analysis of conilon coffee production in Espírito Santo under different
productivity levels in irrigated crops
Specification Year 1 Year 2 Year 3 Year 4 Year 5
Productivity of 45 bags/ha 0 25 45 45 45
(A) Total Revenue - (R$) 0 6.575,00 11.835,00 11.835,00 11.835,00 (B) Total Cost - (R$) 15.326,23 7.760,92 9.766,09 9.540,94 10.803,30 Result (A - B) - (R$) - 15.326,23 - 1.185,92 2.068,91 2.294,06 1.031,70 Simple payback (years) ... 12o
Discounted payback (years) ... < 15 Current value considering 15 years of production (R$) ... - 193,03 IRR considering the 15 years of production (%) ... - 5.8
Productivity of 60 bags/ha 0 30 60 60 60
(A) Total Revenue - (R$) 0 7.890,00 15.780,00 15.780,00 15.780,00 (B) Total Cost - (R$) 20.347,42 9.473,99 12.302,02 12.343,22 13.229,02 Result (A - B) - (R$) - 20.347,42 - 1.583,99 3.477,98 3.436,78 2.550,98 Simple payback (years) ... 9o
Discounted payback (years) ... 12o
Current value considering 15 years of production (R$) ... 6.227,47 IRR considering 15 years of production (%) ... 9.8
Productivity of 80 bags/ha 0 45 80 80 80
(A) Total Revenue - (R$) 0 11.835,00 21.040,00 21.040,00 21.040,00 (B) Total Cost - (R$) 21.796,05 11.450,51 14.755,26 15.017,91 16.132,37 Result (A - B) - (R$) - 21.796,05 384,49 6.284,74 6.022,09 4.907,63 Simple payback (years) ... 6o
Discounted payback (years) ... 7o
Current value considering 15 years of production (R$) ... 29.454,12 IRR considering 15 years of production (%) ... 20.9
Productivity of 100 bags/ha 0 60 100 100 100
(A) Total Revenue - (R$) 0 15.780,00 26.300,00 26.300,00 26.300,00 (B) Total Cost - (R$) 22.590,20 13.225,45 16.820,22 17.180,72 18.217,93 Result (A - B) - (R$) - 22.590,20 2.554,55 9.479,78 9.119,28 8.082,07 Simple payback (years) ... 5o
Discounted payback (years) ... 5o
Current value considering 15 years of production (R$) ... 58.374,36 IRR considering 15 years of production (%) ... 32.4
Productivity of 120 bags/ha 0 72 120 120 120
(A) Total Revenue - (R$) 0 18.936,00 31.560,00 31.560,00 31.560,00 (B) Total Cost - (R$) 22.933,90 15.165,45 18.767,15 19.127,65 20.164,86 Result (A - B) - (R$) - 22.933,90 3.770,55 12.792,85 12.432,35 11.395,14 Simple payback (years) ... 4o
Discounted payback (years) ... 4o
Current value considering 15 years of production (R$) ... 90.214,51 IRR considering 15 years of production (%) ... 45.0
Considering the productivity level of 45 bags/ha irrigated, the economic-financial analysis results indicate that production covers operational costs. However, the same is not applied to all alternative costs considered. At the end of the 15 years of activity, the producer can obtain a rate of return of 5.8%, which is lower than the minimum required rate, that is 6%. Thus, the NPV obtained in the 15 years of production is negative. In this case, the return obtained covers only the operating investment, not providing remuneration also for all the alternative costs that must be considered in the project. The producers who produce at this level tend to remain in business for some time. However, in the long term, they tend to look for new, more profitable production alternatives that better reward capital.
One of the alternatives observed in practice is the coffee planting in the intercrop system, which must be accompanied by specialized technical assistance. The intercropping plantations purpose is to make better use of the area to reduce the implementation and maintenance costs through the subsistence food production and generate additional income to the producer.
In the case of irrigated production at the productivity level of 60 bags/ha, the IRR for the 15 years was estimated at 9.8%. At this level of productivity, the producer can recover the investment in the 12th year of activity. With this return, it is possible to cover all the project costs and the producer obtains profit higher to other market alternatives, in other words, he may earn profit considered supernormal. Considering productivity at the level of 80 bags/ha, the investment value can be recovered in the seventh year of activity. At the end of the 15 years of production, the estimated rate of return was 20.9%. For the productivity level of 100 bags/ha, the investment can be recovered in the fifth year of activity. At the productivity level of 120 bag/ha, the operational investment can be obtained in the fourth year of activity. At the end of the 15 years of activity, the estimated rates of return for productivity levels of 100 and 120 bags/ha are respectively 32.4% and 45.0%. For a better view of the presented indicators, Figure 5 shows a summary of these data.
The results indicate that for irrigated crops between the productivity and coefficients levels considered, it is economically viable to produce at the levels of 60, 80, 100 and 120 bags/ha, since with the revenues obtained it is possible to pay all the costs involved in the venture and obtain superior profits from other market alternatives. Considering the minimum rate of attractiveness of 6% per year, the producer can obtain supernormal profit producing at the levels of 60, 80, 100 and 120 bags/ha.
5 FINAL CONSIDERATIONS
Considering that the agricultural production cost is an essential part of the rural enterprise management and its monitoring by the State is important for the formulation, implementation and evaluation of public policies, this chapter presents the technical production coefficients and the analysis of conilon coffee production costs, which is an agricultural product of great socioeconomic importance for Espírito Santo.
Technical production coefficients for the cultivation of dry and irrigated conilon coffee were presented at three and five productivity levels, respectively. Considering the economic indicators estimated, it can be concluded that variable costs are the ones that most burdened the conilon coffee final cost in the State.
For the investment economic analysis, operational and alternative costs were considered throughout the enterprise useful life. The results indicate that in the case of the dry conilon coffee cultivation, considering a productivity level of 25 bags/ha, the revenue obtained is enough to cover the operational costs, but the same is not true for the other costs, that include the alternative ones. Only variable and depreciation costs are covered.
The production of dry conilon coffee at the productivity levels of 35 and 45 bags/ha provides enough revenue to cover all the costs involved in the enterprise. Which means that the revenue obtained is sufficient to remunerate the costs with inputs, labor, depreciation and alternative costs. In such cases, the producer can get a higher return than other investment alternatives Figure 5. Economic viability indicators for irrigated conilon coffee investment.
Source: Elaborated by the authors.
100 bags/ha
120 bags/ha 80 bags/ha
Deducted Payback (years) 4 5 7 TIR (%) -0,19 VPL (R$ 1.000) 12 15 60 bags/ha 45 bags/ha 5,8 9,8 20,9 32,4 45,0 6,23 29,45 58,37 90,21
available in the market.
The production of irrigated conilon coffee at the level of 45 bags/ha was economically unfeasible, since the income obtained in the 15 years of production was not enough to recover the investment, coming close to the cost.
For the irrigated conilon production at the levels of 60, 80, 100 and 120 bags/ha, the revenue obtained covers all production costs, including the alternative ones. The results indicate that producers who can produce at these levels of productivity can obtain supernormal profits, that is, higher than other investment alternatives available in the market.
Economically, the agricultural activity studied has great potential for return. However, it is important to highlight that traditional production is unprofitable. The increase in productivity and consequent better economic returns should be sought using technological innovation and specialized technical assistance. Incaper has contributed to conilon coffee grower achieve high productivity and the sector has shown potential for development. The trend, therefore, is to expand production with the productivity increase.
However, considering that coffee growers are inserted in a competitive segment, being therefore price takers, the result of their productive activity depends on how the production resources are managed and allocated, given the price conditions. In this sense, the resources and production methods used in the crops should be very well economically evaluated, as they will have a great influence on the enterprise profitability.
6 REFERENCES
BLISKA, F. M. M.; VEGRO, C. L. R.; AFONSO JR. P. C.; MOURÃO, E. A.B; CARDOSO, C. H. S. Custos de
produção de café nas principais regiões produtoras do Brasil. Informações Econômicas, São Paulo, v. 39,
n. 9, set 2009. Disponível em: <http://ainfo.cnptia.embrapa.br/digital/bitstream/item/29266/1/Custos-de-producao.pdf>. Acesso em: 10 maio 2015.
CALLADO, A. A. C.; CALLADO, A. L. C. Gestão de custos no agronegócio. In: CALLADO, A. A. C.
Agronegócio. 4. ed. São Paulo: Atlas, 2015. 232 p.
CÓ, S. M. Custo de produção do café Conilon na região de Ibiraçu, Espírito Santo. 2003. 22 f. Monografia (Especialização em Administração Rural) – Universidade Federal de Lavras, Lavras, MG, 2003.
CONAB. Companhia Nacional de Abastecimento. Custos de produção agrícola: a metodologia da
Conab. Brasília: Conab, 2010. 60 p. Disponível em: <http://www.conab.gov.br/OlalaCMS/uploads/ arquivos/0086a569bafb14cebf87bd111936e115..pdf>. Acesso em: 10 maio 2015.
CONAB. Companhia Nacional de Abastecimento. Séries Históricas. Disponível em: <http://www.conab.gov.
br/conteudos. php?a=1252&t=> Acesso em: 04 fev. 2015.
CREPALSI, S. A. Contabilidade rural: uma abordagem decisorial. 7. ed. São Paulo: Atlas, 2012. 432 p. FASSIO, L. H.; CÓ, S. M.; FERRÃO, R. G.; OLIVEIRA, C. B.; PERINI, J. L.; BASSANI, L. A. VERDIN FILHO, A. C.; MAZZO, G. L. Coeficientes técnicos e custos de produção do café conilon no Espírito Santo. In: FERRÃO, R. G.; FONSECA, A. F. A. da; BRAGANÇA, S. M.; FERRÃO, M. A. G.; De MUNER, L. H. Café Conilon. Vitória, ES: Incaper, 2007, 702 p.
LIMA, A. L. R.; REIS, R. P.; ANDRADE, F. T.; CASTRO JR, L. G. FARIA, J. M. Custos de produção: o impacto da produtividade nos resultados da cafeicultura nas principais regiões produtivas do Brasil. In: CONGRESSO BRASILEIRO DE ECONOMIA, ADMINISTRAÇÃO E SOCIOLOGIA RURAL. Anais... Rio Branco, AC: 20 a 23 de julho, 2008.
MARCOMINI, G. R. Aspectos economico-financeiros da produção de café convencional e de café especial. Revista Científica da FHO-UNIARARAS, v. 1, n. 1, 2013.
NASSER, M. D.; TARSITANO, M. A. A.; LACERDA, M. D.; KOGA, P. S. L. Análise econômica da produção de café Arábica em São Sebastião do Paraíso, Estado de Minas Gerais. Informações Econômicas, SP, v. 42, n. 2, mar./abr. 2012.
OLIVEIRA, L. B.; CONCEIÇÃO JÚNIOR, V.; PONTE, C. M. A., OLIVEIRA, L. B. Custo de produção da
cafeicultura em agricultura familiar no distrito da Limeira-BA: um estudo de caso. In: VIII SIMPÓSIO DE PESQUISA DOS CAFÉS DO BRASIL, 8o, Salvador, BA. 2013. Anais... Bahia, 2013.
OLIVEIRA, S. J. M.; ARAÚJO, T. G. Custo de produção em diferentes sistemas de produção de café em Rondônia no segundo semestre de 2011. Comunicado Técnico. Porto Velho, set. 2012.
PEZZOPANE, J. R.; CASTRO, F. S.; PEZZOPANE, J. E. M.; SARAIVA, G. S.; BONOMO, R. Caracterização do atendimento hídrico para o café conilon no estado do Espírito Santo. In: VI SIMPÓSIO DE PESQUISA DE CAFÉS DO BRASIL. 6o, Vitória, 2009. Anais....Vitória, 2009.
PINDYCK, R. S.; RUBINFELD, D. L.Microeconomia. 8. ed. São Paulo: Prentice Hall, 2014. 768 p.
REIS, R. P. Fundamentos de economia aplicada. Lavras: UFLA/FAEPE, 2007. 95 p.
SANTOS, G. J.; SEGATTI, S.; MARION, J. C. Administração de custos na agropecuária. 4. ed. São Paulo: Atlas, 2009. 168 p.
SARCINELLI, O.; RODRIGUES, E. O. Análise do desempenho econômico e ambiental de diferentes modelos de cafeicultura em São Paulo-Brasil: estudo de caso na região cafeeira da Média Mogiana do Estado de São Paulo. Revista Ibero Americana Ecológica. v.5, p.13-26, 2006.
SILVA, A. L. da; FARIA, M. A. de; REIS, R. P. Viabilidade técnico-econômica do uso do sistema de irrigação por gotejamento na cultura do cafeeiro. Revista Brasileira de Engenharia Agrícola e Ambiental. Campina Grande: v. 7, n. 1, p. 37-44, 2003.
SILVA, J. S.; MORELI, A. P.; SOARES, S. F.; DONZELES, S. M. L.; VITOR, D. G. Produção de café cereja descascado – equipamentos e custo de processamento. Comunicado técnico. Brasília, set., 2013. TEIXEIRA, S. M.; CAIXETA, G. Z. T.; DONZELE, M. L. Viabilidade econômica da cafeicultura da agricultura familiar na zona da mata de Minas Gerais. In: CONGRESSO DA SOCIEDADE BRASILEIRA DE ECONOMIA, ADMINISTRAÇÃO E SOCIOLOGIA RURAL, 46, Rio Branco, AC. 2008. Anais... Rio Branco: SOBER, 2008. TEIXEIRA, M. M.; DAHER, F. A.; BREGONCI, I.S.; REIS, E. F.; RODRIGUES, R. R. Recomendação técnica para implantação e manejo de sistema de irrigação para a cafeicultura de conilon no estado do Espírito Santo. Vitória, 2012. Disponível em: <http://www.cetcaf.com.br/manejo%20irrigacao/APOSTILA%20 IRRIG_CONILON_RECOMENDACAO.pdf>. Acesso em: 13 maio 2015.
7 APPENDICES
APPENDIX A. Technical coefficients and operations for the implantation and maintenance of 1 ha of conilon coffee, with yield
of 25 bags/ha, planting density of 2,000 plants/ha and non irrigated production system
(to be continued)
Specifications Unity 1st year 2nd year 3rd year 4th year 5th year
1- Inputs and equipment
Seedlings (1) mil 2.2 Limestone (2) t 1.2 1 1 Mineral fertilizer (3) - Nitrogen - N kg 55 135 216 216 216 - Phosphorus- P2O5 kg 78 46 53 53 53 - Potassium - K2O kg 42 150 198 198 198 Organic matter (4) t
Tanned coffee straw m3 20 20
Formicide kg 4 2 2 2 2 Phytosanitary control (5) - Herbicide l 3 3 3 3 3 - Acaricide l 1 1 - Adhesive spreaders l 0.5 0.5 Plastic bags(6) ud 15 30 30 30 Farmyard implantation (16) m2 33 Barn (16 bag/m2) m2 1.56 Jute bags ud 10 25 25 25 Soil analysis ud 1 1 1 Sun/wind protection UD 2,000 2- Services Area cleaning (7) - Mechanical h/tr 6 - - - -- Manual d/h 15 - - -
-Marking and holes d/h 3 - - -
-Hole/Grooves (8)
- Manual (usual) d/h 20 - - -
-- Semi--mechanical d/h 4 - - -
-Mechanic Subsoiler h/tr 4 - - -
-Mechanical (b) Hydraulic Excavator h/tr 7 - - -
-Internal transport of limestone and fertilizers d/h 1 - - -
-Liming (9)
- Mechanical h/tr 2 - - -
-- Manual d/h 1.5 - - -
-Limestone, fertilizers application and mix in
the hole d/h 6 - - -
-Seedlings selection d/h 0.4 - - -
-Internal transport of seedlings (10)
- Mechanical h/tr 0.5 - - -
-- Manual d/h 2 - - -
-Distribution and planting of seedlings d/h 5 - - -
-Replanting d/h 0.5 - - -
-Cover Fertilization d/h 2 2 2 2 2
(conclusion)
Specifications Unity 1st year 2nd year 3rd year 4th year 5th year
Bagging and distribution of coffee straw d/h 3 3
Manual weeding in bands d/h 13 8 4 4 4
Hoeing (11) - Manual d/h 6 6 5 4 4 - Coastal mechanical d/h 3 3 2 2 2 - Mechanical h/tr 3 3 1.5 1.5 1.5 Herbicide application (12) d/h 3 2 2 2 2 Phytosanitary treatment d/h 1 1 Pruning (13) d/h 3 7 7 9 Pinching (14) d/h 1 4 5 7 7 Harvesting (15) sacos 40 100 100 100 Drying in farmyards d/h 1 1.5 1.5 1.5
Dryer: transport, drying and processing (17) sacas 1 2.5 2.5 2.5
Internal transport d/h 0.5 0.5 0.5 0.5
Transportation and processing of ground
coffee dried on farmyards (18) sacas 0.2 0.5 0.5 0.5
Bagging and weighting d/h 0.3 0.5 0.5 0.5
Storage d/h 0.15 0.3 0.3 0.3
1- Seedlings Costs: includes the seedlings freight to the property. 2- It was considered the application of one tonne of limestone per hectare, plus 100 g/hole in the first year. 3- Minimum values to be considered by producers. 4- 10 liters of tanned coffee straw were considered per hole. 5- Phytosanitary products: the average amount used for each crop in the main producing regions was considered. 6- It was considered that the bags are reused three times in the same harvest. 7- The manual process was considered for this level of productivity. 8- The manual process was considered for this level of productivity as usual: 1d/ h = 100 holes for manual; 1 d/ h = 500 semi-mechanized holes; 1 h/ t = 2,000 tractor cranes with subsoiler and 1 h/ t = 1,000 hydraulic excavator cranes. 9- The manual process was considered for this level of productivity. 10- The manual process was considered for this level of productivity. 11- The manual process was considered for this level of productivity. 12- Two applications of herbicide/ year were considered; 2 hoeing/ year and a manual weeding in strip for under production crops. 13- Traditional pruning management was considered for this level of productivity. 14- Two pinching were considered per year. 15- The rate of four ripe bags to a processed one was considered. The cost of labor for harvesting is paid per ripe bag harvested, which varies by region and crop yield. 16- In the years implementation, it was not considered in the calculation of the production cost, as well as the services for drying in the yard, internal transportation, transportation and processing of the coffee dried in the yard (16) and bagging and weighting. 17- 10% of the processed production for a drying, more than 18 hours of length were considered. 18- 2% of the processed production are considered.
APPENDIX B. Technical coefficients and operations for the implantation and maintenance of 1 ha of conilon coffee, with yield
of 35 bags/ha, planting density of 2,000 plants/ha and non irrigated production system
(to be continued)
Specifications Unity 1st year 2nd year 3rd year 4th years 5th year
1- Inputs Seedlings (1) mil 2.2 Limestone (2) t 1.3 1 1 Mineral fertilizer (3) - Nitrogen - N kg 65 233 267 267 267 - Phosphorus - P2O5 kg 78 51 57 57 57 - Potassium - K2O kg 65 208 240 240 240 Organic matter (4) t
Tanned coffee straw m3 20 20
Formicide kg 4 2 2 2 1 Phytosanitary control (5) - Herbicide l 3 3 3 3 3 - Acaricide l 1 1 1.5 1.5 1.5 - Insecticide l 1.5 1.5 1.5 1.5 - Fungicide l 1 1 1 1 - Adhesive spreaders l 0.5 0.6 0.6 0.6 0.6 Plastic bags(6) ud 25 42 42 42 Jute bags ud 20 35 35 35 Farmyard implantation (17) m2 47 Barn (16 bags/m²) m2 2.18 Soil analysis ud 1 1 1 Sun/wind protection UD 2,000 2- Services Area cleaning (7) - Mechanical h/tr 6 - - - -- Manual d/h 15 - - -
-Marking and furrows d/h 3 - - -
-Hole/furrows(8)
- Manual (usual) d/h 20 - - -
-- Semi--mechanical d/h 4 - - -
-- Mechanical (a) subsoiler h/tr 4 - - -
-- Mechanical (b) Hydraulic Excavator h/tr 7 - - -
-Internal transport of limestone and fertilizers d/h 1 - - -
-Liming (9)
- Mechanical h/tr 2 - - -
-- Manual d/h 1.5 - - -
-Limestone, fertilizers application and mix in
the hole d/h 6 - - -
-Seedlings selection d/h 0.4 - - -
-Internal transport of seedlings (10)
- Mechanical h/tr 0.5 - - -
-- Manual d/h 2 - - -
-Distribution and planting of seedlings d/h 5 - - -
-Replanting d/h 0.5 - - -
-Cover Fertilization d/h 2 2 2 2 2
Limestone application to cover d/h 1.5 1.5
Bagging and distribution of coffee grounds d/h 3 3
(conclusion)
Specifications Unity 1st year 2nd year 3rd year 4th years 5th year
Hoeing (11) - Manual d/h 6 5 3 3 3 - Coastal mechanical d/h 3 3 2 2 2 - Mechanical h/tr 2 2 1.5 1.5 1.5 Herbicide application (12) d/h - Manual d/h 3 2 2 2 2 - Mechanical h/tr 2 2 1.5 1.5 1.5 Phytosanitary treatment (13) d/h - Manual d/h 2 3 3 3 3 - Coastal mechanical d/h 1 2 2 2 2 - Mechanical h/tr 0.5 1 1 1 1 Pruning (14) d/h 3 7 7 9 Pinching (15) d/h 1 4 6 10 12 Harvesting (16) bags 60 140 140 140 Drying on farmyards d/h 1.5 2 2 2
Dryer: transport, drying and processing (18) bags 15 35 35 35
Internal transport d/h 0.5 0.8 0.8 0.8
Transportation and processing of ground
coffee dried on farmyards (19) bags 0.3 0.7 0.7 0.7
Bagging and weighting d/h 0.3 0.7 0.7 0.7
Storage h/tr 0.15 0.4 0.4 0.4
1- Seedlings Costs: includes the seedlings freight to the property. 2- It was considered the application of one tonne of limestone per hectare, plus 100 g/hole in the first year. 3- Values based on the manual of fertilization and liming and the average levels in soils of the State of Espírito Santo for nutrition calculations: Phosphorus rem. 35, OM 1.5, Normal phosphorus 6.0, Potassium 50. 4- 10 liters of tanned coffee straw were considered. 5- Phytosanitary products: the average amount used for each crop in the main producing regions was considered. 6- It was considered that the bags are reused three times in the same harvest. 7- The manual process was considered for this level of productivity. 8- The manual process was considered for this level of productivity as usual: 1d/ h = 100 holes for manual; 1 d/ h = 500 holes semi-mechanized; 1 h/ t = 2,000 holes for tractor cranes with subsoiler and 1 h / t = 1,000 holes for hydraulic excavator cranes. 9- The manual process was considered for this level of productivity. 10- The manual process was considered for this level of productivity. 11- The manual process was considered for this level of productivity. Two applications of herbicide/ year were considered; two hoeings/ year and a manual weeding in strip for production in the field. 12- The manual process was considered for this level of productivity. 13- The manual process was considered for this level of productivity. In the production field, it was considered: Fungicide- 1 applications / leaf year; Insecticide- one application / leaf year; Acaricide- one application/ year. 14- Traditional pruning management was considered for this level of productivity. 15- Two pinching were considered per year. 16- The rate of four ripe bags to a processed one was considered. The cost of labor for harvesting is paid for ripe bag harvested, which varies by region and crop yield. 17- Farmyard implantation was not considered in the calculation of the production cost, as well as the services for drying in farmyard, internal transport, transportation and processing of the coffee dried in farmyard (16) and bagging and weighting.
APPENDIX C. Technical coefficients and operations for the implantation and maintenance of 1 ha conilon coffee, with yield of
45 bags/ha, planting density of 2,300 plants/ha and non irrigated production system
(to be continued)
Specifications Unity 1st year 2nd year 3rd year 4th years 5th year
1- Inputs Seedlings (1) mil 2.53 Limestone (2) t 2.5 1.5 1.5 Mineral fertilizer (3) - Nitrogen - N kg 80 233 289 289 289 - Phosphorus - P2O5 kg 90 51 61 61 61 - Potassium - K2O kg 80 208 262 262 262 Micronutrient kg 46 46 46 Organic matter (4) t
Tanned coffee straw m3 23 23
Formicide kg 4 2 2 2 2 Phytosanitary control (5) l - Herbicide l 3 3 3 3 3 - Acaricide l 1 1 1.5 1.5 1.5 - Insecticide l 0.5 1.5 1.5 1.5 1.5 - Fungicide l 0.5 1 1 1 1 Spreader Sticker l 0.5 0.6 0.6 0.6 0.6 Plastic bags(6) ud 34 60 60 60 Jute bags ud 25 45 45 45 Farmyard implantation (17) m2 60 barn (16 bags/m2) m2 2.8 Soil analysis ud 1 1 1 Sun/wind protection UD 2,300 2- Services Area cleaning (7) - Mechanical h/tr 6 - Manual d/h 15 Marking holes d/h 3 Hole/furrows(8) - Manual d/h 26 - Semi-mechanical d/h 4.5
- Mechanical (a) subsoiler h/tr 4
- Mechanical (b) Hydraulic Excavator h/tr 7
Internal transport of limestone and fertilizers d/h 1.5
Liming (9)
- Mechanical h/tr 2.5
- Manual d/h 2
Limestone, fertilizers application and mix in
the hole d/h 7
Seedlings selection d/h 0.5
Internal transport of seedlings (10)
- Mechanical h/tr 0.5
- Manual d/h 2
Distribution and planting of seedlings d/h 6
Replanting d/h 0.6
Cover Fertilization d/h 4 3 3 3 3
Limestone application on cover d/h 1.5 1.5
(conclusion)
Specifications Unity 1st year 2nd year 3rd year 4th years 5th year
Manual weeding in bands d/h 13 6 0 0 4
Hoeing (11) - Manual d/h 6 5 4 3 3 - Coastal mechanical d/h 3 3 2 2 2 - Mechanical h/tr 2 2 1.5 1.5 1.5 Herbicide application (12) d/h - Manual d/h 3 2 2 2 2 - Mechanical h/tr 2 2 1.5 1.5 1.5 Phytosanitary treatment (13) d/h - Manual d/h 2 3 3 3 3 - Coastal mechanical d/h 1 2 2 2 2 - Mechanical h/tr 0.5 1 1 1 1 Pruning (14) d/h 3 5 5 7 Pinching (15) d/h 1 5 8 12 14 Harvesting (16) bags 100 180 180 180 Drying on farmyards d/h 2 2.5 2.5 2.5
Dryer: transport, drying and processing (18) bags 27 45 45 45
Internal transport d/h 0.8 1 1 1
Transportation and processing of ground
coffee dried on farmyards (19) bags 0.6 0.9 0.9 0.9
Bagging and weighting d/h 0.8 1 1 1
Storage d/h 0.4 0.6 0.6 0.6
1- Seedlings Costs: includes the seedlings freight to the property. 2- The application of 2.3 tonnes of limestone per hectare plus 100g/pit in the first year was considered. 3- Values based on the fertilization and liming manual and the average contents in the soils of the State of ES For nutritional calculations: Phosphorus rem. 35, OM 1.5, normal Phosphorus 6.0, Potassium 50. 4- 10 liters of tanned coffee straw were considered. 5- Phytosanitary products: the average amount used for each crop in the main producing regions was considered. 6- It was considered that the bags are reused three times in the same harvest. 7- The manual process was considered for this productivity level. 8- The manual process was considered usual for this productivity level 1 d/h = 100 holes for manual; 1 d/h = 500 semi-mechanized holes; 1 h/t = 2,000 holes for tractor with subsoiler and 1 h/t = 1,000 holes for hydraulic excavator. 9- The manual process was considered for this productivity level. 10- The manual process was considered for this productivity level. 11- The manual process was considered for this productivity level. Two applications of herbicide/year; two hoeings/year and a manual weeding in bands for production in the field were considered. 12- The manual process was considered for this productivity level. 13- The manual process was considered for this productivity level. It was considered in production crop: Fungicide- one application/ leaf year; Insecticide- one application/leaf year; Acaricide- one application/year. 14- Programmed cycle pruning (PCP) was considered.
15- It considers two pinching in the second, third and fourth years and three pinching in the fifth year. 16- The ratio of four ripe bags to one processed bag was considered. The labor cost for harvesting is paid for ripe bag harvested, which varies according to the region and crop yield. 17- Farmyard implantation was not included in the production cost calculation, as well as services for drying on the farmyard, internal transport, transportation and processing of the coffee dried on the yard (16) and bagging and weighting. 18- 10% of the processed production for a drying of more than 18 hours length were considered. 19- 2% of the processed production were considered.
APPENDIX D. Technical coefficients and operations for implantation and maintenance of 1 ha of conilon coffee, with
productivity of 45 bags/ha, planting density of 2,300 plants/ha and irrigated production system
(to be continued)
Specifications Unity 1st year 2nd year 3rd year 4th years 5th year
1- Inputs Seedlings (1) mil 2.53 Limestone (2) t 2.5 1.5 1.5 Mineral fertilizer (3) - Nitrogen - N kg 80 233 289 289 289 - Phosphorus - P2O5 kg 90 51 61 61 61 - Potassium K2O kg 80 208 262 262 262 Micronutrient kg 46 46 46 Organic matter (4) t
Tanned coffee straw m3 23 23
Formicide kg 4 2 2 2 2 Phytosanitary control (5) - Herbicide l 4.5 4.5 3 3 3 - Acaricide l 1 1 1.5 1.5 1.5 - Insecticide l 0.5 1.5 1.5 1.5 1.5 - Fungicide l 0.5 1 1 1 1 - Adhesive spreaders l 0.5 0.6 0.6 0.6 0.6
Implantation cost of irrigation system (6)
- Located Dripping Irrigation un 0
- Localized Micro Spray Irrigation un 0
- Fixed Sprinkler Irrigation un 1
Electricity: - Dripping Kwh 250 300 385 385 385 - Micro Spray Kwh 290 350 435 435 435 - Fixed Aspersion Kwh 350 425 600 600 600 Plastic bags(7) ud 34 60 60 60 Jute bags ud 25 45 45 45 Farmyard implantation (18) m2 60 Barn (16 bags/m2) m2 2.8 Soil analysis ud 1 1 1 Sun/wind protection ud 2,300 2- Services Area cleaning (8) - Mechanical h/tr 6 - Manual d/h 15
Marking and holes d/h 3
Hole/Grooves (9)
- Manual d/h 26
- Semi-mechanical d/h 4.5
- Mechanical (a) subsoiler h/tr 4
- Mechanical (b) Hydraulic Excavator h/tr 7
Internal transport of limestone and fertilizers d/h 1.5
Liming (10)
- Mechanical h/tr 2.5
- Manual d/h 2
Limestone, fertilizers application and mix in the
hole d/h 7