HAL Id: hal-01223539
https://hal.archives-ouvertes.fr/hal-01223539
Submitted on 2 Nov 2015
HAL is a multi-disciplinary open access archive for the deposit and dissemination of sci-entific research documents, whether they are pub-lished or not. The documents may come from teaching and research institutions in France or abroad, or from public or private research centers.
L’archive ouverte pluridisciplinaire HAL, est destinée au dépôt et à la diffusion de documents scientifiques de niveau recherche, publiés ou non, émanant des établissements d’enseignement et de recherche français ou étrangers, des laboratoires publics ou privés.
determining grain yield and protein concentration for
wheat as influenced by climate and crop management
Pierre Martres, Jianqiang He, Jacques Le Gouis, Mikhail A. Semenov
To cite this version:
Pierre Martres, Jianqiang He, Jacques Le Gouis, Mikhail A. Semenov. [i]In silico[/i] system analysis of physiological traits determining grain yield and protein concentration for wheat as influenced by climate and crop management. Journal of Experimental Botany, Oxford University Press (OUP), 2015, 66 (12), pp.3581-3598. �10.1093/jxb/erv049�. �hal-01223539�
This paper is available online free of all access charges (see http://jxb.oxfordjournals.org/open_access.html for further details)
RESEARCH PAPER
In silico system analysis of physiological traits determining
grain yield and protein concentration for wheat as influenced
by climate and crop management
Pierre Martre1,2,*,†,‡, Jianqiang He1,2,†,§, Jacques Le Gouis1,2 and Mikhail A. Semenov3
1 INRA, UMR1095 Genetic, Diversity and Ecophysiology of Cereals, 5 chemin de Beaulieu, Clermont-Ferrand F-63100, France 2 Blaise Pascal University, UMR1095 Genetic, Diversity and Ecophysiology of Cereals, Aubière F-63177, France
3 Department of Computational and Systems Biology, Rothamsted Research, Harpenden, Herts AL5 2JQ, UK
* To whom correspondence should be addressed. E-mail: pierre.martre@clermont.inra.fr
† These authors contributed equally to this work.
‡ Present address: INRA, UMR759 Laboratoire d’Ecophysiologie des Plantes sous Stress Environnementaux, Place Viala, F-34060
Montpellier, France.
§ Present address: College of Water Resources and Architectural Engineering, Northwest A&F University, Yangling, Shaanxi, 712100,
China.
Received 17 November 2014; Revised 19 January 2015; Accepted 21 January 2015
Abstract
Genetic improvement of grain yield (GY) and grain protein concentration (GPC) is impeded by large genotype×environment×management interactions and by compensatory effects between traits. Here global uncertainty and sensitivity analyses of the process-based wheat model SiriusQuality2 were conducted with the aim of identifying candidate traits to increase GY and GPC. Three contrasted European sites were selected and simulations were performed using long-term weather data and two nitrogen (N) treatments in order to quantify the effect of parameter uncertainty on GY and GPC under variable environments. The overall influence of all 75 plant parameters of SiriusQuality2 was first ana-lysed using the Morris method. Forty-one influential parameters were identified and their individual (first-order) and total effects on the model outputs were investigated using the extended Fourier amplitude sensitivity test. The overall effect of the parameters was dominated by their interactions with other parameters. Under high N supply, a few influential param-eters with respect to GY were identified (e.g. radiation use efficiency, potential duration of grain filling, and phyllochron). However, under low N, >10 parameters showed similar effects on GY and GPC. All parameters had opposite effects on GY and GPC, but leaf and stem N storage capacity appeared as good candidate traits to change the intercept of the negative relationship between GY and GPC. This study provides a system analysis of traits determining GY and GPC under variable environments and delivers valuable information to prioritize model development and experimental work.
Key words: Crop growth model, genetic adaptation, grain protein concentration, grain yield, interannual variability, sensitivity analysis, yield stability, wheat (Triticum aestivum L.).
Introduction
It has been estimated that in order to ensure food security, crop grain yields (GYs) should be increased globally by 70–100% within the next 40 years (Bruinsma, 2009). This
means that the past relative rate of world GY increase, esti-mated at 0.5–1.7% for the major crops (Cassman, 2001; Tilman et al., 2002; Ewert et al., 2005), needs to be increased
This is an Open Access article distributed under the terms of the Creative Commons Attribution License (http://creativecommons.org/licenses/by/3.0/), which permits unrestricted reuse, distribution, and reproduction in any medium, provided the original work is properly cited.
© The Author 2015. Published by Oxford University Press on behalf of the Society for Experimental Biology.
Abbreviations: AV, Avignon; CF, Clermont-Ferrand; DM, dry mass; E-FAST, extended Fourier amplitude sensitivity test; FTSW, fraction of transpirable soil water; GPC, grain protein concentration; GPD, grain protein deviation; GY, grain yield; HN, high nitrogen; LN, low nitrogen; RUE, radiation use efficiency; RR, Rothamsted; SLN, specific leaf nitrogen.
at INRA Institut National de la Recherche Agronomique on November 2, 2015
http://jxb.oxfordjournals.org/
by ~40% (Tester and Langridge, 2010). However, in contrast to past GY increases, future GY improvements will have to be achieved in the context of global warming and with reduction of the use of water and fertilizers, because of environmental issues (Tilman, 1999; Godfray et al., 2010). At the same time, grain protein concentration (GPC) will have to be maintained at its current level, since grain proteins are the major source of dietary proteins for humans, especially in developing countries, and since the economic value of most grain crops greatly depends on their GPC (Shewry, 2007). Maintaining GPC while increasing GY represents another challenge for plant breeders because of the commonly observed negative correlation between GY and GPC (e.g. Cooper et al., 2001; Oury et al., 2003; Aguirrezábal et al., 2014).
Genetic improvements of GY and GPC are also impeded by their low heritability and by large genotype×environment×management interactions (Cooper
et al., 2001; Zheng et al., 2009). Considerable efforts have
been made to identify environmentally stable and genetically heritable traits and processes related to GY that can be used to guide crop breeding programmes, but only a few successful cases have been reported where identified traits or processes have led to genetic improvements of GY (Sinclair et al., 2004; Yin and Struik, 2008; Passioura, 2010). The reasons lie in the many compensatory effects between traits (e.g. grain size versus grain number, light-saturated photosynthesis versus leaf surface area) and in the fact that complex traits such as GY and GPC are inherently determined at the canopy (com-munity) level. Moreover improvements at the organ or plant level are often not translated at the canopy level (e.g. leaf level photosynthesis versus canopy radiation use efficiency; Long
et al., 2006). Therefore, quantitative analyses of the ‘trait
hierarchy’ leading to GY and GPC improvements are needed (Sinclair et al., 2004; Martre et al., 2014a).
The use of virtual crops represented by a simulation model has been proposed to help molecular biologists, physiologists, and breeders to identify relevant traits and processes and to analyse their genetic determinism (e.g. Tardieu, 2003; Hammer
et al., 2006; Messina et al., 2009; Bertin et al., 2010). Crop
simu-lation models can help develop hypotheses starting near the top of the ‘trait hierarchy’ leading to GY in the target environments (Sinclair et al., 2004). Before addressing the question of how to translate the information of model simulations into knowledge that can be used by physiologists or geneticists, it is appropri-ate to have a better understanding of the model properties and behaviour. One of the best ways to do that is to conduct a global uncertainty and sensitivity analyses of the model to investigate the behaviour of the model in response to variations in model inputs (Cariboni et al., 2007). By perturbing model parameters associated with simple physiological traits, uncertainty and sen-sitivity analyses allow investigation of crop responses and can help in identifying those traits that lead to a consistent high and stable GY or GPC in the target environments.
Most sensitivity analyses of crop simulation models have been performed in localized regions of the parameters’ space by varying one input parameter at a time, keeping the oth-ers at their nominal values, (Asseng et al., 2002; Ruget et al., 2002; Semenov et al., 2009; Sinclair et al., 2010). This simple
approach does not take into account interactions between input parameters (i.e. their context dependency) and non-linear responses. Powerful numerical and statistical methods and tools for global model uncertainty and sensitivity analysis have been developed (Saltelli et al., 2000), but until recently they have been overlooked by crop modellers and users. In the few studies where global sensitivity methods have been used to analyse crop simulation models, only a selected number of parameters, usually <20% of the total number, thought to be the most influential ones, were studied (Makowski et al., 2006; Pathak et al., 2007; Confalonieri, 2010; Confalonieri et al., 2010a; Richter et al., 2010). Moreover, with the exception of the study of Confalonieri et al. (2010b), the uncertainty asso-ciated with climate (site) and weather (year) variability was not considered. Consideration of all the input parameters of a model and their interactions as well as variations of envi-ronments (e.g. soil characteristics and climate) and crop man-agement [e.g. nitrogen (N) fertilizer application] is required for a robust model evaluation.
Here, the results of a global uncertainty and sensitivity analysis of SiriusQuality2, a process-based model of wheat growth, conducted at three contrasted European sites using long- term weather data and two N treatments, are reported. The results show that GY and GPC are influenced by sev-eral traits and processes, and that the ranking of the traits depended on both the environment and N supply. The high level of parameter interactions indicated that the expression of the effect of a trait at the crop level also depends on the value of the other traits.
Materials and methods
The wheat simulation model SiriusQuality2
The wheat simulation model SiriusQuality2 (
http://www1.cler-mont.inra.fr/siriusquality/) used in this study is a revised version
of SiriusQuality1 (Martre et al., 2006) and Sirius (Jamieson et al.,
1998b; Jamieson and Semenov, 2000). SiriusQuality2 has been
cali-brated and evaluated for several modern wheat cultivars and tested in many environments and climates, including conditions of climate change, and crop management scenarios (Martre et al., 2006, 2014b;
Ferrise et al., 2010; Asseng et al., 2013, 2014).
SiriusQuality2 is a process-based model consisting of eight sub-models that describe on a daily time step crop phenology (Phenology submodel), canopy development (Leaf Layer Expansion submodel), accumulation and partitioning of dry mass (DM; Light Interception and Use Efficiency and DM Allocation submodels), and N (N Allocation, and Root Growth and N Uptake submodels), including responses to shortage in the supply of soil water (Soil Drought sub-model) and N (dealt with in the N Allocation subsub-model), and accu-mulation and partitioning of grain DM and N (Grain submodel). Two additional submodels describe crop evapotranspiration and soil N and water balances (Addiscott and Whitmore, 1991; Jamieson et al., 1998b). The parameters of these two submodels were not investigated in this study, since they are related to soil properties and physical constants.
The Phenology submodel calculates the duration of six develop-ment phases, comprising pre-emergence (sowing to emergence), leaf production (emergence to flag leaf ligule appearance), flag leaf lig-ule appearance to anthesis, anthesis to the beginning of grain fill, effective grain filling, and maturation (Jamieson et al., 1998a). The anthesis date is mainly determined by the rate of leaf production (1/ phyllochron) and the final leaf number. The final leaf number is cal-culated by daylength (photoperiod) and temperature (vernalization)
at INRA Institut National de la Recherche Agronomique on November 2, 2015
http://jxb.oxfordjournals.org/
response subroutines (Brooking et al., 1995; Jamieson et al., 1998a;
He et al., 2012). Canopy development is simulated in the Leaf Layer
Expansion submodel as a series of leaf layers associated with indi-vidual stems (Fournier et al., 2005; Lawless et al., 2005).
The Light Interception and Use Efficiency submodel calculates the amount of light intercepted by each leaf layer using the turbid medium approach (Monsi and Saeki, 2005) and uses it to produce biomass at an efficiency [radiation use efficiency (RUE)] calculated from temperature, air CO2 concentration, soil water deficit, leaf N
mass per unit surface area (specific leaf N, SLN), and the ratio of diffuse to direct radiation (Jamieson et al., 2000). The total above-ground biomass at any time is the sum of the daily rate of biomass accumulation of each leaf layer, which, in turn, is the product of RUE and intercepted photosynthetically active radiation by the leaf layers (Monteith, 1977). The canopy light extinction coefficient (KL)
is assumed to be independent of N and water shortages (Robertson
and Giunta, 1994). Part of the biomass produced each day is
allo-cated to the stem so that a target constant specific DM of the leaf laminae (SLWp) and sheath (SSWp) is maintained. After the end of
the endosperm cell division period, all new biomass plus a constant proportion of the labile leaf and stem biomass at the end of the endosperm cell division phase are allocated to grains.
Crop N uptake is driven by canopy expansion. The vertical dis-tribution of leaf N follows the light disdis-tribution (Bertheloot et al.,
2008b), and the ratio of N to light extinction coefficients is
deter-mined by the crop N status (Moreau et al., 2012). As for the biomass, any N not allocated to the leaves is allocated to the stem if its N concentration is less than its maximum. After anthesis, the capacity of the root system to take up N from the soil decreases linearly with thermal time (Martre et al., 2006). After the end of the endosperm cell division stage, the rate of N transfer to grains is determined by the stem and leaf N concentrations, and follows first-order kinetics
(Bertheloot et al., 2008a, b).
Seventy-five parameters are used to parameterize the processes described above (Table 1), which were subjected to the uncertainty and sensitivity analyses described below.
Simulation set-up
Two French sites, Avignon (AV) and Clermont-Ferrand (CF), and one UK site, Rothamsted (RR), were selected for this study (Table 2). The characteristics of the soil used at the three sites are summarized
in Table 3. The soil water-holding characteristics at CF and RR were
similar to that previously reported for these two sites (Jamieson et al.,
1998b; Martre et al., 2006), while at AV parameters corresponding to
a sandy soil were used to ensure water-limited conditions for most years. Simulations were conducted with historical weather data of 40 continuous years (1970–2009) at each site. Recommended sowing dates were used at each site (Table 2). The sowing density was 250 seeds m–2 at the three sites. Soil N characteristics (organic and
inor-ganic N content) were the same at all sites (Table 3).
Two N treatments were considered at each site, a high N treat-ment [HN, 20 g (N) m–2] corresponding to the commercial N rate in
the investigated environments with a late N application to optimize GPC, and a low N treatment [LN, 4 g (N) m–2] corresponding to 20%
of HN. For HN, N fertilizer was applied as four split dressings at the growth stages GS21 [4 g (N) m–2], GS31 [8 g (N) m–2], GS37 [6 g (N)
m–2], and GS65 [2 g (N) m–2] described by the Zadoks scale (Zadoks
et al., 1974). For LN, N fertilizer was applied once at GS30. An irrigation of 10 mm was applied at sowing to ensure good crop emer-gence conditions, and 5 mm irrigations were applied on the dates of N applications to ensure dissolution of N fertilizer in the soil solu-tion. This limited amount of water did not have any other effect on crop development or growth.
Morris screening analysis
The 75 plant parameters of SiriusQuality2 were first analysed using the one-at-a-time (OAT) Morris method (Morris, 1991) to rank
them in order of importance and to identify parameters involved in interactions with other parameters or parameters whose effect are non-linear.
The Morris method is based on individually randomized OAT experiments, in which the impact of varying each of the chosen parameters is evaluated in turn. In this method, each vector of parameters is first discretized into p levels corresponding to the quan-tiles of the parameter distribution and defining a k-dimensional and p-level region of experiment in the parameter space, where k is the number of parameters (Saltelli et al., 2004). The sampling strategy proposed by Campolongo et al. (2007) was used, where r elementary effects are sampled to construct r trajectories of (k+1) points in the region of the experiment, each providing k elementary effects, one per input parameter. The number of model executions is thus equal to r×(k+1). Here, p was set to 8, and 760 vectors of parameters cor-responding to 10 trajectories were generated using the uncertainty and sensitivity analysis software SimLab version 2.2 (Saltelli et al., 2004). The parameters were assumed to be uniformly distributed in [0, 1] and then rescaled from the unit hypercube to their actual val-ues using the following equation:
Xim X ( ( ) ) i d i min i max i min = × ∆ + ∆ −∆ × P (1)
where Xim and Xid are the modified and default values of the
parameter xi, respectively; ∆mini and ∆maxi are the minimum and
maximum fractional variations of the parameter xi, respectively;
and P is a random number following a uniform distribution in [0, 1]. The space of each parameter was set to be ±20% of its default value, which encompass the observed range of genetic variation for most of the parameters (Martre et al., 2007).
After running SiriusQuality2 for each of the parameter sets under each of the site–N treatment–year combinations, the model outputs were post-processed using SimLab. For each parameter, two sensitiv-ity indices were obtained from the distribution of their elementary effects. The first is the mean of the distribution of the absolute val-ues of the elementary effects (μ*), which estimates the overall impor-tance of the parameter on the model outputs (Campolongo et al., 2007). The second is the standard deviation of the distribution of elementary effects (σ), which indicates either a parameter interact-ing with other parameters or a parameter whose effect is non-linear. In order to plot heat maps of μ* and σ, they were rescaled in [0, 1] since different output variables may have different magnitudes of μ* and σ. For each site–N treatment–output variable combination, the median of μ* and σ over the 40 years of simulation was first calcu-lated and then rescaled using the formula:
z z z z z i, j r i, j i, jmin i, j max i, j min = − − (2)
where zi, jr , zi, jmin, and zi, jmax are the rescaled, minimum and
maxi-mum values of μ* or σ for the ith parameter and jth output variable, respectively.
The sign of μ* was retrieved by conducting an independent OAT experiment. Each parameter was changed in turn by ±50% of its default value in 10% increments. Then for each parameter–site–N treatment combination, the slopes of the linear regression between the model outputs and the parameters were calculated and the sign of the slopes was given to the rescaled μ*. This provided useful information of the sign of the elementary effects, but it should be treated with caution since it might be significantly overestimated in the case of non-monotonic elementary effect distribution. For instance, a parameter with a large and negative μ* value should be considered as very significant, but the sign of the effect might be negative or positive depending on the position of the parameter input space where it is sampled, and its overall effect is therefore not necessarily negative. However, in a complex model such as
at INRA Institut National de la Recherche Agronomique on November 2, 2015
http://jxb.oxfordjournals.org/
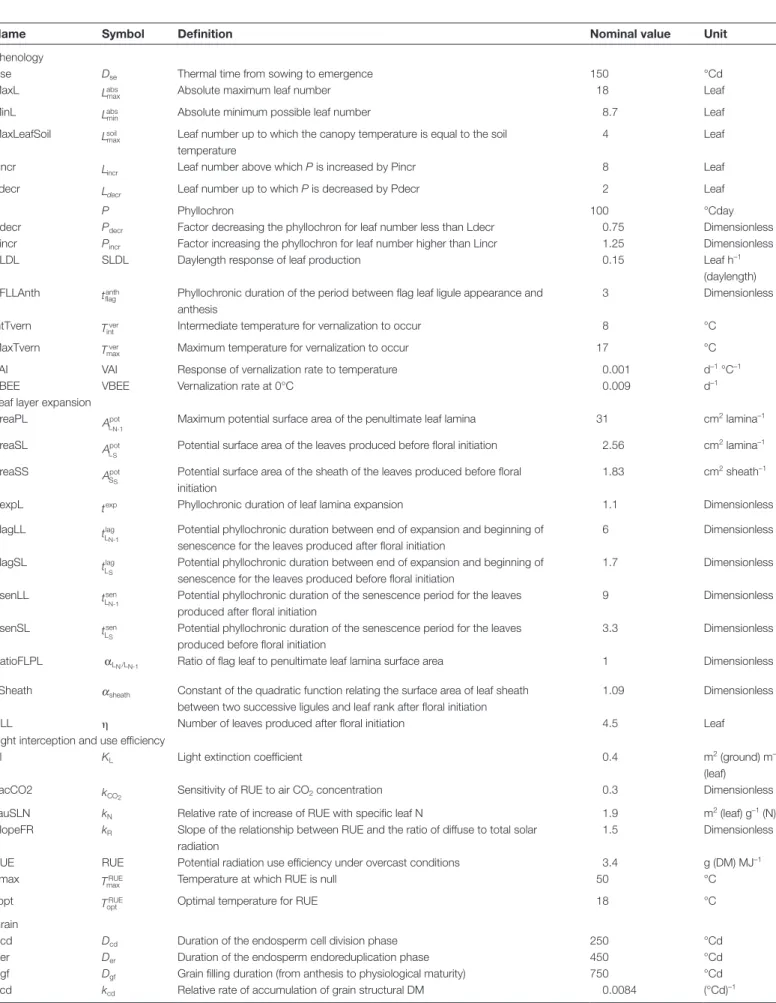
Table 1. Name, symbol, definition, nominal value, and unit of the 75 parameters of the wheat simulation model SiriusQuality2
All of the parameters belong to eight submodels of Phenology, Leaf layer expansion, Light interception and use efficiency, Grain, DM allocation, N allocation, Root growth and N uptake, and Soil drought factors.
Name Symbol Definition Nominal value Unit
Phenology
Dse Dse Thermal time from sowing to emergence 150 °Cd
MaxL Lmaxabs Absolute maximum leaf number 18 Leaf
MinL Lminabs Absolute minimum possible leaf number 8.7 Leaf
MaxLeafSoil Lmaxsoil Leaf number up to which the canopy temperature is equal to the soil
temperature
4 Leaf
Lincr Lincr Leaf number above which P is increased by Pincr 8 Leaf
Ldecr Ldecr Leaf number up to which P is decreased by Pdecr 2 Leaf
P P Phyllochron 100 °Cday
Pdecr Pdecr Factor decreasing the phyllochron for leaf number less than Ldecr 0.75 Dimensionless
Pincr Pincr Factor increasing the phyllochron for leaf number higher than Lincr 1.25 Dimensionless
SLDL SLDL Daylength response of leaf production 0.15 Leaf h–1
(daylength)
PFLLAnth tflaganth Phyllochronic duration of the period between flag leaf ligule appearance and
anthesis
3 Dimensionless
IntTvern Tintver Intermediate temperature for vernalization to occur 8 °C
MaxTvern Tmaxver Maximum temperature for vernalization to occur 17 °C
VAI VAI Response of vernalization rate to temperature 0.001 d–1 °C–1
VBEE VBEE Vernalization rate at 0°C 0.009 d–1
Leaf layer expansion
AreaPL A
LpotN-1
Maximum potential surface area of the penultimate leaf lamina 31 cm2 lamina–1
AreaSL A
LpotS Potential surface area of the leaves produced before floral initiation 2.56 cm
2 lamina–1
AreaSS A
SpotS
Potential surface area of the sheath of the leaves produced before floral initiation
1.83 cm2 sheath–1
PexpL texp Phyllochronic duration of leaf lamina expansion 1.1 Dimensionless
PlagLL t
L lag
N-1 Potential phyllochronic duration between end of expansion and beginning of
senescence for the leaves produced after floral initiation
6 Dimensionless
PlagSL t
L lag
S Potential phyllochronic duration between end of expansion and beginning of
senescence for the leaves produced before floral initiation
1.7 Dimensionless
PsenLL tLsen
N-1 Potential phyllochronic duration of the senescence period for the leaves
produced after floral initiation
9 Dimensionless
PsenSL tLsen
S Potential phyllochronic duration of the senescence period for the leaves
produced before floral initiation
3.3 Dimensionless
RatioFLPL αL /LN N-1 Ratio of flag leaf to penultimate leaf lamina surface area 1 Dimensionless
aSheath αsheath Constant of the quadratic function relating the surface area of leaf sheath
between two successive ligules and leaf rank after floral initiation
1.09 Dimensionless
NLL η Number of leaves produced after floral initiation 4.5 Leaf
Light interception and use efficiency
Kl KL Light extinction coefficient 0.4 m2 (ground) m–2
(leaf)
FacCO2 kCO2 Sensitivity of RUE to air CO2 concentration 0.3 Dimensionless
TauSLN kN Relative rate of increase of RUE with specific leaf N 1.9 m2 (leaf) g–1 (N)
SlopeFR kR Slope of the relationship between RUE and the ratio of diffuse to total solar
radiation
1.5 Dimensionless
RUE RUE Potential radiation use efficiency under overcast conditions 3.4 g (DM) MJ–1
Tmax TmaxRUE Temperature at which RUE is null 50 °C
Topt ToptRUE Optimal temperature for RUE 18 °C
Grain
Dcd Dcd Duration of the endosperm cell division phase 250 °Cd
Der Der Duration of the endosperm endoreduplication phase 450 °Cd
Dgf Dgf Grain filling duration (from anthesis to physiological maturity) 750 °Cd
Kcd kcd Relative rate of accumulation of grain structural DM 0.0084 (°Cd)–1
at INRA Institut National de la Recherche Agronomique on November 2, 2015
http://jxb.oxfordjournals.org/
Name Symbol Definition Nominal value Unit
AlphaNC αN/C Grain structural N to C ratio 0.02 Dimensionless
EarGR σ Ratio of grain number to ear dry matter at anthesis 100 Grain g–1 (DM)
DM allocation
Deg Deg Fraction of PFLLAnth for ear growth before anthesis (counted from flag leaf
ligule appearance)
0.25 Dimensionless
SLWp SLWp Potential specific lamina DM 45 g (DM) m–2
SSWp SSWp Potential specific sheath DM 90 g (DM) m–2
FracLaminaBGR γlaminae Fraction of anthesis laminae DM allocated to the grain 0.25 Dimensionless
FracSheathBGR γsheath Fraction of anthesis sheath DM allocated to the grain 0.25 Dimensionless
FracStemWSC γwsc Fraction of anthesis stem DM in the water-soluble carbohydrate pool 0.1 Dimensionless
FracBEAR μ Fraction of biomass allocated to the ear during the ear growth period 0.5 Dimensionless
N allocation
LLOSS LLOSS Fraction of leaf N resorption resulting in a reduction of LAI 0.6 m2 (leaf) m–2
(ground)
CritSLN NcriLA Critical area-based N content for leaf expansion 1.5 g (N) m–2 (leaf)
MaxSLN NmaxLA Maximum potential specific leaf N of the top leaf layer 2.2 g (N) m–2 (leaf)
MinSLN NminLA Specific leaf N at which RUE is null 0.35 g (N) m–2 (leaf)
StrucLeafN NstruLM Structural N concentration of the leaves 0.006 g (N) g –1 (DM)
MaxStemN NmaxSM Maximum potential stem N concentration 0.0075 m (N) g–1 (DM)
StrucStemN NstruSM Structural N concentration of the true stem 0.005 g (N) g –1 (DM)
AlphaKn αKN Scaling coefficient of the relationship between the ratio of N to light extinction
coefficients and the N nutrition index
3.82 m2 (ground) m–2
(leaf)
AlphaSSN αNLAN
ShA
/ Scaling coefficient of the allometric relationship between area-based lamina
and sheath N mass
0.9 g (N) m–2
AlphaNNI αNNI Scaling coefficient of the N dilution curve 5.35 102 × g (N) g–1
(DM)
BetaKn βKN Scaling exponent of the relationship between the ratio of N to light extinction
coefficients and the N nutrition index
2.063 Dimensionless
BetaSSN βNLAN
ShA
/ Scaling exponent of the relationship between area-based lamina and sheath
N mass
1.37 Dimensionless
BetaNNI βNNI Scaling exponent of the N dilution curve 0.442 Dimensionless
MaxLeafRRND χleaf Maximum relative rate of leaf N depletion 0.004 (°Cd)–1
MaxStemRRND χstem Maximum relative rate of stem N depletion 0.004 (°Cd)–1
Root growth and N uptake
DMmaxNuptake CmaxNuptake Crop DM at which the potential rate of root N uptake equals MaxNuptake 100 g (DM) m–2
MaxRWU Kmax Maximum relative rate of root water uptake from the top soil layer 0.1 d–1
MaxNuptake N
potuptake Maximum potential rate of root N uptake 0.5 g (N) m –2
(ground) d–1
RVER RVER Rate of root vertical extension 0.001 m (°Cd)–1
BetaRWU λ Efficiency of the root system to extract water through the vertical soil profile 0.07 Dimensionless
Soil drought factors
MaxDSF DSFmax Maximum rate of acceleration of leaf senescence in response to soil water deficit 3.25 Dimensionless
LowerFTSWexp W
lowerexp Fraction of transpirable soil water for which the rate of leaf expansion equals zero 0.25 Dimensionless
LowerFTSWgs W
lowergs Fraction of transpirable soil water for which the stomatal conductance equals
zero
0.1 Dimensionless
LowerFTSWrue WlowerRUE Fraction of transpirable soil water for which RUE equals zero 0 Dimensionless
LowerFTSWsen Wlowersen Fraction of transpirable soil water value for which DSFmax is reached 0.1 Dimensionless
UpperFTSWexp Wupperexp Fraction of transpirable soil water threshold for which the rate of leaf expansion
starts to decrease
0.65 Dimensionless
UpperFTSWgs Wuppergs Fraction of transpirable soil water threshold for which the stomatal
conductance starts to decrease
0.5 Dimensionless
UpperFTSWrue WupperRUE Fraction of transpirable soil water threshold for which RUE starts to decrease 0.3 Dimensionless
UpperFTSWsen Wuppersen Fraction of transpirable soil water threshold for which the rate of leaf
senescence starts to accelerate
0.5 Dimensionless
Table 1. Continued
at INRA Institut National de la Recherche Agronomique on November 2, 2015
http://jxb.oxfordjournals.org/
Table 2.
Summar
y of the location and climate of the three sites used in this study
Climatic data ar
e median values for the 1970–2009 period at A
vignon (A
V), Clermont-Ferrand (CF), and Rothamsted (RR); values in squar
e brackets ar
e 0.75 and 0.25 quantiles. Cr
op
emergence, anthesis, and physiological maturity dates wer
e pr
edicted using the wheat simulation model
SiriusQuality 2. Site Longitude (°) Latitude (°) Elevation (m a.s.l.) Sowing date Anthesis date Emergence to anthesis
Anthesis to physiological maturity
Mean daily temperatur
e (°C)
Cumulated solar radiation [MJ (DM) m
–2]
Cumulated precipitation (mm) Mean daily temperatur
e
(°C)
Cumulated solar radiation [MJ (DM) m
–2] Cumulated precipitation (mm) AV 4.85 43.91 24 15 Nov .
11 May [6 May–15 May]
9.0 [8.5–9.4] 1744 [1647–1828] 255 [223–326] 19.1 [18.7–20.0] 1160 [1098–1213] 73 [45–109] CF 3.10 45.80 329 01 Nov .
26 May [19 May–1 Jun]
7.1 [6.6–7.7] 1699 [1556–1778] 271 [175–294] 17.9 [17.2–18.6] 1080 [1003–1160] 91 [77–144] RR –0.35 51.80 128 10 Oct.
11 Jun. [5 Jun.–18 Jun.]
6.4 [6.1–6.8] 1622 [1500–1755] 446 [406–481] 15.4 [14.6–16.0] 1001 [948–1087] 110 [76–150] Table 3. Summar
y of the soil characteristics at the three sites, A
vignon (A
V), Clermont-Ferrand (CF), and Rothamsted (RR), used in this study
Site Maximum r oot depth (m) N mineralization constant (×10 5 d –1)
Top soil organic N [g (N) m
–2]
Root zone inorganic N [g (N) m
–2] Per colation coef ficient (dimensionless)
Soil textural class (USDA system)
Soil moistur e characteristics [m 3 (H 2 O) m –3 (soil)] A vailable soil water content [mm (H 2 O)] Saturation Field capacity Permanent wilting point
AV 1 2 1 000 4 0.7 Sandy 0.38 0.15 0.70 80 CF 1 2 1 000 4 0.4 Sandy loam 0.43 0.24 0.90 150 RR 1 2 1 000 4 0.3 Loam 0.47 0.33 0.14 190
at INRA Institut National de la Recherche Agronomique on November 2, 2015
http://jxb.oxfordjournals.org/
SiriusQuality2, non-monotonic elementary effect distributions are infrequent (Saltelli et al., 2008).
Extended Fourier amplitude sensitivity test
The influential parameters identified by the Morris method were further analysed using the quantitative extended Fourier amplitude sensitivity test (E-FAST; Saltelli et al., 1999). As for the Morris anal-ysis, the space of each parameter was set to be ±20% of its default value assuming a uniform distribution. The k input parameters were coded so that their domain of variation was [0, 1]k. A total of 29 889
parameter vectors were generated using SimLab (i.e. 729 different positions in the input space were considered for each parameter), which is much higher than the minimum number of 2665 required by the E-FAST method with the number of parameters consid-ered in this study. The generated random values of the parameters were then rescaled to their actual values using Equation 1, and SiriusQuality2 was run for all the site–N treatment–year combina-tions, resulting in 7.17 × 10⁶ model runs from which the Fourrier
spectrum was calculated in SimLab on the different model outputs to estimate the first-order (Si) and total (STi) effect of each of the 41
influential parameters for each site–N treatment combination.
Results
Grain yield and protein concentration uncertainty and environment by N interactions
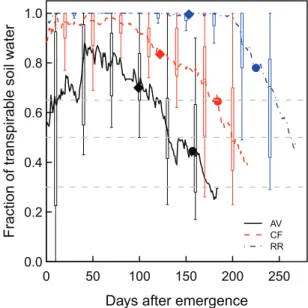
The three sites used for this study differed in terms of their climate (Table 2; Supplementary Fig. S1 available at JXB online) and soil (Table 3). AV has a Mediterranean climate with warm and dry summers and mild wet winters. CF has a Continental climate with hot summers and cold and rela-tively dry winters, while RR has an Oceanic climate with moderately cool summers and comparatively warm winters and evenly distributed precipitations. These sites are rep-resentative of the climate diversity of the wheat-growing regions in Europe. The site differences, as felt by the crops, are illustrated by the dynamics of the fraction of transpir-able soil water (FTSW) during the growing season (Fig. 1). AV was characterized by high probabilities of mild water deficits early in the season and during the stem extension period, and of severe water deficits during grain filling. At this site, for 25% of the years, simulated FTSW decreased below 0.65, the threshold value for reduction of leaf expan-sion (LowerFSTWexpanexpan-sion), after the beginning of stem extension, and for 55% of the years leaf senescence and sto-matal conductance were significantly accelerated by water deficit (i.e. FTSW <0.5) during the grain-filling period. Comparably, almost no water limitation occurred during the vegetative growth period at RR. At this site, mild water deficits occurred during the second half of grain filling for 55% of the years, and for most of the years it had no signifi-cant effect on GY and GPC (data not shown). The situation at CF was intermediate to that at the other two sites. This site was characterized by late water deficit. Although at a given site the patterns of FTSW among the simulated years were similar (data not shown), the levels of water deficits were very variable (as illustrated by the box plots in Fig. 1). For example, at AV, the 10% and 90% percentiles of FTSW at anthesis were 0.31 and 0.87, respectively.
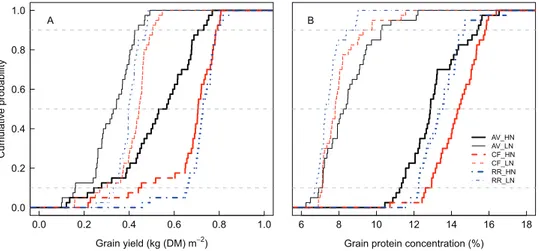
Simulated GY was significantly lower and more variable at AV than at the two other sites (Fig. 2A), especially under HN, where it ranged from 0.14 kg DM m–2 to 0.77 kg DM
m–2. Under HN, for most of the years, GY was similar at
RR and CF, but under LN on average it was 6% higher at CF than at RR. At the three sites, GY was more variable under HN than under LN. On average GY was 88% higher under HN than under LN. As for GY, GPC was more vari-able at AV (ranging from 6.2% to 12.2% under LN and from 10.5% to 16.5% under HN) than at the two other sites. As for GY, the model predicted significant site×N interactions for GPC (Fig. 2B). Although it is usually observed that GPC is higher under elevated temperature or water deficit because carbon assimilation is more affected by these environmental constraints than N assimilation (Triboi and Triboi-Blondel, 2002; Aguirrezábal et al., 2014), simulated GPC under HN was lower at AV than at the two other sites despite AV being a more stressful environment. This result can be explained by significant water deficit during the stem extension period at AV, which reduced the expansion of the canopy, and therefore limited N storage in vegetative tissues during the pre-anthesis period. Severe water deficits at this site also reduced soil N supply to the plant due to their negative effects on organic N mineralization. Under LN, GPC was higher at AV than at
0 50 100 150 200 250 0.0 0.2 0.4 0.6 0.8 1.0
Days after emergence
Fraction of transpira bl e soil wa ter ● ● ● AV CF RR
Fig. 1. Fraction of transpirable soil water (FTSW) versus days after
emergence at Avignon (AV; solid line), Clermont-Ferrand (CF; dashed line), and Rothamsted (RR; dash-dotted line) simulated with the wheat simulation model SiriusQuality2 under high N supply. Lines are median values for each site calculated for 40 years (1970–2009). Box plots show the interannual variability of FTSW calculated over the same period and plotted every 30 d (for the sake of clarity), the edges of the boxes represent the 25% and 75% percentiles, and the solid vertical bars the 10% and 90% percentiles. Filled diamonds and circles indicate the median of the beginning of stem extension (Zadoks stage GS31) and of the anthesis date (GS65), respectively. The horizontal dashed lines indicate the default values in SiriusQuality2 of the FTSW threshold for the responses of leaf expansion (UpperFTSWexp=0.65), leaf senescence and stomatal conductance (UpperFTSWgs and UpperFTSWsen=0.5), and biomass production (UpperFTSWrue=0.3). Simulations were performed using the default value of all the parameters (Table 1). (This figure is available in colour at JXB online.)
at INRA Institut National de la Recherche Agronomique on November 2, 2015
http://jxb.oxfordjournals.org/
the two other sites, because of the strong limitation of crop growth and N accumulation, independently of the climate. For both N treatments, CF had higher GPC than RR. This was expected since CF had a higher probability of water defi-cit and supraoptimal temperature during grain filling.
Screening of the model input parameters
The influence of all 75 parameters of the SiriusQuality2 model (Table 1) was first assessed using the Morris screen-ing method (Morris, 1991). The perturbation of the param-eters resulted in –14 d to +17 d differences in anthesis date (Supplementary Table S1 at JXB online). GY (–45% to +16%) and GPC (–20% to +35%) also showed large varia-tions in response to parameter variavaria-tions. The responses of eight key model outputs were analysed in detail. Grain pro-tein deviation (GPD), namely the residual from the regres-sion of GPC on GY, was also calculated (Monaghan et al., 2001). Several authors have used GPD to identify genotypes with higher GPC than would be expected from their GY (e.g. Monaghan et al., 2001; Oury and Godin, 2007; Bogard et al., 2010). For each site–N–year combination, GPD was calcu-lated by regressing GPC against GY for the 760 parameter combinations (‘genotypes’) generated in the Morris analy-sis. Under HN at AV the regression was significant in only 75% of the years and the median value of r2 was only 0.05
(Supplementary Table S2). For the other site–N combina-tions, the correlations were highly significant in >95% of the years, and the ranges and distributions of the slope [median value –15.6% kg–1 (DM) m2] and r2 (median value 0.53) were
in close agreement with that calculated from experimental data (e.g. Oury et al., 2003; Bogard et al., 2010).
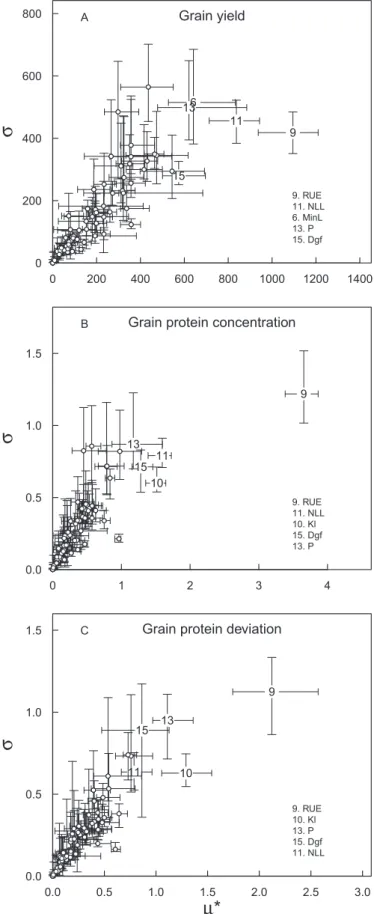
The ‘overall’ effect (μ*) and the non-linear and/or interac-tion effects (σ) of the parameters were well correlated for all model outputs, as illustrated in Fig. 3 for GY, GPC, and GPD at CF under LN. The influence of the parameters on the model outputs showed a high level of uncertainty associated
with the year, and at a given site the ranking of the param-eters depended strongly on the years.
The median values of the rescaled (see the Materials and methods) ‘overall’ effect (Fig. 4) and of the non-linear and/ or additive effects (Supplementary Fig. S2 at JXB online) are summarized on heat maps, which give a grand-view of parameter×site×N interactions. Anthesis date was most influenced, in order of importance, by the phyllochron (P) and the absolute minimum possible leaf number (MinL), the duration of the period between the appearance of the flag leaf ligule and anthesis (PFLLAnth), and the response of vernalization rate to temperature (VBEE; Fig. 4). Except for the maximum temperature for vernalization (MaxTvern), which had no significant overall effect on anthesis date, all the phenology parameters had significant overall and non-linear and/or interaction effects on canopy expansion and biomass and N accumulation, grain N yield, post-anthesis N uptake, and GPD (Fig. 4; Supplementary Fig. S2). As expected, the influence of the phenology parameters on anthesis date was independent of N supply; however, their effect on the other model outputs were highly dependent on N supply. In all site–N combinations, all the parameters associated with phe-nology had an effect of the same sign on anthesis date and crop DM at maturity, but of opposite sign on anthesis date and GY. In other words, early flowering crops had higher GY associated with higher DM accumulation after anthesis and DM harvest index. Three parameters associated with leaf layer expansion (AreaPL, NLL) and light interception (Kl) had some indirect effects on anthesis date due to non-linear-ity or interactions between parameters (Supplementary Fig. S2). This result could be explained by their effect on canopy temperature.
At CF and RR under HN, the green area index (GAI) at anthesis was essentially influenced in order of importance by the number (NLL) and the potential size (AreaPL and aSheath) of the leaves produced after floral initiation, and the potential ratio of the flag leaf to penultimate leaf size 0.0 0.2 0.4 0.6 0.8 1.0 0.0 0.2 0.4 0.6 0.8 1.0 Grain yield (kg (DM) m−2) Cumulati ve probabilit y A 6 8 10 12 14 16 18
Grain protein concentration (%) AV_HN AV_LN CF_HN CF_LN RR_HN RR_LN B
Fig. 2. Cumulative probability distributions of simulated grain yield (A) and grain protein concentration (B) at Avignon (AV; solid lines), Clermont-Ferrand
(CF; dashed lines), and Rothamsted (RR; dash-dotted lines) under high (HN; thick lines) and low (LN; thin lines) N supply simulated by the wheat simulation model SiriusQuality2 for 40 years (1970–2009). The y-axis refers to the probability that simulated yield (A) or grain protein concentration (B) is lower than a certain threshold yield or grain protein concentration, respectively (indicated by the x-axis). Simulations were performed using the default value of all the parameters (Table 1). The horizontal dashed lines are 10, 50 (median), and 90% percentiles. (This figure is available in colour at JXB online.)
at INRA Institut National de la Recherche Agronomique on November 2, 2015
http://jxb.oxfordjournals.org/
(RatioFLPL). Under these growing conditions, the potential phyllochronic duration between the end of expansion and the beginning of senescence of the leaves produced after floral initiation had some non-linear and/or interaction effects on GAI (Supplementary Fig. S2 at JXB online). Under dry con-ditions and non-limiting N supply NLL, P, AreaPL, MinL, and the FTSW threshold for the response of leaf expansion to water deficit (LowerFSTWexp) were the most influential parameters (in order of importance) for GAI at anthesis (Fig. 4; Supplementary Fig. S2). For most of the model out-puts and parameters, the sensitivity indices were significantly higher under HN than under LN. The only significant excep-tions were GAI at anthesis and total crop DM at maturity which were more influenced by the parameter related to N allocation under LN than under HN. Under LN, canopy expansion was primarily determined by N supply; therefore, it was most influenced by the N requirement of growing leaf tissues (CritSLN). It was also significantly influenced by RUE and Kl.
At all site–N combinations, RUE had the highest influence on GY. Under HN, at CF and RR the potential duration of grain filling (Dgf) was the second most influential parameter. In contrast, at AV, Dgf had no significant overall effect on GY. At the three sites under LN, the phyllochron was the second most influential parameter with respect to GY. At CF and RR, the potential number of culm leaves (NLL) had a sig-nificant overall effect on GY under both N treatments, while the potential size of the culm leaves (AreaPL) and Kl had significant overall effects on GY only under HN. NLL and GY were negatively related under all site–N combinations. At RR under LN, the relative rate of accumulation of grain structural DM during the endosperm cell division period (Kcd) and the duration of the endosperm cell division period (Dcd) were significantly associated with GY uncertainty. The parameters determining the response of RUE to the ratio of diffuse to direct light (SlopeFR), leaf N (TauSLN), temper-ature (Tmax and Topt), and water deficit (LowerFTSWrue and UpperFTSWrue) had much less effect on GY than the parameters mentioned above. At AV, the response of leaf senescence to water deficit (LowerFTSWsen and MaxDSF) and the capacity of the crop to extract soil water (MaxRWU) had a high overall effect on GY, especially under HN. None of the parameters associated with DM or N partitioning had a significant effect on GY.
As regards GY, at all site–N combinations, RUE was the parameter influencing GPC the most. The effect of the other parameters on GPC depended on both the site and the N sup-ply (Fig. 3). The phyllochron was the second most important parameter for GPC at AV (under both N), while at the two other sites it was the potential duration of grain filling (Dgf) under HN and the number of culm leaves (NLL) under LN. At all site–N combinations, Kl and Dgf were among the five most influential parameters. Under HN at the three sites, the N storage capacity of the leaves (MaxSLN) and NLL had the strongest overall positive effect on GPD. This was obtained despite a negative effect of these two parameters on post-flowering N uptake. Under LN, RUE had a strong nega-tive effect on GPD. Kl also had significant overall neganega-tive
0 200 400 600 800 1000 1200 1400 0 200 400 600 800 ● ● ● ● ● ● ● ● ● ● ● ● ● ● ● ● ● ● ● ● ● ●● ● ● ● ● ● ● ● ● ● ● ● ● ● ● ● ● ● ● ● ● ● ● ●● ● ● ● ● ● ● ● ● ● ● ● ● ● ● ● ● ● ● ● ● ●● ● ● ● ● ● ● ● ● ● ● ● ● ● ● ● ● ● ● ● ● ● ● ● ●● ● ● ● ● ● ● ● ● ● ● ● ● ● ● ● ● ● ● ● ● ● ● ●● ● ● ● ● ● ● ● ● ● ● ● ● ● ● ● ● ● ● ● ● ●● ● ● 9 11 6 13 15 9. RUE 11. NLL 6. MinL 13. P 15. Dgf Grain yield
σ
A 0 1 2 3 4 0.0 0.5 1.0 1.5 ● ● ● ● ● ● ● ● ● ● ● ● ● ● ● ● ● ● ● ● ● ● ● ● ● ● ● ● ● ● ● ● ● ● ● ● ● ● ●● ● ● ● ● ● ● ● ●● ● ● ● ● ● ● ● ● ● ● ● ● ● ● ● ● ● ● ●●● ● ● ● ● ● ● ● ● ● ● ● ● ● ● ● ● ● ● ● ● ● ● ● ● ● ● ● ● ● ● ● ● ● ● ● ● ● ● ● ●● ● ● ● ● ● ● ● ●● ● ● ● ● ● ● ● ● ● ● ● ● ● ● ● ● ● ● ●●● ● 9 11 10 15 13 9. RUE 11. NLL 10. Kl 15. Dgf 13. PGrain protein concentration
σ
B 0.0 0.5 1.0 1.5 2.0 2.5 3.0 0.0 0.5 1.0 1.5 ● ● ● ● ● ● ● ● ● ● ● ● ● ● ● ● ● ● ● ● ● ●●● ● ● ●● ● ●● ● ● ● ● ● ● ● ●● ● ● ● ● ● ● ● ● ● ● ● ● ● ● ● ● ●● ● ● ● ● ● ● ● ● ● ●●● ● ● ● ● ● ● ● ● ● ● ● ● ● ● ● ● ● ● ● ● ● ● ●●● ● ● ●● ● ●● ● ● ● ● ● ● ● ●● ● ● ● ● ● ● ● ● ● ● ● ● ● ● ● ● ●● ● ● ● ● ● ● ● ● ● ●●● ● 9 10 13 15 11 9. RUE 10. Kl 13. P 15. Dgf 11. NLLGrain protein deviation
σ
µ*
C
Fig. 3. Median of the standard deviation (σ) versus median of the
absolute mean (μ*) of the elementary effects for the 75 input parameters of the wheat simulation model SiriusQuality2 with respect to grain yield (A), grain protein concentration (B), and grain protein deviation (C) at Clermont-Ferrand under low N supply. The error bars are the 25% and 75% percentiles of σ and μ* for n=40 years, respectively. Only the five parameters with the highest μ* values are identified.
at INRA Institut National de la Recherche Agronomique on November 2, 2015
http://jxb.oxfordjournals.org/
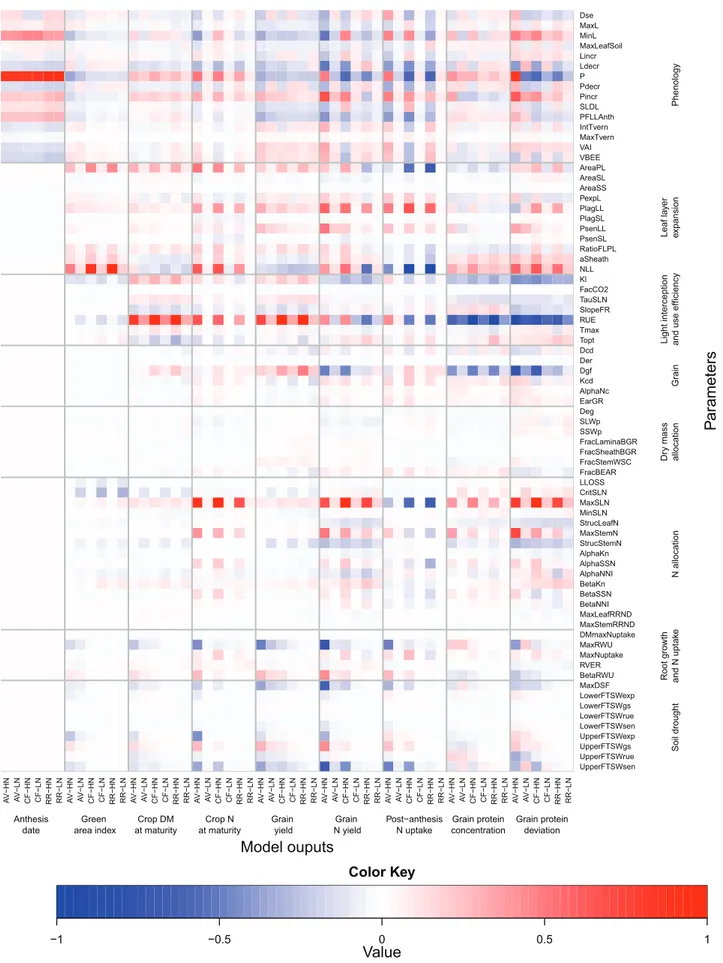
AV−HN AV−LN CF−HN CF−LN RR−HN RR−L N AV−HN AV−LN CF−HN CF−LN RR−HN RR−L N AV−HN AV−LN CF−HN CF−LN RR−HN RR−L N AV−HN AV−LN CF−HN CF−LN RR−HN RR−L N AV−HN AV−LN CF−HN CF−LN RR−HN RR−L N AV−HN AV−LN CF−HN CF−LN RR−HN RR−L N AV−HN AV−LN CF−HN CF−LN RR−HN RR−L N AV−HN AV−LN CF−HN CF−LN RR−HN RR−L N AV−HN AV−LN CF−HN CF−LN RR−HN RR−L N Model ouputs UpperFTSWsen UpperFTSWrue UpperFTSWgs UpperFTSWexp LowerFTSWsen LowerFTSWrue LowerFTSWgs LowerFTSWexp MaxDSF BetaRWU RVER MaxNuptake MaxRWU DMmaxNuptake MaxStemRRND MaxLeafRRND BetaNNI BetaSSN BetaKn AlphaNNI AlphaSSN AlphaKn StrucStemN MaxStemN StrucLeafN MinSLN MaxSLN CritSLN LLOSS FracBEAR FracStemWSC FracSheathBGR FracLaminaBGR SSWp SLWp Deg EarGR AlphaNc Kcd Dgf Der Dcd Topt Tmax RUE SlopeFR TauSLN FacCO2 Kl NLL aSheath RatioFLPL PsenSL PsenLL PlagSL PlagLL PexpL AreaSS AreaSL AreaPL VBEE VAI MaxTvern IntTvern PFLLAnth SLDL Pincr Pdecr P Ldecr Lincr MaxLeafSoil MinL MaxL Dse Pa rameters 1 5 . 0 0 5 . 0 − 1 − Value Color Key Soil drought Root gr ow th and N uptak eN allocation Dr y mass allocation Grain Light interceptio n
and use efficienc
y Leaf la ye r yg ol on eh P noi sn ap xe Anthesis
date area indexGreen at maturityCrop DM at maturityCrop N Grain yield N yieldGrain Post−anthesisN uptake concentrationGrain protein Grain proteindeviation
Fig. 4. Heat map of the median values of the mean of the distribution of the absolute elementary effect (μ*) from the Morris screening analysis of the 75 input
parameters of the wheat simulation model SiriusQuality2 on anthesis date, green area index, crop DM at maturity, crop N at maturity, grain DM at maturity, grain N at maturity, post-anthesis N uptake, grain protein concentration, and grain protein deviation. Simulations were performed at Avignon (AV), Clermont-Ferrand (CF), and Rothamsted (RR) under high (HN) and low N (LN) supplies for 40 years (1970–2009). The median of μ* was rescaled to [0, 1] across the sites and N treatments so for a given output they can be compared across the sites and N treatments. Negative values (blue colour) indicate that the parameter negatively influences the corresponding model output, and vice versa. The parameters were grouped according to the submodel to which they belong.
at INRA Institut National de la Recherche Agronomique on November 2, 2015
http://jxb.oxfordjournals.org/
effects on GPD at the three sites. All the parameters with a significant influence on GY or GPC had opposite effects on these two variables. However, the phyllochron, at the three sites and both N treatments, the parameters related to the response of leaf senescence to water deficit (UpperFTSWsen and MaxDSF), and the capacity of the crop to extract soil water (MaxRWU), at AV and to a lesser extent at CF, had an effect of the same sign on both GY and GPD.
Quantitative sensitivity analysis of the influential parameters
The Morris design is an efficient screening method to iden-tify influential model parameters. However, it does not allow quantification of the interactions between the model param-eters, and the Morris sensitivity indexes are only qualitative. Therefore, based on the Morris analysis, 41 influential param-eters were identified (Table 4) and their individual first-order (Si) and total (STi, first-order plus interactions of any order
with all the other parameters) effects were calculated using the E-FAST method (Saltelli et al., 1999).
Although the number of parameter combinations gener-ated in the E-FAST analysis was considerably higher than that generated in the Morris analysis, the range of varia-tions in anthesis date, GY, and GPC was similar for the two methods (Supplementary Table S3 at JXB online). In general, parameter ranking for the two methods was in good agree-ment (Supplementary Fig. S3). The major difference was that in the Morris method the phenology parameters had greater effects on DM and N accumulation, GPC, and GPD under HN than under LN, while the opposite was observed with the E-FAST method (Figs 4, 5).
The analysis of the results of the E-FAST method was focused on the most influential parameters. The parameters accounting for 90% of the sum of STi for GY, GPD, or GPC in
at least 50% of the years and for at least one site and N treat-ment were selected. For each site–N treattreat-ment–model output combination, 6–17 parameters were selected, representing a total of 32 different parameters. Averaged across years these 32 parameters accounted for 48–87% of Si for GY, GPC, and
GPD, while the interactions between all of the parameters
accounted for 8–56% of STi. For GY and GPC, the
contribu-tion of the interaccontribu-tions was 2-fold higher under LN (aver-aging 34%) than under HN (aver(aver-aging 16%; Supplementary Fig. S4 at JXB online). At the different sites and for both N treatments, RUE and Dgf accounted for 22–71% of the sum of Si with respect to GY, and GPC, except at AV where Dgf
had no significant first-order effect on GY (Supplementary Fig. S4). At AV, maxRWU contributed 12% and 8% of the sum of Si for GY under HN and LN, respectively. These
results suggest that there are a few very influential parameters and a large majority of non-influential parameters. However, since the interactions between the parameters accounted for a large part of the total variance, the relative contribution of the different parameters to the variance of the model outputs cannot be quantified only from their first-order effect.
The STi results showed that under HN the phenology
param-eters had much less influence on GY than estimated through the Morris screening analysis (Fig. 6A). At CF, GY was mainly influenced by the duration of the period between the appearance of the flag leaf ligule and anthesis (PFLLAnth), while at RR it was mainly influenced by the phyllochron. The ranking of the other parameters was similar to that observed in the screening analysis, and this quantitative analysis con-firmed the primary role of RUE in determining GY under HN. As shown by the screening analysis, under LN, GY was determined by a large number of parameters (14–17 depend-ing on the site) with equivalent effects (Fig. 6A). As for GY, the ranking of the parameters with respect to GPC and GPD was similar for the two methods (Fig. 6B, C). At AV under HN, the STi value of the three most influential parameters
(RUE, P, and MaxStemN) with respect to GPC and GPD showed a high dependency on the year, as indicated by the spread of the error bars.
Discussion
Crop simulation models based on physiologically sound mechanisms have the potential to accommodate the uncer-tainty associated with gene and environment context depend-encies (Campos et al., 2004; Sinclair et al., 2004; Cooper and
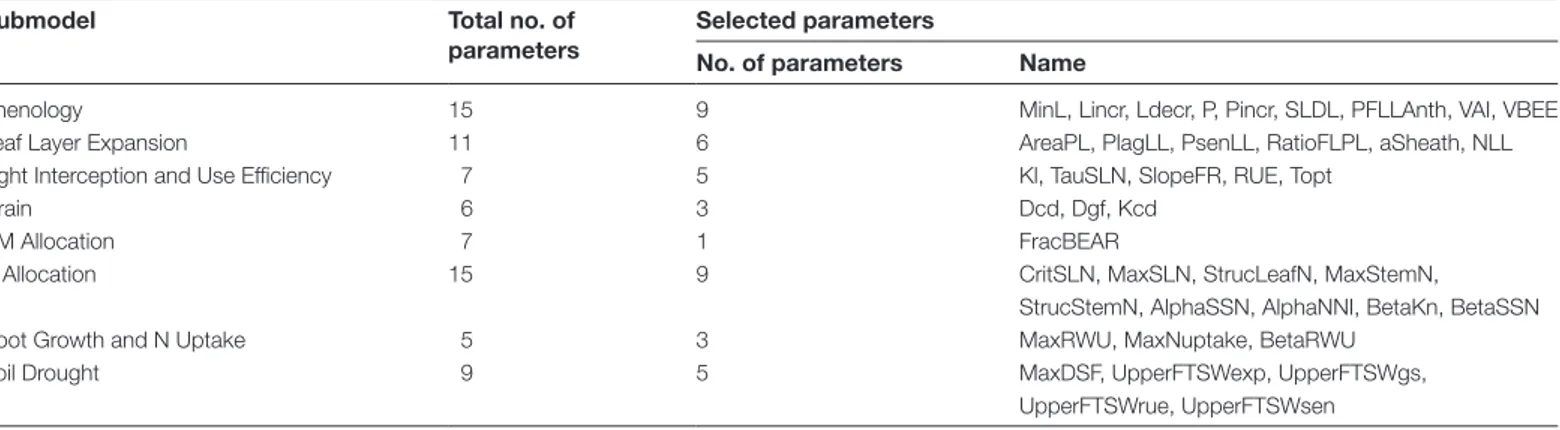
Table 4. Parameters of the wheat simulation model SiriusQuality2 selected through the Morris screening analysis for the E-FAST
analysis
Submodel Total no. of
parameters
Selected parameters
No. of parameters Name
Phenology 15 9 MinL, Lincr, Ldecr, P, Pincr, SLDL, PFLLAnth, VAI, VBEE
Leaf Layer Expansion 11 6 AreaPL, PlagLL, PsenLL, RatioFLPL, aSheath, NLL
Light Interception and Use Efficiency 7 5 Kl, TauSLN, SlopeFR, RUE, Topt
Grain 6 3 Dcd, Dgf, Kcd
DM Allocation 7 1 FracBEAR
N Allocation 15 9 CritSLN, MaxSLN, StrucLeafN, MaxStemN,
StrucStemN, AlphaSSN, AlphaNNI, BetaKn, BetaSSN
Root Growth and N Uptake 5 3 MaxRWU, MaxNuptake, BetaRWU
Soil Drought 9 5 MaxDSF, UpperFTSWexp, UpperFTSWgs,
UpperFTSWrue, UpperFTSWsen
at INRA Institut National de la Recherche Agronomique on November 2, 2015
http://jxb.oxfordjournals.org/
AV−HN AV−LN CF−HN CF−LN RR−HN RR−LN AV−HN AV−LN CF−HN CF−LN RR−HN RR−LN AV−HN AV−LN CF−HN CF−LN RR−HN RR−LN AV−HN AV−LN CF−HN CF−LN RR−HN RR−LN AV−HN AV−LN CF−HN CF−LN RR−HN RR−LN AV−HN AV−LN CF−HN CF−LN RR−HN RR−LN AV−HN AV−LN CF−HN CF−LN RR−HN RR−LN AV−HN AV−LN CF−HN CF−LN RR−HN RR−LN AV−HN AV−LN CF−HN CF−LN RR−HN RR−LN Model ouputs UpperFTSWsen UpperFTSWrue UpperFTSWgs UpperFTSWexp MaxDSF BetaRWU MaxNuptake MaxRWU BetaSSN BetaKn AlphaNNI AlphaSSN StrucStemN MaxStemN StrucLeafN MaxSLN CritSLN FracBEAR Kcd Dgf Dcd Topt RUE SlopeFR TauSLN Kl NLL aSheath RatioFLPL PsenLL PlagLL AreaPL VBEE VAI PFLLAnth SLDL Pincr P Ldecr Lincr MinL Pa rameters 6 . 0 4 . 0 2 . 0 Value Color Key Soil drought Root gro wth and N uptak eN allocation Dr y mass allocatio nG rain
Light interception and use efficiency
Leaf la ye r yg ol on eh P noi sn ap xe Anthesis
date area indexGreen at maturityCrop DM at maturityCrop N Grain yield N yieldGrain Post−anthesisN uptake concentrationGrain protein Grain proteindeviation
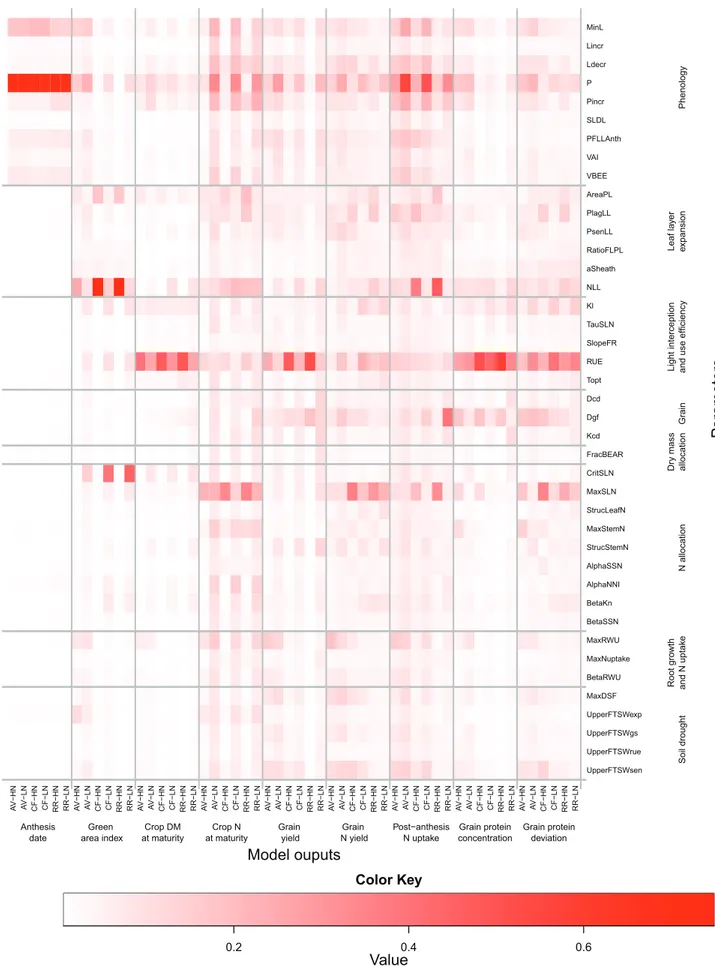
Fig. 5. Heat map of the median values of the E-FAST total sensitivity index (STi) for the 41 input parameters selected from the Morris screening analysis
of the wheat simulation model SiriusQuality2. STi on anthesis date, green area index, crop DM at maturity, crop N at maturity, grain DM at maturity,
grain N at maturity, post-anthesis N uptake, grain protein concentration, and grain protein deviation are shown. Simulations were performed at Avignon (AV), Clermont-Ferrand (CF), and Rothamsted (RR) under high (HN) and low N (LN) supply for 40 continuous years (1970–2009). The parameters were grouped according to the submodel to which they belong.
at INRA Institut National de la Recherche Agronomique on November 2, 2015
http://jxb.oxfordjournals.org/
● ● ● ● ● ● ● ● ● ● ● ● A MinL Ldecr PFLLAnth Pincr P AreaPL aSheath NLL PlagLL PsenLL Kl RUE SlopeFR TauSLN Topt Kcd Dgf Dcd FracBEAR AlphaNNI AlphaSSN BetaKn MaxStemN CritSLN MaxSLN StrucLeafN StrucStemN BetaRWU MaxRWU MaxDSF UpperFTSWsen UpperFTSWgs Phenology LLE LIUE Grain DMA NA RGNU SD High N Grain yield ● ● ● ● ● ● ● ● ● ● ● ● ● ● ● ● B Phenology LLE LIUE Grain DMA NA RGNU SD Low N Grain yield ● ● ● ● ● ● ● ● ● C MinL Ldecr PFLLAnth Pincr P AreaPL aSheath NLL PlagLL PsenLL Kl RUE SlopeFR TauSLN Topt Kcd Dgf Dcd FracBEAR AlphaNNI AlphaSSN BetaKn MaxStemN CritSLN MaxSLN StrucLeafN StrucStemN BetaRWU MaxRWU MaxDSF UpperFTSWsen UpperFTSWgs Phenology LLE LIUE Grain DMA NA RGNU SD
Grain protein concentration
● ● ● ● ● ● ● ● ● ● ● ● ● ● ● ● D Phenology LLE LIUE Grain DMA NA RGNU SD
Grain protein concentration
0.0 0.1 0.2 0.3 0.4 0.5 0.6 0.7 ● ● ● ● ● ● ● ● ● ● ● ● ● ● E MinL Ldecr PFLLAnth Pincr P AreaPL aSheath NLL PlagLL PsenLL Kl RUE SlopeFR TauSLN Topt Kcd Dgf Dcd FracBEAR AlphaNNI AlphaSSN BetaKn MaxStemN CritSLN MaxSLN StrucLeafN StrucStemN BetaRWU MaxRWU MaxDSF UpperFTSWsen UpperFTSWgs Phenology LLE LIUE Grain DMA NA RGNU SD
Grain protein deviation
Total sensitivity index
0.0 0.1 0.2 0.3 0.4 0.5 0.6 0.7 ● ● ● ● ● ● ● ● ● ● F Phenology LLE LIUE Grain DMA NA RGNU SD
Grain protein deviation
Total sensitivity index
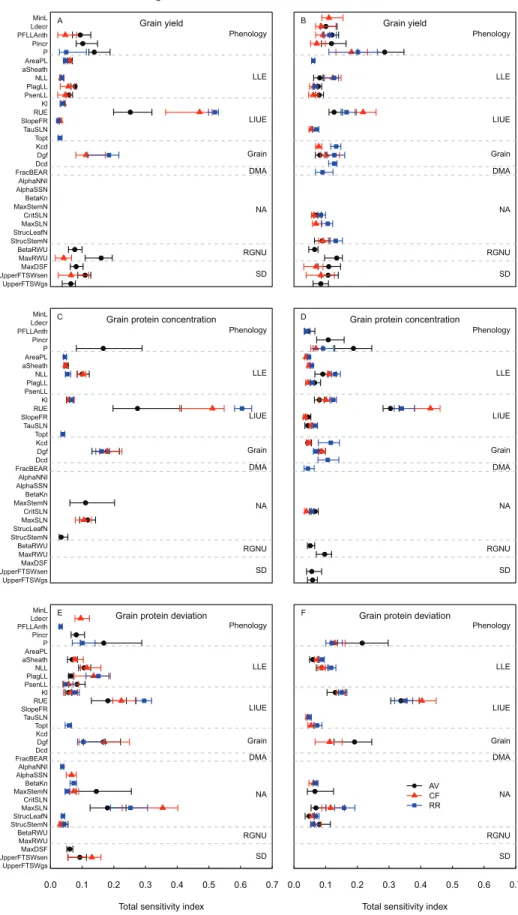
● AV CF RR
Fig. 6. Plot of the median values of the E-FAST total sensitivity index (STi) for the 32 most influential parameters of the wheat simulation model
SiriusQuality2 with respect to grain yield (A, B), grain protein concentration (C, D), and grain protein deviation (E, F) under high (A, C, E) and low (B, D, F) N
supplies. Data include simulations at the three studied sites of Avignon (AV), Clermont-Ferrand (CF), and Rothamsted (RR) for 40 years (1970–2009). For each site, N treatment, and output variable, only the parameters contributing to 90% of the sum of the total sensitivity index in at least 50% of the years are plotted. Parameters are grouped according to the submodel to which they belong. The dashed horizontal lines delineate the different submodels: Phenology, Leaf Layer Expansion (LLE), Light Interception and Use Efficiency (LIUE), Grain, DM Allocation (DMA), N Allocation (NA), Root Growth and N Uptake (RGNU), and Soil Drought (SD). The error bars represent the 25% and 75% percentiles. (This figure is available in colour at JXB online.)
at INRA Institut National de la Recherche Agronomique on November 2, 2015
http://jxb.oxfordjournals.org/
Hammer, 2005; Hammer et al., 2006). The analysis of sys-tem dynamics and properties through simulation experiments using such models provides a holistic approach to study soil– plant–atmosphere systems through the properties captured in the model. The in-depth simulation analysis carried out here contributes to the identification of traits with stable effects in a given population of environments needed to implement fully physiological trait-based breeding, for which phenotyp-ing solutions are bephenotyp-ing developed (Lopes et al., 2014; Pask
et al., 2014).
The results of the E-FAST analysis are quantitative for the 41 selected parameters analysed. However, the results might be taken as qualitative when considering the 75 param-eters of the model, since possible interactions between the selected parameters and the remaining parameters that were unchanged in the analysis are not accounted for. However, since the 34 parameters that were unchanged in the E-FAST analysis were selected based on a screening Morris analy-sis, it is possible to be confident that the E-FAST results can be taken as quantitative when extended to the original (75-parameter) model.
In good agreement with the pleiotropic nature of the genetic and physiological antagonisms between GY and GPC (Aguirrezábal et al., 2014), all the parameters had antagonist effects on these two traits. The present results show that GPC can be increased by increasing the N storage capacity of the leaves and to a lesser extent that of the stem. In most cases, and in good agreement with reported phenotypic correlations (Bogard et al., 2010), a higher GPD was associated with a higher post-anthesis N uptake.
Overall, RUE and Dgf were the two parameters that influ-enced GY the most. Large genetic variability for RUE has been reported for wheat (García et al., 2014), and genetic improvement in GY in the UK after 1983 has been positively associated with higher RUE (Shearman et al., 2005). Genetic analyses have found genetic variations for the duration of grain filling of up to 40% for both bread (Charmet et al., 2005) and durum (Akkaya et al., 2006) wheat. Therefore, the present study supports earlier suggestions (Evans and Fischer, 1999; Reynolds et al., 2012) that RUE and Dgf could con-tribute to improve GY in wheat. However, according to the results, Dgf had no significant effect on GY in Mediterranean environments with terminal water deficit. To a lesser extent, the effect of RUE on GY was also larger and more stable (less interannual variability) in wet than in dry environment.
Changing the number of culm leaves (NLL) independently of the final leaf number had a major influence on GY. With a constant phyllochron, increasing NLL could be an approach to increase the duration of the stem extension period, which has been suggested to increase ear dry mass at anthesis and grain number per square metre and thus yield potential (Slafer
et al., 2001; Foulkes et al., 2011). However, in the present
study, NLL was negatively associated with GY (i.e. increas-ing NLL decreased GY), and the influence of NLL on GY was higher under HN than under LN. This result is explained by the fact that even with 20 g N m–2 of N fertilizer in HN,
the higher early growth of simulated genotypes with higher NLL value depleted soil N, and the growth of the upper culm
leaves was then limited by soil N supply. A higher number of culm leaves thus resulted in a reduction in the amount of light capture during the stem extension period which had a nega-tive effect on ear growth and thus on grain number. The pro-duction of biomass during the grain-filling period was also reduced with higher NLL values.
Therefore, although increasing the number of culm leaves might be a good strategy to improve GY, it would require increasing the N supply and probably the number of ferti-lizer applications. A more precise monitoring of crop N needs would also be required so that leaf growth is not limited by N and applied N is not lost by leaching. This analysis of the effect of NLL is thus a good example where the complex response of the crop can hardly be understood through experimenta-tion because of the complex interacexperimenta-tions that occur. It is also an example where agronomic solutions should be developed along with genetic solutions in order to take full advantage of the genetic improvements.
Physiological constraints should also be considered when trying to manipulate plant development. Indeed changing the number of culm leaves independently of the final leaf num-ber and therefore without affecting the anthesis date might be challenging. The leaf stage at the occurrence of the double ridge and terminal spikelet stage is tightly related to the final leaf number in wheat (Slafer et al., 1994; Giunta et al., 2001; Jamieson et al., 2007). However, variations of about one leaf in this relationship have been observed between winter and spring near isogenic lines with the same final leaf number (Brooking and Jamieson, 2002). This result suggests that the range of variation tested in the present study (±0.9 leaf) could be achieved by genetics without changing the final leaf num-ber and therefore the anthesis date.
Parameters related to phenology had a significant influ-ence on almost all of the investigated model outputs and, as expected, their influence on GY was higher in dryer environ-ments. In general, early flowering genotypes had higher GY because of a higher post-anthesis biomass production and higher harvest index. This trait has played a major role in the adaption of wheat to the Mediterranean climate (Richards, 1991). A recent analysis of genetic improvement in the CIMMYT spring wheat breeding programme has also shown a significant association of GY improvement with fewer days to anthesis (Lopes et al., 2012). The importance of flower-ing time has been highlighted in many genetic analyses where co-locations of quantitative trait loci (QTLs) for flowering time and GY or GPC were found (e.g. Habash et al., 2007; Laperche et al., 2007). In particular, Bogard et al. (2011) showed that the phenotypic correlation between monocarpic leaf senescence and GY and GPD is largely explained by anthesis dates, as major QTLs for these traits co-locate with major flowering time QTLs. Consequently, the benefits of using populations with a narrow range of phenology to iden-tify chromosomic regions associated with adaptive traits have been demonstrated (e.g. Olivares-Villegas et al., 2007).
The present results show that phyllochron could be a valu-able trait to improve GY. Among the phenology parameters, phyllochron appeared as the most influential. Phyllochron is a key determinant of early vigour, especially in growing
at INRA Institut National de la Recherche Agronomique on November 2, 2015
http://jxb.oxfordjournals.org/