HAL Id: halshs-01161624
https://halshs.archives-ouvertes.fr/halshs-01161624
Preprint submitted on 8 Jun 2015HAL is a multi-disciplinary open access archive for the deposit and dissemination of sci-entific research documents, whether they are pub-lished or not. The documents may come from teaching and research institutions in France or abroad, or from public or private research centers.
L’archive ouverte pluridisciplinaire HAL, est destinée au dépôt et à la diffusion de documents scientifiques de niveau recherche, publiés ou non, émanant des établissements d’enseignement et de recherche français ou étrangers, des laboratoires publics ou privés.
Assessment of Doba Oil Project on the Poverty in Host
Region
Aristide Mabali, Moundigbaye Mantobaye
To cite this version:
Aristide Mabali, Moundigbaye Mantobaye. Oil and Regional Development in Chad: Impact Assess-ment of Doba Oil Project on the Poverty in Host Region. 2015. �halshs-01161624�
C E N T R E D'E T U D E S E T D E R E C H E R C H E S S U R L E D E V E L O P P E M E N T I N T E R N A T I O N A L
Oil and Regional Development in Chad: Impact Assessment of Doba Oil
Project on the Poverty in Host Region
Aristide MABALI
Moundigbaye MANTOBAYE
Etudes et Documents n° 15
Juin 2015
CERDI 65 BD. F. MITTERRAND63000 CLERMONT FERRAND – FRANCE TEL.+33473177400
FAX +33473177428 www.cerdi.org
To cite this document:
Mabali A., Mantobaye M. (2015) “Oil and Regional Development in Chad: Impact Assessment of
Doba Oil Project on the Poverty in Host Region”, Etudes et Documents, n° 15, CERDI.
http://cerdi.org/production/show/id/1694/type_production_id/1
2
The authors
Aristide Mabali
PhD Student
Clermont Université, Université d'Auvergne, CNRS, UMR 6587, CERDI, F-63009 Clermont Fd
Email : aristide_mabali@yahoo.fr
Moundigbaye Mantobaye
PhD Student
University of Canterbury (New Zealand)
Email : mantobaye@yahoo.fr
Corresponding author: Aristide Mabali
Etudes et Documents are available online at:
http://www.cerdi.org/ed
Director of Publication: Vianney Dequiedt
Editor: Catherine Araujo Bonjean
Publisher: Chantal Brige-Ukpong
ISSN: 2114 - 7957
Disclaimer:
Etudes et Documents is a working papers series. Working Papers are not refereed, they
constitute research in progress. Responsibility for the contents and opinions expressed in the
working papers rests solely with the authors. Comments and suggestions are welcome and
should be addressed to the authors.
This work was supported by the LABEX IDGM+ (ANR-10-LABX-14-01) within the program “Investissements d’Avenir” operated by the French National Research Agency (ANR)
3
Abstract
In 2003, Chadian authorities passed the Law N° 001/PR/1999, establishing rules for allocating
and managing the expected oil royalties from the Doba Oil project. The oil producing region’s
share amounts to 5% of oil revenues under this law in addition to other benefits related to its
status in order to mitigate negative effects of the oil project. Many field studies attempted to
assess poverty situation in this region. Yet, no rigorous method of impact assessment has
been employed. The goal of this paper is to evaluate the poverty profile in this region, by
combining a double difference estimator with propensity score matching methods. Using
data from the «Survey on Consumption and the Informal Sector in Chad» carried out in 2003
and 2011, our results tend to show that the monetary poverty increased in the oil producing
region compared to control regions. We find no evidence that the nonmonetary poverty
decreased in the producing region, as the important investments in social infrastructures
could have implicitly suggested. In addition, we notice that household expenditures for
temptation goods increased in this region compared to the others. Finally, we observe that
there are spillover effects. Especially the neighboring regions of the oil producing region are
more likely to experience poverty. These results raise the issue of the efficiency of the law
and of its enlargement to newly discovered oil fields.
Key words: Oil resources, poverty, impact evaluation, and Chad
JEL codes: Q35, I32, C22
Acknowledgment
Our thanks go out to Christian BEASSOUM (official in INSEED) for his helpful outstanding
contributions.
4
Introduction
Chad has become an oil producing country since the end of 2003. The country's capacity to manage the oil revenues for reducing the poverty of its population and promoting the development of its economy is a real challenge for Chad and its partners involved in the oil project. This challenge comes from the so-called resource curse according to which mineral-rich States fail to keep pace economically with their non-mineral-rich peers (Auty, 1993; Sachs and Warner, 1995; 1997; Gallup et al., 1999; Ross, 2003; Elbra, 2013). Dispositions taken ex-ante by the Chadian authorities and its partners in the project to ensure a better track of the management of oil revenues led the World Bank to say that the Chadian oil project was “a project model for a developing country” (Miankeol, 2010 and Hoinathy, 2013). The Law 001/PR/1999 constituted the legal framework that was supposed to ensure this proper management. This law predetermined the allocation of the expected oil revenues, especially across the different sectors of the economy by priority order. It provided that 90% of direct revenues (dividends and royalties) would be allocated as following: 80% for financing priority sectors as defined by the public authorities1, 15% would be allocated for operational expenditures and 5% would be transferred to the oil-producing region to help it plan its development and thus mitigate the negative impact of the project that it may incur. The remaining 10% were dedicated to the future generations in order to ensure the intergenerational equity. The decision to allocate 5% of oil resources to the producing Region is consistent with the Article 211 of the Chadian Constitution, which provides that: “The resources of the Decentralized Territorial Collectivities are constituted notably by […] the percentage on the revenues of the resources of the soil and of the sub-soil exploited on their sub-soil.”
The goal of this paper is to evaluate effects of the oil project on the producing Region. In fact, owing to its status of oil producing Region, the region of Logone oriental has been receiving three types of allocations, namely: (i) its share of oil revenues as defined by the legal disposition about the oil revenues, (ii) individual and community compensations due to the destruction of fields and natural capital (fauna, flora, sacred cultural sites…) for the construction of the pipeline paid by oil companies to local people, and (iii) the job programs for locals benefit (Hointhy, 2013). The royalties received have been used for the building of different types of infrastructure (schools, hospitals, water wells, markets, stadiums …). They also helped to finance microcredit programs for the local population. The financial compensations aimed to create economic activities for those among the local population who would have lost their fields and lands in relation with the oil project development. The objective of all these benefits was to mitigate the negative effects of the oil exploitation. After eight years of oil revenues accrual, it seems necessary to rigorously assess the impacts of these different measures. This impact assessment is especially important in order to know whether it makes sense to extend these measures to other regions and this in connection with the oil fields newly discovered in other parts of the country.
Chad has conducted the second «Survey on Consumption and the Informal Sector in Chad» (ECOSIT2) in 2003. We recall that this year coincided with the beginning of the Chadian oil exploitation. The same survey has been carried out in 2011 (ECOSIT3). Benefitting from the availability of data connecting these two periods of 8 years distant, we attempt to assess the poverty alleviation measures taken ahead of the Doba oil project implementation. Both monetary and non-monetary poverty concepts are considered. Many motivations justify this study. Firstly, data on initial conditions of poverty in all regions in Chad exist, allowing the use of a rigorous method for programs impact evaluation such as the quasi-experimental evaluation method. Secondly, large financial resources have been allocated to the Region following the measures discussed above, and that requires an evaluation. Thirdly, a main advantage of using household-level data is a reduced need to control for confounding effects such as differences in institutional and macroeconomic conditions (Michaels, 2008; Caselli and Michaels, 2009; James and Aadland, 2011). Fourthly, no similar study was conducted before to our knowledge in this country. Finally, the discovery of oil fields in Chad makes it necessary to assess these measures to know whether, beyond political and constitutional considerations, they could be reasonably expended to other regions.
1Priority sectors under the law N° 001/PR/1999 were: education, health and human services, rural development,
infrastructure, and environment and water resources. This law has been modified by law N°16/PR/2006 in 2006. The new law deleted the future generation funds and expanded the list of priority sectors to the security and governance. However, sub-item related to 5% allocated for oil-producing region has been widespread throughout the oil projects.
5
We use a double difference estimator with propensity score matching methods to address sources of selection bias on observed and unobserved characteristics of regions. Our results tend to show that the incidence, gap and severity of monetary poverty increased in the oil producing Region compared to control regions. We find no evidence that the nonmonetary poverty decreased in the producing region, as the important investments in social infrastructures could have implicitly suggested. In addition, we notice that household expenditures for temptation goods increased in this region compared to control regions. We also observe that there are spillover effects. Especially the neighboring regions of the oil producing Region are more likely to experience the poverty.
The rest of this paper is organized as follows. In section II, we present the theoretical motivations for the regional discrimination in the allocation of oil resources related to poverty. Section III focuses on the economy of the oil-producing Region. Section IV presents the empirical methodology, the results and the robustness check; and section 5 concludes with policy discussions.
Theoretical framework
Oil exploitation is associated to negative impacts in the producing Region, affecting the welfare of the local population (Ross, 2003; Postali and Nishijima, 2013). Besides, poverty is multidimensional covering all these aspects (Sen, 1985; UNDP, 1990; Alkire and Foster, 2009; Alkire and Santos, 2010). This section presents the different motivations which explain why Chad has decided to allocate part of its oil revenues to the producing Region.
1. Economic motivations
Several recent studies have attempted to evaluate effects of mining exploitation at the local economy level (Givisiez and Oliveira, 2008; Postali, 2009; James and Aadland, 2011; Postali and Nishijima, 2013; Munasib and Rickman, 2015). Using different methods (quasi-experimental evaluation methods, input-output models or growth models) and different outcome variables, these studies are geographically concentrated in the U.S or Brazilian counties. Broadly speaking, these studies seem to confirm the existence of the resource curse at the county local level. Postali (2009) evaluates whether royalties distributed to Brazilian municipalities have contributed for their development. Using difference-in-differences estimator (diff-in-diff) and data on municipal gross domestic product (GDP) growth rate, the author finds that royalty receivers grew less than municipalities that did not receive such resources. In particular, an increase of one percent in per capita real royalties is associated with the reduction of the growth rate of the municipality product by 0.002 percentage points. Using annual growth in per capita personal income from 1980 to 2000 as dependent variable in 49 U.S. states, James and Aadland (2011) found that the resource curse holds at the county level. While Postali and Nishijima (2013) show that royalties distributed had a positive and statistically significant impact on household‟s access to electric wiring, piped water and waste collection, as well as in the decrease of illiteracy rate. This means the recipient municipalities were able to improve some of their social indicators. The authors explained these results by important investments in social infrastructures funded by royalties received.
The main explanation of the resource curse at county level has been highlighted by Ross (2003). According to him, growth in the minerals sector produces stagnation in the agricultural sector. As a result, the poor may be harmed because growth in the agricultural sector plays a particularly important role in reducing poverty. The underlying assumption of this line of reasoning is that the oil sector offers better employment opportunities. This means the stagnation of agricultural sector would result from the workers sectorial reallocation. This argument holds for the region of Logone oriental whose economy is dominated by agricultural activities (Hoinathy, 2013). In addition to that, as the Chadian oil is onshore, its exploitation has led to the construction of a pipeline of 1,076 km from the oil fields to the Kribi port (Cameroon) where it is shipped to the United States (over 90% of the Doba oil production goes there). Thus the construction of the pipeline has reduced the arable land area, destroyed fields and natural capital (flora and fauna …). The loss of these economic assets negatively affects farmers‟ incomes. We also note that the oil exploitation is associated with economic migration due to employment opportunities it offers (Frynas, 2004). The immigrants originate not only from other regions of Chad but they also come from neighboring countries.
6
The non-anticipation of the region's food production capacity appears as a source of pressure on agricultural prices (Magrin and Vliet, 2005)2. The resulting inflation is exacerbated by the massive inflow of financial resources due to financial compensations paid to farmers.
Finally, even if the beginning of the oil project was marked by a higher supply in non-skilled jobs in favor of natives, the need in non-skilled jobs has reduced with time. The low level of education in Chad, especially in the producing Region, suggests fewer employment opportunities in oil production step. Although we have not data on native employments, figures from oil companies on nationals enrolled in Doba Oil Project seem to corroborate this thesis. For example, figure in Appendix 1 between the end of the fourth quarter 2000 and the first quarter 2001, positions held by nationals in the project dropped by over 99 percent ranging from 157,000 to 881 (Mantobaye, 2012). One might also have imagined that, by of the Ratchet effects, farmers having left agricultural sector for oil sector are not being returned to their initial job. All the reasons mentioned above provide a ground for the establishment of a regional clearing system in order to mitigate the negative effects of the oil activity on the well-being of the local population.
2. Political motivations
Economic literature on natural resources supports the idea that oil is a source of political and social conflicts (Grossman and Azam, 1995; Le Billion, 2001a, b; Ross, 2004; Collier and Hoeffler, 2004; 2005; Humphreys, 2005; Hull et Imai, 2010; Acemoglu et al., 2011). The appropriation and the control of resources are at the heart of this thesis (Acemoglu et al., 2005; Boschini et al. 2007). It is empirically observed that conflicts related to natural resource revenues distribution are concentrated around resource-rich regions of resource producing countries (Ellis 1998; Nafziger and Auvinen 2002; Keen, 2003; Ikelegbe, 2005; Francis et al., 2011)3. The oil industry shapes a system in which the central government is the only economic agent for the collection and redistribution of oil revenues. Given the large financial resources generated by oil, securing access and control of oil revenues has become the main locus of political struggle for stakeholders at all levels and has led to calls for “resource control” in producing regions, which have at times resulted in violence. Thus both political struggle and criminal means become dangerously entwined (Nafziger and Auvinen, 2002). In fact, these protests for “resource control” in producing regions can be transformed in struggles for independence (Sudan, Congo DRC, Angola, Nigeria …). The Niger Delta (in Nigeria) is frequently cited as evidence of the pervasiveness of local community protests for resources control (Idemudia, 2014). Different authors who worked on the Niger Delta issue argued that local protests result from personal deprivation, inequality and underdevelopment in riverside communities (Idemudia, 2009a, 2012; Obi, 2010). The violence and the pervasiveness of crime become a response to the perceived injustice of not benefiting from their own resources while suffering the negative consequences of the oil industry activities (Ikelegbe, 2005).
These armed conflicts are likely to perpetuate the poverty status in producing regions. The link between armed conflicts and poverty has been widely discussed in economic literature (Collier, 2000; Luckham et al., 2001; Le Billon, 2001). They undermine also the authority of the central government. The risk of an armed conflict must not be neglected in the region of Logone oriental. To illustrate, we recall that armed conflicts of 1997-1999 in the region were related to the oil project. High poverty level in this Region (according to ECOSIT 2 Report the monetary poverty rate is of 64.7%, ranking it the second-poorest region in Chad after the Region of Mayo-Kebbi) , exacerbated by negative impacts of the oil industry activities, reinforces the conflict risk.
2
Data on inflation at regional level are not available in Chad. However, we present in Appendix 3 evolution of millet prices in region of Logone oriental (1997-2011). We notice that between 1997 and 2003, millet prices were multiplied by over 6, corresponding to periods of pipeline construction. Then they were decreased over time.
3 In Liberia, rival factions struggled to control the main diamond and gold producing areas (Ellis 1998). Keen (2003)
7
3. Environmental motivations
Environment has attracted particular attention in all oil projects. In Chad, before the oil exploitation, civil societies (local, national and international) had been mobilized for that environment protection projects to go hand in hand with oil projects. This need is motivated by the fact that oil exploitation is likely to generate several environmental negative effects: contamination of ground water, accidental chemical spills, reduction in air quality (e.g., dust, diesel fumes), noise, land footprint of drilling activities, earthquake frequency, pipeline placement and safety (Lipscomb et al., 2012; Rahm, 2011; White, 2012; Atkin, 2014). Then destruction of the environment has made the poorest riverside communities vulnerable and has direct deleterious impacts. Recent quarrels between the Chadian government and the Chinese oil company CNPCIC (China National Petroleum Corporation International Chad) on the spill of chemical waste rightly illustrates this need.
Chad‟s oil project is onshore. The number of oil well drilling has been initially estimated to 300 (GIC, 2009). This number has been estimated to 800 in 2012 (Hoinathy, 2012). Thus its exploitation involved the biodiversity loss (flora and fauna) due to pipeline construction. Taking into account this expansion and densification, the Consortium has put in place the “Plan of Mitigation of Impact of Land Use”. The plan describes environmental impacts anticipated on riverside communities. The financial compensations granted to one part of local people or to communities should help to mitigate the environmental degradation impacts. However, the Consortium has not provided data on sanitary impacts of the oil project.
4. Social motivations
Oil projects are likely to generate some major negative social effects on the populations living in the producing area. On the one hand, according to the literature on natural resource curse, oil is likely to increase social inequalities (Sala-i-Martin and Subramania, 2003, Segal, 2011). Then social inequalities are suspected to increase the probability of conflicts. These inequalities are also source of depravity of manners (prostitution, crime and banditry...). For example, according to the results of national survey on seroprevalence drawn in 2005, HIV prevalence is estimated at 9.8% in the region of Logone Oriental (CNLS, 2014). This figure is three times higher than the national average (3.3%). Yet the link between HIV prevalence and poverty is widely debated (Kelly, 2000; Thirumurthy et al., 2008).
On the other hand, sociological studies conducted in areas which experienced a natural resource boom show the emergence of abusive consumption of temptation goods (Moodie, 1994; Bryceson, 2002; Akyeampong, 2002; Grätz, 2002, 2003). Especially Bryceson (2002) pointed out the emergence of “heavy drinking cultures” – this means that the sociability is deeply connected to the consumption of alcohol which becomes the main leisure and dominant lifestyle in these population groups. Hointhy (2013) conducted a research on the social transformations in the region of Logone oriental. He found that individual compensations have been used for abusive alcohol consumption. This situation affects the household poverty in two ways. It may divert resources that could have been spent for child education. Similarly the investment in time for child education should be reduced. The abusive alcohol consumption can lead to the decline or death of the household head.
Finally, reducing arable lands, the oil project is likely to have accelerated existing tensions between herders and farmers. In effect, livestock keeping and agriculture are main activities of the region of Logone oriental. Thus, the reduction of arable area is likely to increase the pressure on reduced available land, which would further contribute to conflicts between herders and farmers. These conflicts harm social cohesion and economic activities.
Advantages received by the oil producing Region
The benefits received by the Logone oriental region, as the oil-producing Region, are of several orders. Firstly, there is the 5% of direct resources (dividends and royalties) paid under the Article 211 of the Chadian
8
constitution. Secondly, compensations were paid to farmers for the loss of their farmland and their trees. Thirdly, natives of the Region benefitted from employment programs reserved to the Region.
1. 5% of oil revenues
According to the Law N°001/PR/1999, the region of Logone oriental as oil producing Region is entitled 5% of the oil revenues. This Region located in the extreme south of Chad, covers an area of 22,951 km2. Its population is estimated at 779,339 inhabitants in 2009 (second census) makes it the second largest Region in population after the Region of N‟Djamena (Chad's capital).
The management of these financial resources is ensured by the «Comité Provisoire de Gestion des Revenus Pétrolier – CPGRP-5%». This institution is mandated to oriente the allocation of these resources for the purpose of regional development. As discussed in Idemudia (2012), the first strength of an oil commission is that it might reduce the vertical distance between the central government and the people of the oil producing communities. This is particularly important for a better match between infrastructures provided and the core needs of the community. While CPGRP-5% has inherited the “Regional Development Plan for Logone oriental”4, a strategic document designed to support local development by ensuring community participation and inclusiveness. We note that the monitoring is ensured by another institution, namely the “
Collège de
Contrôle et de Surveillance des Revenus Pétroliers - CCSRP”
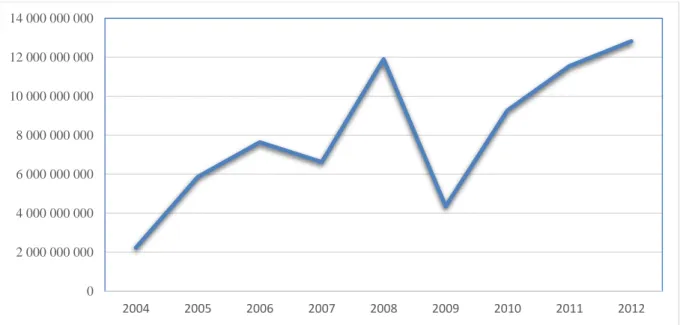
5. This is an independent institution whose objective is to ensure transparency in the management of oil resources. The CCSRP is responsible for checking the compliance between the budgetary allocations and spending of the oil revenue and the National Poverty Reduction Strategies.From 2004 to 2012, Logone oriental received 59,427,578,800 CFA francs (around (US$ 104,977,000)6 with respect to this law (see Appendix 2). The evolution of the oil resources allocated to the Logone oriental region shows a high instability explained by the fluctuation of price and production of oil (see Figure 1). In fact, these resources are a proportion of oil revenues received by Chad. Thus they depend upon the oil quantity produced in the Doba oil fields and the international oil prices.
4 However Miankeol (2010) observed, during field survey in region of Logone oriental, that there is a lack of
consistency between infrastructures provided and core community needs. This suggests that the Regional Development Plan for Logone oriental has not been executed.
5 CCSRP is an independent body composed of government officials and civil society organizations as follows: One (01)
member of the Supreme Court, one (01) Member of the Parliament, one (01) Senator, the national Director of the Bank of Central African States (BEAC), the Director of Treasury, and four (04) representatives of civil society organizations.
6
9
Figure 1: Evolution of oil royalties received by the Region of Logone Oriental under law N°001/PR/99
Source: GRAMP-TC/CCSRP
We also noted that the major part of these resources (80.58%) have been used to build physical infrastructures for social needs such as schools, hospitals, water wells. Other infrastructures (market, electricity, stadiums …) are financed up to 13.70%. Microcredit programs are financed up to 4%. The rest (1.36%) has been used to feed the solidarity fund.
Regarding the microcredit program, 2,388 individual and collectivity projects were financed, corresponding to an amount of three billions CFA francs under the five-year plan. Three types of funding were available for natives of the Region:
working capital for new individual entrepreneurs (priority was given to women ), the amount of this fund varies between 50,000 CFA francs and 1,000,000 CFA francs;
equipment funds for associations, the amount ranges from 1,000,000 to 3,000,000 CFA francs; equipment funds for associations or cooperatives, the amount ranges from 3,000,000 to 10,000,000
CFA francs.
The interest rate on these credits is set at 3%. It is much lower than the market rate. Despite this low rate, field studies conducted in the region found low reimbursement rates (around 20 to 25%).
The solidarity fund is intended to finance the regional stabilization fund. As a matter of principle, the fund is created to manage natural disasters. Thus, this fund helped to mitigate the flood consequences suffered by the communities of the locality of Pendé (Bebedjia – see Figure 2) in 2008. The same year, it was also used to rescue the communities of the locality of Monts de Lam who lost their crops due to the devastation of fields by elephants. Two other major uses of these funds relate to the purchase, on demand of the population, of drugs for the Doba‟s Hospital (regional capital) and the financing of raining in sanitation of the city (Miankeol, 2010).
Figure 2: Card of Region of Logone oriental 0 2 000 000 000 4 000 000 000 6 000 000 000 8 000 000 000 10 000 000 000 12 000 000 000 14 000 000 000 2004 2005 2006 2007 2008 2009 2010 2011 2012
10
Both the infrastructure construction and microcredit programs aim to reduce poverty in the Region of Logone oriental. As suggested by endogenous growth models, there is a clear link between physical infrastructure and growth (Barro, 1990). However, the link with poverty is neither automatic nor necessarily direct (Pouliquen, 2000). Moreover, how long it takes for impacts to emerge is an issue that often arises in discussions of physical infrastructure impacts and planning for their evaluation (Mu and De Walle, 2011). Finally, infrastructure impacts on poverty alleviation and planning for their evaluation seem to depend on types of infrastructures (Binswanger et al 1989). But these questions do not arise about microcredit program impacts. The idea is that they directly affect household incomes and in short run (Banerjee et al., 2010; Karlan et al., 2010).
It should be noted that the field surveys analysis have evidenced the lack of coherence between the use of oil royalties and the Regional Development Plan for Logone oriental. In fact, some infrastructures (stadiums, markets, higher education) financed by oil royalties don't meet needs of the local economy. They also noticed that social infrastructures have been built in urban areas. Yet, the poverty in Chad is a predominantly rural phenomenon (ECOSIT3 report). Finally, microcredit programs look more like a cash transfer to households. Without supervision neither a reimbursement obligation of funds borrowed, households tended to use these funds for temptation goods (Banerjeey et al., 2010).
2. Compensations
The construction of pipeline led to the occupation of land used previously by inhabitants for agriculture. The local economy is dominated by agricultural activities. This suggests that the occupation of arable areas led to assets loss for farmers that need to be compensated. Compensation system of land used by the oil project is based on land-related laws in Chad. Land belongs to the Chadian State under this law. Thus there are the uses of land which are compensated: fallow land, loss of harvests and loss of fruit trees. According to the beneficiaries, there are two types of compensation: individual compensation and community compensation. These compensations are paid by the consortium that exploits the oil (see Appendix 4 and Appendix 5 for
11
amounts of compensations)7. The amounts of individual compensations have been subjected to of hard negotiations between the consortium on one side, and civil society organizations and beneficiaries on the other. For example these negotiations resulted in an increase from 30,000 CFA francs (US$ 53) to 550,000 CFA francs (US$ 972) per mango tree destroyed. (Seignobos and Madjigoto, 2005; Magrin and Vliet, 2005). These compensations amount to 5.5 million U.S. dollars, corresponding to 0.1% of total investment estimated to 4 billion U.S dollar. The amounts of individual compensations have varied from 5,000 U.S dollar to 5 million FCFA francs (US$ 8834), with an average of 325,000 FCFA francs (US$ 574).
Community compensations are counterparts of fauna and flora destroyed. They are used to finance diverse infrastructures (schools, housing for some village chiefs, well water...), to meet the expressed needs by the population. Individual compensations are paid to people who lost their arable areas. In addition, the high vulnerability of recipient households led the oil companies to finance the training for their professionalization (dressmakers, drivers...) in conjunction with the diversification goal of economic activities (barn, sheepfold...). Finally, another type of compensation exists in form of discrimination in employment opportunities in favor of local workers. Finally, according GIC (2009) Report, the consortium put in place several vocational training programs for some farmers who lost their land in order to insure their professional retraining. Employees from consortium also received training on capacity-building.
Hointhy (2013) conducted a research on the social transformations in the oil producing area. He noticed that individual compensations have been used for five (05) types of expenditures: (i) productive investment (hitch oxen, ploughs, ploughs, …) and means of transportation (motorcycle and bicycle), (ii) commercial activities (mills, shops, liquor) and real estate investment (acquisition of land/buildig), (iii) acquittal of marital benefits for new or old wives, (iv) consumption and leisure expenditures (food, school for children, alcohol,...).
Methodology
Our identification strategy to assess the effects of Doba Oil Project on the Poverty in oil producing Region is based on the use of quasi-experimental methods. We use data from national household surveys "Survey on Consumption and the Informal Sector in Chad" (ECOSIT). These surveys have been conducted in 2003 and 2011. We recall that 2003 also marked the beginning of the oil exploitation in Chad. Having two observation points, we use both Diff-in-Diff method with the Propensity Score Model. These two models have the advantage of controlling for selection bias on observed and unobserved characteristics (Rosenbaum and Rubin, 1983; Khandker et al., 2010; Mu and De Walle, 2011).
1. Data sources
Data have been derived from two household surveys conducted in 2003 (ECOSIT2) and 2011 (ECOSIT3) in Chad. These surveys aimed to establish the poverty profile in Chad. These data have been used for the formulation of different National Poverty Reduction Strategies implemented by the Chadian Government. The surveys components are threefold: (i) one module on individuals/households, (ii) one module on household income and consumption (household expenditures) and (iii) one module on the informal sector. Fields covered by these surveys are education, health, employment, food, housing and household assets. Their geographical coverage is the nationwide.
These surveys used a two-stage stratified sample. Enumeration Areas (EA) are randomly sampled at the first stage. These statistical units and they cover all inhabited areas of the country during the reference time, so that there are no gaps between EAs. They include a number of households based on population density in population and the distance between the towns of a region. EAs are identified during the census, particularly during the cartographical phase, that is, immediately before counting starts. Therefore, EAs used here come
7 See Seignobos and Madjigoto (2005) for all the details having led to the determination of compensation amounts. We
note that the World Bank has proposed that the compensations are able to "rehabilitate the head of family affected by the oil project not only in its original condition, but in an improved situation."
12
from two censuses conducted by Chad in 1993 and 2009. In total, ECOSIT 2 included 584 EAs corresponding to 7,008 households while ECOSIT 3 included 480 EAs corresponding to 9,259 households. The major challenge relates to the matching of statistical units (individuals, households, localities or EAs) surveyed for the two surveys (2003 and 2011). This research objective cannot be adequately achieved with household data. In fact, the questionnaire of ECOSIT3 does not allow us to determine whether a given household sampled in 2011 has been also sampled in 2003. That's the reason why we use EA as our statistical units. Using methodology documentations for the two surveys and the list of localities, we are able to link the EAs. In total, we are able to identify 239 EAs sampled during both 2003 and 2011 surveys.
2. Identification strategy
Although the status of oil producing region is exogenous, the poverty status may depend of observed and unobserved characteristics. In such context, another major challenge, in quasi-experimental evaluation method, is to construct an appropriate counterfactual model. A potential source of bias is that initial conditions are likely to affect the poverty path. This is also the case for unobservable characteristics.
In many cases, recent studies similar to ours have used difference-in-differences (DID) estimator (Givisiez and Oliveira, 2008; Postali, 2009; James and Aadland, 2011; Postali and Nishijima, 2013; Munasib and Rickman, 2015). Postali (2009) uses the DID to assess the oil and gas royalty effects distributed to Brazilian municipalities on gross domestic product growth rate. Postali and Nishijima (2013) use the same estimator to assess the effects of these royalties on a certain number of social indicators. The drawback of this estimator is that it is based on the assumption that only unobservable characteristics are source of bias. Yet there are reasons to think that other observed variables (economic structure, social capital …) can affect poverty in the oil producing Region (in our case). Bertrand et al. (2004) also emphasize that DID tends to overstate the significance of interventions. To tackle this disadvantage, Munasib and Rickman (2015) use synthetic control method to assess the impact of oil and gas production from shale formations in US counties. Synthetic control method provides a counterfactual (or synthetic) that is a combination of the control units – a data-driven procedure that calculates „optimal‟ weights to be assigned to each unit in the control group based on pre-intervention characteristics, thus, making explicit the relative contribution of each control unit to the counterfactual (Abadie and Gardeazabal, 2003; Abadie et al. 2010). Given the high number of control units in our study, we could have used this estimator. Unfortunately, its use needs several observation points over time that we do not have.
With this discussion in mind, we combine a DID with propensity score methods (PSM). A DID gives unbiased estimates based on the assumption that the selection bias is constant over time. To estimate the average effects of the oil project in the region under investigation, with the DID, we use the following regression: it i t i t i it
d
T
d
T
Y
*
(1)Where
d
i is a binary variable equal to 1 if ever treated, 0 otherwise;T
t is a binary variable equal to 1 in the post period (2011), 0 in the pre period (2003);d
i*
T
is an interaction term between the two;
i is a «fixed effect» at the Enumeration Area level;
is the difference in differences estimator – the coefficient of interest. The average effect of the oil project on the producing Region (α) is the change in the outcome variable between the EA directly unaffected and the EA affected by the oil project.A PSM constructs a statistical comparison group by modeling the probability of participating in a program on the basis of observed characteristics unaffected by the program (Khandker et al., 2010; Rosenbaum and Rubin, 1983). The key assumption of PS-matched or weighted DID is that the selection bias is conditional on
13
the observed covariates in the baseline. Our second specification, is inspired from Hirano and Imbens (2002) and Hirano et al (2003) as follows:
)
(
)
,
(
)
(
2 1 jNO2 jNO1 NO j O i O i iY
Y
i
j
Y
Y
DD
(2)Where DDi is the average impact for each EA i in oil producing Region, O and NO denote Oil (treatment) and No-oil (comparison) respectively; is the change in the outcome measure for EA i; is the change in the outcome measure for the comparison EA j and
( ji, )is the weight (using a PSM approach) given to the jth control EA matched to treatment EA i. We use nonparametric kernel matching in which all EAs in the oil producing Region are considered as a comparison group.
( ji, ) are assigned according to a kernel function of the predicted propensity score following Heckman et al. (1997). We use a probit model8 to calculate the propensity scores controls for an array of initial conditions that affect the poverty in regions. In terms of a regression framework, Hirano et al. (2003) show that a weighted least squares regression, by weighting the control observations according to their propensity scores, is then a fully efficient estimator.3. Variables and descriptive statistics
We use two different types of poverty indicators to assess the effects of oil resources on the oil producing Region. There are two main families of poverty measures, namely: monetary and multidimensional indicators of poverty. Among the indicators of monetary poverty, we choose the measures of Foster, Thorbecke and Greer (1984). We prefer these indicators because they have been used by Chadian authorities to develop the National Poverty Reduction Strategies. They are also appreciated due to their interesting proprieties (see Ravallion, 1996; Boccanfuso and Kaboré, 2008; Alkire and Foster, 2011). Finally, these indicators are calculated from household expenditures (see Appendix 8 for all details). While non-monetary poverty indicator is based on the privation approach. We draw our inspiration from Alkire and Santos (2010). With regards to the indicators of monetary poverty, we make use of poverty lines used by the “Institut National de la Statistique, des Etudes Economiques et Démographiques” (INSEED). The poverty line corresponded to a daily expenditure of 396 CFA francs per capita ($ US 0.70)9 in 2003 (ECOSIT2), representing an annual expenditure per capita of 144,570 CFA francs. This poverty line represents just under 3/5 of a US dollar per day per capita10, which is the international poverty line defined by the international community. While this line is estimated to 652 CFA francs per capita per day ($US 1.10) in 2011 (ECOSIT3), corresponding to an annual expenditure of 237,942 CFA francs per capita. We recall that these are official poverty lines. We note that the poverty line increased by approximately 65%. In the same time, the average annual inflation rate is 2.70% over same period. Regional weights are used to take into account regional heterogeneities in poverty. Three indicators of poverty are calculated, namely: (i) incidence of poverty (P0), (ii) poverty gap (P1) and (iii) severity of poverty (P2). The evolution of the incidence of poverty shows that 35.25 % of Chadian households were poor in 2003. This proportion was 26.51% in 2011. Our Multidimensional Poverty Index (MPI), based the approach of basic needs, reflects the overlapping deprivations that members of a household suffer in connection with qualified fundamental goods and services (Alkire and Foster, 2007, 2009; Alkire and Santos, 2010; Beassoum, 2011). It is composed of nine indicators corresponding to the same three dimensions as the Human Development Index: (i) Education, (ii) Health and (iii) Standard of Living. Each dimension is equally weighted; each indicator within a dimension is also equally weighted. A household is identified as multidimensionally poor if, and only if, it is deprived in some combination of indicators whose weighted sum is 30 percent or more of the dimensions. The
8
Other authors use logit model to calculate the propensity scores (see Mu and De Walle, 2011). We also applicate this estimators and we find that results haven‟t changed.
9 For comparison, Burkina Faso National Institute of Statistics and Demographic has estimated the line poverty to $ US
0.40 in 2003 (Badolo and Traore, 2012). Chadian line poverty is the same in Niger in 2001 (Youssouf, 2010).
10
14
dimensions, indicators, and deprivation criteria are presented and explained with detail in Appendix 8. We also use disaggregated data on household expenditures as outcome variables. These are related to Education, Health, Leisure, Alcohol, Furnishing, Housing and Food (per capita).
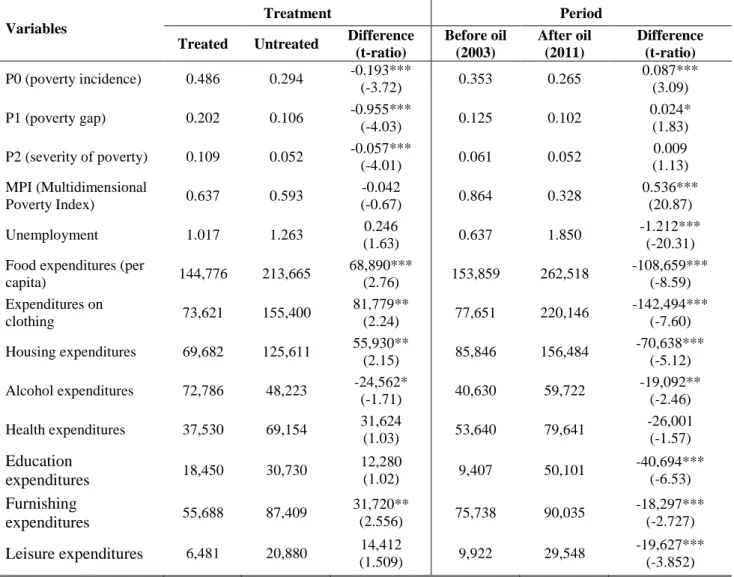
Table 1 displays the mean values of these outcome variables across treated and untreated EA. The poverty indicators (incidence, gap and inequality), except the multidimensional poverty index, are better in untreated EA compared to treated EA. The key question is whether these differences can be attributed to the oil project. With regard to the evolution of outcome variables over time, we notice that the poverty incidence decreased from 35.3% to 26.5% over our study period. The nonmonetary poverty also decreased sharply over the same period. All household expenditures significantly increased, excepted health expenditures.
Table 1: Outcome variable means
Variables
Treatment Period
Treated Untreated Difference (t-ratio) Before oil (2003) After oil (2011) Difference (t-ratio) P0 (poverty incidence) 0.486 0.294 -0.193*** (-3.72) 0.353 0.265 0.087*** (3.09) P1 (poverty gap) 0.202 0.106 -0.955*** (-4.03) 0.125 0.102 0.024* (1.83) P2 (severity of poverty) 0.109 0.052 -0.057*** (-4.01) 0.061 0.052 0.009 (1.13) MPI (Multidimensional Poverty Index) 0.637 0.593 -0.042 (-0.67) 0.864 0.328 0.536*** (20.87) Unemployment 1.017 1.263 0.246 (1.63) 0.637 1.850 -1.212*** (-20.31) Food expenditures (per
capita) 144,776 213,665 68,890*** (2.76) 153,859 262,518 -108,659*** (-8.59) Expenditures on clothing 73,621 155,400 81,779** (2.24) 77,651 220,146 -142,494*** (-7.60) Housing expenditures 69,682 125,611 55,930** (2.15) 85,846 156,484 -70,638*** (-5.12) Alcohol expenditures 72,786 48,223 -24,562* (-1.71) 40,630 59,722 -19,092** (-2.46) Health expenditures 37,530 69,154 31,624 (1.03) 53,640 79,641 -26,001 (-1.57) Education expenditures 18,450 30,730 12,280 (1.02) 9,407 50,101 -40,694*** (-6.53) Furnishing expenditures 55,688 87,409 31,720** (2.556) 75,738 90,035 -18,297*** (-2.727) Leisure expenditures 6,481 20,880 14,412 (1.509) 9,922 29,548 -19,627*** (-3.852) Note: the sample consists of all 478 EA. *** Significant at 1%; **significant at 5%; * significant at 10%
Several variables are used as predictors to construct the counterfactual for each EA of the oil Region. These variables are likely to differentially affect poverty. First, we use agricultural incomes and the number of cotton producers to reflect the structure of regional economies. In a study similar to ours, Munasib and Rickman (2015) used similar variables to construct their synthetic control in order to take account whether the region was heavily dependent on farming, manufacturing, or mining. We noted that these variables are likely to control for the population geographical repartition (urban/rural)11. We also use the household head's sex, household size, number of bedrooms in the household, habitat features (bathroom, wall material, roof material). All these variables are used to estimate the propensity score.
11
Data from baseline period cannot us to allow distinguishing rural and urban areas because all regions are considered as rural areas excepted the towns of N‟Djamena, Moundou, Abeché and Moundou (see Appendix 6).
15
4. Results and interpretations
Table 2 presents DID estimates of mean impacts using the PS-based kernel matching (column 3) and weighting (column 2) methods, as well as simple DID estimates (column 1). To compare the changes in the oil and non-oil regions.
Table 2: Oil effects on recipient Region poverty
(1) (2) (3) DID t-ratio PS weighted DID t-ratio PS Kernel matched DID t-ratio Monetary poverty indicators
P0 (poverty incidence) 0.096 1.01 0.192*** 3.60 0.193*** 3.68 P1 (poverty gap) 0.042 0.77 0.095*** 3.26 0.096*** 3.21 P2 (poverty severity) 0.020 0.54 0.056*** 2.86 0.057*** 2.81
Non-monetary poverty indicators
Privation index -0.190*** -3.10 0.044 0.71 0.044 0.68 Employment 0.396** 2.27 -0.245 -1.64 -0.246 -1.62 Expenditures on clothing 0.066 0.26 -0.630*** -3.64 -0.630*** -3.34 Housing expenditures -0.782*** -3.10 -0.417*** -2.80 -0.416*** -2.91 Food expenditures (per capita) -0.112 -0.56 -0.359*** -3.32 -0.359*** -3.20 Alcohol expenditures 0.145 0.34 0.338** 1.97 0.339* 1.86 Health expenditures -0.695** -2.22 -0.168 -0.98 -0.168 -1.03 Education expenditures 0.024 0.07 -0.562** -2.09 -0.562** -2.02 Furnishing expenditures 0.425** 2.20 -0.430*** -3.12 -0.429*** -3.04 Leisure expenditures 0.499 0.78 -1.226*** -3.68 -1.225*** -3.53
Notes: p-values in parentheses *p<0.10, ** p<0.05,***p<.01 All expenditure variables are in logarithm.
T-ratio of our all models are obtained from bootstrapping (500 repetitions).
Focusing on the kernel matched and PS weighted DID, we notice that DID estimates for monetary poverty indicators are positively and statistically significant at the 1% level. This means that the difference in monetary poverty increased between the oil producing Region to other regions after controlling for observed and unobserved characteristics. Especially the proportion of the poor increased by 19.3% in the region of Logone oriental compared to control regions over the period 2003-2011. We see that the poverty gap that measures the gap of consumption expenditures of poor households compared to the poverty line increased by 9.6% in the oil producing Region compared to control regions. Finally, there is an increase of inequalities by 5.6% between poor and non-poor households. These results seem to show that the region of Logone oriental experienced the oil curse. This suggests that the system put in place to mitigate the oil negative impacts didn't produce the expected outcome. One possible explanation for this is that, the agricultural sector is crowded out by the oil project. First, agriculture is an important source of income for farmers in the region of Logone oriental. But the reduction of arable land due to pipeline construction negatively affects the farmers‟ incomes, and thus their consumption. The rudimentary nature of agriculture does not allow the compensation by productivity.
The employment situation also hasn‟t improved in the oil producing Region compared to control regions, which would suggest the neglect of agriculture. In fact, although the unemployment coefficient estimated by the kernel matched and PS weighted DID reveals not significant, the simple DID shows that the unemployment increased in the region of Logone oriental. This result is unsurprising for two reasons. Firstly,
16
the beginning of the oil project is marked by a higher supply in non-skilled job in favor of natives. While the need in non-skilled job reduces with time. Secondly, the local economy is dominated by agricultural activities. Thus, the decrease in arable land due to the building of pipeline negatively affects the employment supply.
As of the non-monetary poverty, we notice that the coefficient associated to our multidimensional poverty index is not statistically significant for the kernel matched and PS weighted DID models. This suggests that the number of households deprived in dimensions of our index (health, education and standard of living) has not improved in the region of Logone oriental compared to control regions. This result is rather surprising given the uses made of oil royalties, as financing the building of social infrastructures (schools, hospitals, water wells …).
Then we find evidence that the increase of poverty in the oil producing Region is associated with a significant reduction in food, education, leisure, housing and furnishing expenditures for all estimators used. However, household alcohol expenditures increased in the region of Logone oriental compared to control regions. This is consistent with both our theoretical discussion and results of field surveys.
In sum, we find some support for natural resource curse in the oil producing Region. Our results indicate significant negative average impacts on poverty indicators of the region of Logone oriental where oil is flawing.
5. Robustness tests
If there may be geographic spillovers associated with oil project, such that what are considered control groups may in fact be receiving a treatment effect, this would tend to understate the treatment effect in the project region of Logone oriental. For example, in examining shale boom counties across the U.S. counties, Weinstein (2012) finds evidence of significant spatial spillovers. We perform a test to check whether our results are sensitive to the Stable Unit Treatment Value Assumption (SUTVA). According to this assumption, the treatment of one unit does not affect another‟s outcome, suggesting the absence of spillover effects. The violation of SUTVA is a source of estimation bias.
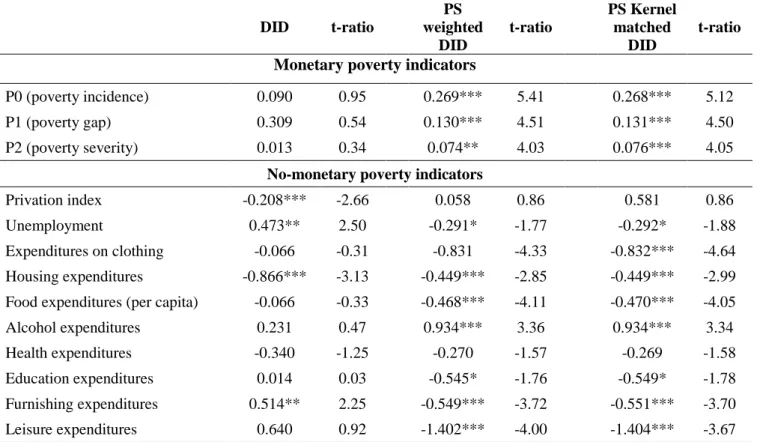
To perform this test, we re-estimate our models by dropping out all neighboring regions of the Logone oriental Region.12. Therefore the counterfactual is estimated from regions that are not sharing a common border with the oil producing Region. Our identification strategy is closer to those used by Weber (2012). This author attempts to compare the performance of economies in natural gas boom U.S counties using a triple difference-in-difference approach. Counties that share a border with a boom county are omitted from the non-boom control group. Our results are summarized in Table 3.
12
17
Table 3: Impact of oil royalties on poverty in region producing with SUTVA control
DID t-ratio PS weighted DID t-ratio PS Kernel matched DID t-ratio Monetary poverty indicators
P0 (poverty incidence) 0.090 0.95 0.269*** 5.41 0.268*** 5.12 P1 (poverty gap) 0.309 0.54 0.130*** 4.51 0.131*** 4.50 P2 (poverty severity) 0.013 0.34 0.074** 4.03 0.076*** 4.05
No-monetary poverty indicators
Privation index -0.208*** -2.66 0.058 0.86 0.581 0.86 Unemployment 0.473** 2.50 -0.291* -1.77 -0.292* -1.88 Expenditures on clothing -0.066 -0.31 -0.831 -4.33 -0.832*** -4.64 Housing expenditures -0.866*** -3.13 -0.449*** -2.85 -0.449*** -2.99 Food expenditures (per capita) -0.066 -0.33 -0.468*** -4.11 -0.470*** -4.05 Alcohol expenditures 0.231 0.47 0.934*** 3.36 0.934*** 3.34 Health expenditures -0.340 -1.25 -0.270 -1.57 -0.269 -1.58 Education expenditures 0.014 0.03 -0.545* -1.76 -0.549* -1.78 Furnishing expenditures 0.514** 2.25 -0.549*** -3.72 -0.551*** -3.70 Leisure expenditures 0.640 0.92 -1.402*** -4.00 -1.404*** -3.67
Notes: p-values in parentheses *p<0.10, ** p<0.05,***p<.01 All expenditure variables are in logarithm.
T-ratio of our all models are obtained from bootstrapping (500 repetitions).
Broadly speaking, we find evidence that the signs and the significance levels of our variables are unchanged. The only major change occurs in the magnitude of interest coefficients. Focusing on the incidence of monetary poverty, we notice that coefficients estimated by the kernel matched and PS weighted DID are about 40% higher than those estimated on total sample. Regarding the household expenditures, the difference in magnitude of coefficients is somewhat small ranging from 7% for housing expenditures to 32% for expenditures on clothing, except for alcohol consumption expenditures where the difference in magnitude is by 176%. We observe also that the coefficient of the unemployment variable becomes significant at the 10% level. This suggests that the unemployment decreased after controlling for spillover effects.
These results seem to show that there are spillover effects of negative impacts. Particularly, they suggest that neighboring regions to the oil producing area are more likely to experience the natural resource curse. One possible explanation would related to the migration due to better employment opportunities in oil producing Region. The idea is that, given the geographical proximity, people from Logone oriental‟s neighboring regions are more likely to be involved in economic migration. As discussed above, this economic migration might crowded out the agricultural sector, which dominates in these regions. The coefficient of unemployment variable that becomes significant and negative at the 10% level seems to support this argument.
One other explanation would that, in connection with the new economic geography models, we might envisage a diversion of economic activities towards oil producing Region due to better economic opportunities it offers. This means a poverty escalation in Logone oriental‟s neighboring regions. According to these results, the mitigation system of negative impacts of natural resources for region producing must include the neighboring regions. However we recognize that these two channels require of specific econometric tests that are beyond the framework of this paper.
18
Conclusion
With the oil discoveries in other parts of Chad, the discussion about the impact of oil windfalls on poverty have intensified. In their concern to fight the natural resource curse, Chadian authorities passed the Law N° 001/PR/1999, establishing rules for allocating and managing the expected oil royalties from the Doba Oil project in 2003. The oil producing region‟s share amounts to 5% of oil revenues under this law in addition to other benefits related to its status in order to mitigate negative effects of the oil project. This research focuses on the impacts of oil exploitation on various variables related to poverty in the producing Region. Our identification strategy combines a double difference estimator with propensity matching on pre-intervention covariates. We focus on monetary and nonmonetary poverty using data from the «Survey on Consumption and Informal Sector in Chad» carried out in 2003 and 2011.
Results tend to show that the incidence, gap and severity of monetary poverty increased in the oil producing Region compared to control regions. We find no evidence that the nonmonetary poverty decreased in the oil producing Region, as the important investments in social infrastructures could have suggested. This result reflects the lack of coherence between social infrastructures financed by oil royalties received and basic community needs. It is also related to a misuse of individual compensations received and a limited supervision of microcredit programs. Thus we notice that household expenditures for temptation goods increased in this region compared to control regions. Finally, we observe that there are spillover effects of negative impacts. Especially the neighboring regions of oil producing Region are more likely to experience the poverty. These results raise the issue of expansion of this law to oil fields newly discovered.
19
References
Aker, J. C., Ksoll, C. and Lybbert, T. J., 2012. Can Mobile Phones Improve Learning? Evidence from a Field Experiment in Niger. American Economic Journal: Applied Economics 2012, 4(4): 94–120
Badolo, F. and Traore, F., 2012. Impact of Rising World Rice Prices on Poverty and Inequality in Burkina Faso. CERDI, Etudes et Documents, E 2012.22
Banerjeey, A., Duflo, E., Glennerster, R. and Kinnan, C., 2010. The miracle of microfinance? Evidence from a randomized evaluation.
Beassoum, C. N., 2011. Chad regional poverty profile in 2003: revisiting a baseline. Munich Personal RePEc Archive & INSEED-TCHAD
Binswanger, H., Khandker, S.R., Rosenzweig, M. (1993). How infrastructure and financial institutions affect agricultural output and investment in India. Journal of Development Economics 41, 337–366.
Caselli, F. and Michaels, G., 2009. Resource Abundance, Development, and Living Standards: Evidence from Oil Discoveries in Brazil. Working paper
Chaléard, J. L., 2002. Le sud du Tchad revisité: une nouvelle géographie régionale. Annales de Géographie (pp. 329-330), Armand Colin.
De Seabra, A. A., Khosrovyan, A., Del Valls, T. A., and Polette, M., 2015. Management of pre-salt oil royalties: Wealth or poverty for Brazilian coastal zones as a result? Resources Policy, 45, 1-8
Duflo E., 2001. Schooling and Labor Market Consequences of School Construction in Indonesia: Evidence from an Unusual Policy Experiment. American Economic Review 91(4)
Fraker, T., Maynard, R. (1987). The adequacy of comparison group designs for evaluations of employment related programs. Journal of Human Resources 22 (2), 194–227.
Francis, P., Lapin, D. and Rossiasco, P., 2011. Securing Development and Peace in the Niger Delta: A Social and Conflict Analysis for Change. Woodrow Wilson International Center for Scholar
Galiani, S., Gertler, P., Schargrodsky, E. (2005). Water for life: The impact of the privatization of water services on child mortality. Journal of Political Economy 113 (1), 83–119.
Groupe International Consultatif, (2009). Projet d‟Exploitation Pétrolière et d‟Oléoduc Tchad-Cameroun. Rapport Final
Guido, W. I. and M. Wooldridge, J. M., 2009. Recent Developments in the Econometrics of Program Evaluation. Journal of Economic Literature 47, no. 1: 5-86.
Hoinathy, R., 2013. Pétrole et changement social au Tchad: Rente pétrolière et monétisation des relations économiques et sociales dans la zone pétrolière de Doba. Ed. Karthala
20
Idemudia, U., 2012. The resource curse and the decentralization of oil revenue: the case of Nigeria. Journal of Cleaner Production 35 (2012) 183-193
Ikelegbe A., 2005. The Economy of Conflict in the Oil Rich Niger Delta Region of Nigeria. Nordic Journal of African Studies 14(2): 208–234 (2005)
James, A. and Aadland, D., 2011. The curse of natural resources: An empirical investigation of U.S. counties. Resource and Energy Economics 33 (2011) 440–453
Kelly, J. M., 2000. Planifier l‟éducation dans le contexte de VIH/sida. Principe de la planification de l‟éducation n°66, IIPE/UNESCO
Luckham, R., Ahmed, I., Muggah, R. and White, S. (2001). Conflict and poverty in Sub-Saharan Africa: an assessment of the issues and evidence.
Magrin, G. and Vliet, G. V., 2005. Greffe pétrolière et dynamiques territoriales: L'exemple de l'on-shore tchadien. De Boeck Supérieur | Afrique contemporaine, n° 216, pages 87 à 105
Mantobaye, M., 2012. Examining the socio-economic impacts of the Chad-Cameroon oil and pipeline project. Master's Thesis, Faculty of the Department of Economics and Decision Sciences, Western Illinois University
Meyer, B. D., 1995. Natural and Quasi-experiments in economics. Journal of Business and Economic Statistics 13, 151–161
Miankeol D., 2010. Rapport bilan d‟utilisation des 5% des revenus pétroliers. Analyse des Acquis – Enseignements – Perspectives.
Miankeol, D., 2010. Vivre avec le pétrole. Etude sur les conditions de vie des villages en zone pétrolière de Doba au Tchad. Groupe Ressources pour la Paix, Rapport
Munasib, A. and Rickman, D. S., 2015. Regional economic impacts of the shale gas and tight oil boom: A synthetic control analysis. Regional Science and Urban Economics 50 (2015) 1–17
Postali, F. A. S., and Nishijima, M., 2013. Oil windfalls in Brazil and their long-run social impacts. Resources Policy, 38(1), 94-101.
Ravallion, M., 2008. Evaluating anti-poverty programs. Development Research Group, the World Bank, Handbook of Development Economics, Chapter 9Volume 4, pp. 3815-3823
Sala-i-Martin, X. and A. Subramanian, 2004. Addressing the Natural Resource Curse: An Illustration from Nigeria. NBER Working Paper No. 9804 (June)
Segal, P., 2011. Resource Rents, Redistribution, and Halving Global Poverty: The Resource Dividend. World Development, Vol. 39, N° 4, P. 475-489
Seignobos, C. et Madjigoto, R., 2005. Le prix des «arbres sauvages»: Petite chronique des compensations du consortium ESSO aux paysans Tchadiens. Armand Colin/Dunod, Annales de géographie 2005/6 - n° 646, pages 643 à 663
21
Sikod, F., Djal‐Gadom, G. et Fotuè Totouom, A. L., 2013. Soutenabilité Economique d‟une Ressource Epuisable: Cas du Pétrole Tchadien. African Development Review, Vol. 25, No. 3, 2013, 344–357
Slaibe Postali, F. A., 2009. Petroleum royalties and regional development in Brazil: The economic growth of recipient towns. Resources Policy 34 (2009) 205–213
Tulipe, S., 2004. Le bassin Tchadien à l‟épreuve de l‟or noir: Réflexions sur la «nouvelle donne pétro-politique » en Afrique centrale. Editions Karthala | Politique africaine ; 2004/2 - N° 94, pages 59 à 81
Weinstein A. L., 2012. Local Labor Market Restructuring in Shale Booms. The Ohio State University, Department of Agricultural, Environmental, and Development Economics
i
Appendix
Appendix 1: Number of Chadian workers involved in Oil Doba project
Note: Q1 first quarter; Q2: second quarter
Source: Data is collected from the project reports published by oil companies (Mantobaye, 2012)
Appendix 2: Allocation of oil revenues (2004-2012)
Source: GRAM-TC/CCSRP 500 2000 3500 5000 6500
Year Amount (CFA
francs)
Priority sectors’ share
Oil-producing
region’s share Public Treasury
Stabilization Account 2004 44 566 463 039 35 653 170 630 2 228 323 152 6 684 969 456 2005 117 297 222 982 93 837 778 386 5 864 861 147 17 594 583 445 2006 154 086 579 438 100 221 081 107 7 639 524 500 46 225 973 830 2007 132 509 639 842 82 114 000 467 6 625 481 993 39 752 891 953 4 017 265 431 2008 238 611 139 133 138 000 000 000 11 901 473 375 71 583 341 739 18 295 420 375 2009 86 964 663 088 71 527 031 008 4 348 233 155 26 089 398 926 -15 000 000 000 2010 185 445 154 107 101 064 750 107 9 272 257 705 75 633 546 232 -525 399 830 2011 230 948 475 458 114 741 600 000 11 547 423 772 69 284 542 638 35 374 909 047 2012 256 532 057 383 243 705 454 515 12 826 602 869 0 0 TOTAL 1 446 961 394 470 771 606 930 743 59 427 578 800 352 849 248 220 42 162 195 023
ii
Appendix 3: Variation of millet prices in region of Logone oriental (1997-2011)
Period Before oil project (1997) During pipeline construction period (1999-2003) 2008 2009 2011 Prices (CFA francs) 4,000 – 5,000 25,000 – 30,000 10,000 – 13,000 12,000 – 13,000 10,000 – 12,500
Source: Hoinathy (2013), Page 133
Appendix 4: Compensation rates for fields destroyed
Type of crop Amount by cord (CFA francs) Comments Cotton with Coton-Tchad contract 189,000 Legal tariff
Traditional Cotton 402,274 Actual tariff
Crop 402,274 Actual tariff
Pepper in field crop 463 FCFA francs/m2 Actual tariff Vegetable Growing 463 FCFA francs/m2
Cotton/Crop 402,274 Proportion to field areas
Rice 402,274 Actual tariff
Fields to lie fallow or prepared 402,274 Actual tariff
Source: Hoinathy (2013), Page 242 (1 cord = 71 * 71 meter)
Appendix 5: Compensation rates for felled trees
Species Categories Tariff (CFA Francs)
Productive sapling No productive Productive
Mango Mango tree 5,000 30,000 550,000
Shea Wild fruit 5,000 27,000 162,000
Nere Wild fruit 5,000 44,000 263,000
Tamnind Wild fruit 5,000 18,000 109,000
Lime fruit trees 5,000 22,000 72,500
Orange fruit trees 5,000 22,000 72,500
Grapefruit Fruit trees 5,000 22,000 72,500
Guava Fruit trees 5,000 9,750 32,500
Banana Fruit trees 2,900 2,900 2,900
Papaya fruit trees 4,000 4,000 8,000
Other other 5,000 5,000 30,000
Shade other 5,000 5,000 30,000
Lemon fruit trees 5,000 22,000 72,500
Avocado fruit trees 5,000 5,000 30,000
Ronier fruit trees 5,000 14,500 87,000
Gmelina other 5,000 5,000 30,000
Gum arabic other 5,000 15,000 50,000
Mahogany other 5,000 45,000 80,000
Prosopus other 5,000 76,000 455,000
Apple cinnamone fruit trees 5,000 7,500 25,000
iii