HAL Id: hal-00671849
https://hal.archives-ouvertes.fr/hal-00671849
Submitted on 19 Feb 2012
HAL is a multi-disciplinary open access
archive for the deposit and dissemination of
sci-entific research documents, whether they are
pub-lished or not. The documents may come from
teaching and research institutions in France or
abroad, or from public or private research centers.
L’archive ouverte pluridisciplinaire HAL, est
destinée au dépôt et à la diffusion de documents
scientifiques de niveau recherche, publiés ou non,
émanant des établissements d’enseignement et de
recherche français ou étrangers, des laboratoires
publics ou privés.
Zenith distribution and flux of atmospheric muons
measured with the 5-line ANTARES detector
J.A. Aguilar, A. Albert, G. Anton, S. Anvar, M. Ardid, A.C. Assis Jesus, T.
Astraatmadja, J-J. Aubert, R. Auer, B. Baret, et al.
To cite this version:
J.A. Aguilar, A. Albert, G. Anton, S. Anvar, M. Ardid, et al.. Zenith distribution and flux of
atmo-spheric muons measured with the 5-line ANTARES detector. Astroparticle Physics, Elsevier, 2010,
34 (3), pp.179-184. �10.1016/j.astropartphys.2010.07.001�. �hal-00671849�
Accepted Manuscript
Zenith distribution and flux of atmospheric muons measured with the 5-line
ANTARES detector
J.A. Aguilar, A. Albert, G. Anton, S. Anvar, M. Ardid, A.C. Assis Jesus, T.
Astraatmadja, J-J. Aubert, R. Auer, B. Baret, S. Basa, M. Bazzotti, V. Bertin, S.
Biagi, C. Bigongiari, M. Bou-Cabo, M.C. Bouwhuis, A.M. Brown, J. Brunner,
J. Busto, F. Camarena, A. Capone, G. Carminati, J. Carr, D. Castel, E. Castorina,
V. Cavasinni, S. Cecchini, Ph. Charvis, T. Chiarusi, M. Circella, R. Coniglione,
H. Costantini, N. Cottini, P. Coyle, C. Curtil, G. De Bonis, M.P. Decowski, I.
Dekeyser, A. Deschamps, C. Distefano, C. Donzaud, D. Dornic, D. Drouhin, T.
Eberl, U. Emanuele, J-P. Ernenwein, S. Escoffier, F. Fehr, V. Flaminio, K.
Fratini, U. Fritsch, J-L. Fuda, G. Giacomelli, J.P. Gómez-González, K. Graf, G.
Guillard, G. Halladjian, G. Hallewell, H. van Haren, A.J. Heijboer, Y. Hello,
J.J. Hernández-Rey, J. Hößl, M. de Jong, N. Kalantar-Nayestanaki, O. Kalekin,
A. Kappes, U. Katz, P. Kooijman, C. Kopper, A. Kouchner, W. Kretschmer, R.
Lahmann, P. Lamare, G. Lambard, G. Larosa, H. Laschinsky, D. Lefèvre, G.
Lelaizant, G. Lim, D. Lo Presti, H. Loehner, S. Loucatos, F. Lucarelli, K. Lyons,
S. Mangano, M. Marcelin, A. Margiotta, J.A. Martinez-Mora, G. Maurin, A.
Mazure, M. Melissas, T. Montaruli, M. Morganti, L. Moscoso, H. Motz, C.
Naumann, M. Neff, R. Ostasch, D. Palioselitis, G.E. Păvălaş, P. Payre, J.
Petrovic, P. Piattelli, N. Picot-Clemente, C. Picq, R. Pillet, V. Popa, T. Pradier,
E. Presani, C. Racca, A. Radu, C. Reed, C. Richardt, M. Rujoiu, G.V. Russo, F.
Salesa, P. Sapienza, F. Schöck, J-P. Schuller, R. Shanidze, F. Simeone, M.
Spurio, J.J.M. Steijger, Th. Stolarczyk, M. Taiuti, C. Tamburini, L. Tasca, S.
Toscano, B. Vallage, V. Van Elewyck, M. Vecchi, P. Vernin, G. Wijnker, E. de
Wolf, H. Yepes, D. Zaborov, J.D. Zornoza, J. Zúñiga
PII:
S0927-6505(10)00124-6
DOI:
10.1016/j.astropartphys.2010.07.001
Reference:
ASTPHY 1508
To appear in:
Astroparticle Physics
Received Date:
5 February 2010
Revised Date:
28 June 2010
Accepted Date:
2 July 2010
ACCEPTED MANUSCRIPT
Please cite this article as: J.A. Aguilar, A. Albert, G. Anton, S. Anvar, M. Ardid, A.C.A. Jesus, T. Astraatmadja,
J-J. Aubert, R. Auer, B. Baret, S. Basa, M. Bazzotti, V. Bertin, S. Biagi, C. Bigongiari, M. Bou-Cabo, M.C. Bouwhuis,
A.M. Brown, J. Brunner, J. Busto, F. Camarena, A. Capone, G. Carminati, J. Carr, D. Castel, E. Castorina, V.
Cavasinni, S. Cecchini, Ph. Charvis, T. Chiarusi, M. Circella, R. Coniglione, H. Costantini, N. Cottini, P. Coyle, C.
Curtil, G. De Bonis, M.P. Decowski, I. Dekeyser, A. Deschamps, C. Distefano, C. Donzaud, D. Dornic, D. Drouhin,
T. Eberl, U. Emanuele, J-P. Ernenwein, S. Escoffier, F. Fehr, V. Flaminio, K. Fratini, U. Fritsch, J-L. Fuda, G.
Giacomelli, J.P. Gómez-González, K. Graf, G. Guillard, G. Halladjian, G. Hallewell, H. van Haren, A.J. Heijboer,
Y. Hello, J.J. Hernández-Rey, J. Hößl, M. de Jong, N. Kalantar-Nayestanaki, O. Kalekin, A. Kappes, U. Katz, P.
Kooijman, C. Kopper, A. Kouchner, W. Kretschmer, R. Lahmann, P. Lamare, G. Lambard, G. Larosa, H.
Laschinsky, D. Lefèvre, G. Lelaizant, G. Lim, D.L. Presti, H. Loehner, S. Loucatos, F. Lucarelli, K. Lyons, S.
Mangano, M. Marcelin, A. Margiotta, J.A. Martinez-Mora, G. Maurin, A. Mazure, M. Melissas, T. Montaruli, M.
Morganti, L. Moscoso, H. Motz, C. Naumann, M. Neff, R. Ostasch, D. Palioselitis, G.E. Păvălaş, P. Payre, J.
Petrovic, P. Piattelli, N. Picot-Clemente, C. Picq, R. Pillet, V. Popa, T. Pradier, E. Presani, C. Racca, A. Radu, C.
Reed, C. Richardt, M. Rujoiu, G.V. Russo, F. Salesa, P. Sapienza, F. Schöck, J-P. Schuller, R. Shanidze, F. Simeone,
M. Spurio, J.J.M. Steijger, Th. Stolarczyk, M. Taiuti, C. Tamburini, L. Tasca, S. Toscano, B. Vallage, V. Van
Elewyck, M. Vecchi, P. Vernin, G. Wijnker, E. de Wolf, H. Yepes, D. Zaborov, J.D. Zornoza, J. Zúñiga, Zenith
distribution and flux of atmospheric muons measured with the 5-line ANTARES detector, Astroparticle Physics
(2010), doi:
10.1016/j.astropartphys.2010.07.001
This is a PDF file of an unedited manuscript that has been accepted for publication. As a service to our customers
we are providing this early version of the manuscript. The manuscript will undergo copyediting, typesetting, and
review of the resulting proof before it is published in its final form. Please note that during the production process
errors may be discovered which could affect the content, and all legal disclaimers that apply to the journal pertain.
ACCEPTED MANUSCRIPT
Zenith distributio n a nd flux o f a tmo spheric muo ns mea sured w ith the 5 -line
ANT AR ES detecto r
ANTARES C ollab oration
J.A. Aguilar1, A. Alb ert2, G. Anton3, S . Anvar4, M. Ardid5, A.C . Assis Jesus6, T. Astraatmadja6,1, J-J.
Aub ert7, R. Auer3, B . B aret8, S . B asa9, M. B az z otti10 ,11, V. B ertin7, S . B iagi10 ,11, C . B igongiari1, M.
B ou-C ab o5, M.C . B ouw h uis6, A. M. B row n7, J. B runner7,2, J. B usto7, F . C amarena5, A. C ap one12,13, G.
C arminati10 ,11, J. C arr7, D. C astel2, E. C astorina14,15, V. C avasinni14,15, S . C ecch ini11,16, Ph . C h arvis17,
T. C h iarusi11, M. C ircella18, R. C oniglione19, H. C ostantini20, N. C ottini21, P. C oyle7, C . C urtil7, G. De
B onis12,13, M.P. Decow ski6, I. Dekeyser22, A. Desch amp s17, C . Distefano19, C . Donz aud8,23, D. Dornic7,1,
D. Drouh in2, T. Eb erl3, U. Emanuele1, J-P. Ernenw ein7, S . Escoffi er7, F . F eh r3, V. F laminio14,15, K.
F ratini24,20, U. F ritsch3, J-L. F uda22, G. Giacomelli10 ,11, J.P. G´omez -Gonz ´alez1, K. Graf3, G. Guillard25,
G. Halladjian7, G. Hallew ell7, H. van Haren26, A.J. Heijb oer6, Y. Hello17, J.J. Hern´andez -Rey1, J. H¨oß l3,
M. de Jong6,1, N. Kalantar-Nayestanaki27, O . Kalekin3, A. Kap p es3, U. Katz3, P. Kooijman6,28,29, C .
Kop p er3, A. Kouch ner8, W. Kretsch mer3, R. Lah mann3, P. Lamare4, G. Lamb ard7, G. Larosa5, H.
Lasch insky3, D. Lef`evre22, G. Lelaiz ant7, G. Lim6,29, D. Lo Presti30, H. Loeh ner27, S . Loucatos21, F .
Lucarelli12,13, K. Lyons25, S . Mangano1, M. Marcelin9, A. Margiotta∗,10 ,11, J.A. Martinez -Mora5, G.
Maurin21, A. Maz ure9, M. Melissas7, T. Montaruli18,31, M. Morganti14,15, L. Moscoso21,8, H. Motz3, C .
Naumann21, M. Neff3, R. O stasch3, D. Palioselitis6, G.E.P˘av˘ala¸s32, P. Payre7, J. Petrovic6, P. Piattelli19,
N. Picot-C lemente7, C . Picq21, R. Pillet17, V. Pop a32, T. Pradier25, E. Presani6, C . Racca2, A. Radu32, C .
Reed7,6, C . Rich ardt3, M. Rujoiu32, G.V. Russo30, F . S alesa1, P. S ap ienz a19, F . S ch ¨ock3, J-P. S ch uller21,
R. S h anidz e3, F . S imeone13, M. S p urio10 ,11, J.J.M. S teijger6, Th . S tolarcz yk21, M. Taiuti24,20, C .
Tamb urini22, L. Tasca9, S . Toscano1, B . Vallage21, V. Van Elew yck8, M. Vecch i12, P. Vernin21, G.
Wijnker6, E. de Wolf6,29, H. Yep es1, D. Z ab orov33, J.D. Z ornoz a1, J. Z ´u˜niga1
1IFIC - Institu to de F´ısica Corp u sc u lar, Edific ios Inv e stig ac i´on de P ate rna, CSIC - Univ e rsitat de Val`e nc ia, Ap do. de Correos
22085, 46071 Vale nc ia, Sp ain
2GRP HE - Institu t u niv e rsitaire de tec hnolog ie de Colmar, 34 ru e du Grille nb re it BP 50568 - 68008 Colmar, France 3Friedric h-Ale x ande r-Univ e rsit¨at Erlang e n-N¨u rnbe rg , Erlang e n Ce ntre for Astrop artic le P hysic s, Erw in-Romme l-Str. 1, 91058
Erlang e n, Ge rmany
4Direc tion de s Sc ie nce s de la Mati`e re - Institu t de rec he rc he su r le s lois fondame ntale s de l’Univ e rs - Se rv ice d’Elec troniq u e de s
D´e tec te u rs e t d’Informatiq u e , CEA Sac lay, 91191 Gif-su r-Yv e tte Cede x , France
5Institu t d’Inv e stig ac i´o p e r a la Ge sti´o Integ rada de Zone s Costane re s (IGIC) - Univ e rsitat P olit`e c nica de Val`e nc ia. C/
P aranimf, 1. E-46730 Gandia, Sp ain.
6FOM Institu u t v oor Su batomaire Fysica Nik he f, Sc ie nce P ark 105, 1098 X G Amste rdam, T he Ne the rlands 7CP P M - Ce ntre de P hysiq u e de s P artic u le s de Marse ille , CNRS/IN2P 3 e t Univ e rsit´e de la M´e dite rran´e e , 163 Av e nu e de
L u miny, Case 902, 13288 Marse ille Cede x 9, France
8AP C - L aboratoire AstroP artic u le e t Cosmolog ie , UMR 7164 (CNRS, Univ e rsit´e P aris 7 Dide rot, CEA, Ob se rv atoire de P aris)
10, ru e Alice Domon e t L ´e onie Du q u e t 75205 P aris Cede x 13, France
9L AM - L aboratoire d ’ Astrop hysiq u e de Marse ille , P ˆole de l ’ ´Etoile Site de Ch? teau -Gombe rt, ru e Fr´e d´e ric J oliot-Cu rie 38,
13388 Marse ille cede x 13, France
10Dip artime nto di Fisica de ll’Univ e rsit`a, Viale Be rti P ic hat 6/2, 40127 Bolog na, Italy 11INFN - Se zione di Bolog na, Viale Be rti P ic hat 6/2, 40127 Bolog na, Italy 12
Dip artime nto di Fisica de ll’Univ e rsit`a L a Sap ie nza, P .le Aldo Moro 2, 00185 Roma, Italy
13
INFN -Se zione di Roma, P .le Aldo Moro 2, 00185 Roma, Italy
14
Dip artime nto di Fisica de ll’Univ e rsit`a, L arg o B. P ontecorv o 3, 56127 P isa, Italy
15
INFN - Se zione di P isa, L arg o B. P ontecorv o 3, 56127 P isa, Italy
16
INAF-IASF, v ia P . Gobe tti 101, 40129 Bolog na, Italy
17
G´e oazu r - Univ e rsit´e de Nice Sop hia-Antip olis, CNRS/INSU, IRD, Ob se rv atoire de la Cˆote d’Azu r and Univ e rsit´e P ie rre e t Marie Cu rie , F-06235, BP 48, Ville franc he -su r-me r, France
ACCEPTED MANUSCRIPT
19INFN - Laboratori Nazionali del Sud (LNS), Via S. Sofia 62, 95123 Catania, Italy 20INFN - Sezione di Genova, Via Dodecaneso 33, 16146 Genova, Italy 21
Direction des Sciences de la Mati`ere - Institut de recherche sur les lois fondamentales de l’Univers - Service de Physique des Particules, CEA Saclay, 91191 Gif-sur-Yvette Cedex, France
22
COM - Centre d’Oc´eanologie de Marseille, CNRS/INSU et Universit´e de la M´editerran´ee, 163 Avenue de Luminy, Case 901, 13288 Marseille Cedex 9, France
23
Universit´e Paris-Sud 11 - D´epartement de Physique - F - 91403 Orsay Cedex, France
24
Dipartimento di Fisica dell’Universit`a, Via Dodecaneso 33, 16146 Genova, Italy
25IPHC-Institut Pluridisciplinaire Hubert Curien - Universit´e de Strasbourg et CNRS/IN2P3 23 rue du Loess -BP 28- F67037
Strasbourg Cedex 2
26Royal Netherlands Institute for Sea Research (NIOZ), Landsdiep 4,1797 SZ ’t Horntje (Texel), The Netherlands 27K ernfysisch Versneller Instituut (K VI), University of Groningen, Zernikelaan 25, 9747 AA Groningen, The Netherlands
28Universiteit Utrecht, Faculteit Betawetenschappen, Princetonplein 5, 3584 CC Utrecht, The Netherlands
29Universiteit van Amsterdam, Instituut voor Hoge-Energie Fysika, Science Park 105, 1098 XG Amsterdam, The Netherlands 30Dipartimento di Fisica ed Astronomia dell’Universit`a, Viale Andrea Doria 6, 95125 Catania, Italy
31University of Wisconsin - Madison, 53715, WI, USA 32Institute for Space Sciences, R-77125 Bucharest, M˘agurele, Romania
33ITEP - Institute for Theoretical and Experimental Physics, B. Cheremushkinskaya 25, 117218 Moscow, Russia
Abs tr act
The ANTARES high energy neutrino telescope is a three-dimensional array of about 900 photomultipliers distributed over 12 mooring lines installed in the Mediterranean Sea. Between February and November 2007 it acquired data in a 5 -line confi guration. The zenith angular distribution of the atmospheric muon fl ux and the associated depth-intensity relation are measured and compared with previous measurements and Monte Carlo expectations. An evaluation of the systematic effects due to uncertainties on environmental and detector parameters is presented.
Key words: atmospheric muons, neutrino telescope, depth-intensity relation
1. Intr oduction
The ANTARES collaboration has recently completed the construction of a neutrino telescope in the Northern Hemisphere. Its location is about 4 0 km off the coast of Toulon, France, at a depth of 24 75 m in the Mediterranean Sea (4 2◦4 8 ’N, 6◦10’E). The main goal of the experiment is the search for high-energy
neutrinos from astrophysical sources such as Active Galactic Nuclei, microquasars, supernova remnants and gamma-ray bursters. A neutrino telescope in the Northern hemisphere includes the Galactic Centre in its fi eld of view and is complementary to the AMANDA and IceCube Antarctic telescopes [1]. Neutrinos are ob-served indirectly via the detection of the Cherenkov light emitted along the trajectory of high energy charged particles emerging from neutrino interactions. The Cherenkov light is collected by light sensors (photomul-tipliers - PMTs) distributed in a three-dimensional array. The PMTs are arranged on twelve vertical lines. The fi rst detection line was deployed in February 2006 and a second became operational in October of the same year. Three more lines were connected in January 2007 and fi ve more in December 2007. The ap-paratus reached its complete confi guration when the last two lines were deployed and connected in May 2008 . The telescope is optimised for the detection of muon neutrinos, since muons resulting from charged current interactions can travel kilometres and are almost collinear with the parent neutrinos at energies above 1 TeV. The technique relies on discriminating upward-going neutrino-induced muons from the fl ux of downward-going atmospheric muons, which represent the majority of events in the ANTARES detector.
∗Corre sp on d in g a u th or
Email ad d re ss: Annarita.Margiotta@bo.infn.it(A. M a rg iotta )
1Also a t Univ ersity o f Leid en, the Netherla nd s
2On lea v e a t D E SY, P la ta nena llee 6, D -15738 Z euthen, G erm a ny
ACCEPTED MANUSCRIPT
Atmospheric muons are produced mainly by the decay of charged pions and kaons resulting from the inter-action of high energy cosmic rays with atomic nuclei in the atmosphere. Although they are a background for neutrino detection, the atmospheric muons are useful to verify the detector response.
This paper reports on the determination of the zenith angular distribution and on the measurement of the flux of atmospheric muons using data taken between February and November 2007 when the detector comprised 5 lines. The experimental results are compared with atmospheric muon flux simulations, with previous ANTARES measurements obtained with the first detector line [2] and with the results of a low energy event selection [3].
2. E xp erim ental setup and data selection
The full ANTARES detector consists of 12 flexible lines, each with a total height of 450 m, separated by distances of 60-70 m from each other. They are anchored to the sea bed and kept near vertical by buoys at the top of the line. Each line carries a total of 75 10” Hamamatsu PMTs housed in glass spheres, the optical modules (OM) [4], arranged in 25 storeys (3 optical modules per storey) separated by 14.5 m, starting 100 m above the sea floor. Each PMT is oriented 45◦ downward with respect to the vertical. A titanium cylinder
in each storey houses the electronics for readout and control, together with compasses and tiltmeters used to measure the heading and the inclination of the storeys. To reconstruct the neutrino direction with high precision a good knowledge of PMT position and of hit arrival times is necessary. The positions of the optical modules are measured by a system of acoustic transponders and receivers distributed over the lines and on the sea bed. A system of LED beacons housed in some of the storeys and a laser beacon located at the bottom of two of the lines are used for timing calibration [5]. The PMT signals are digitized by a custom built ASIC chip. For analog pulses which are larger than a preset threshold, typically 1/ 3 photoelectron (p.e.), the arrival time and the integrated charge of the pulse are measured (referred to as L0 hit) and the corresponding data are sent to shore. The data stream is processed by a computer farm in the shore station which searches for different physics signals according to predefined trigger conditions. The DAQ system is described in detail in Ref. [6].
During the 5-line data taking period, the trigger algorithm required at least 5 causally connected L1 hits, where an L1 hit is defined either as 2 L0 hits in coincidence within 20 ns in two optical modules on the same storey or as a single L0 hit with an amplitude larger than 3 p.e.
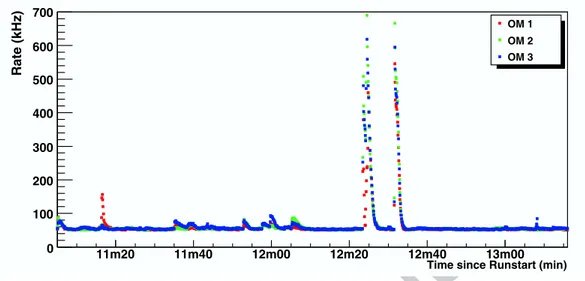
In Figure 1 the typical counting rate registered by an optical module is shown. It is characterized by a minimum constant rate, the so called baseline rate, originating from 40K decay and bioluminescent
bacte-ria. Superimposed on the baseline are occasional bursts, of a few second duration, attributed to luminous emission by macro-organisms.
For this analysis, only runs fulfilling the following quality criteria are selected: i) at least 300 out of 375 installed optical modules are active during a run (80% ); ii) the baseline rate is below 120 kHz; iii) the burst fraction is less than 20% . The burst fraction is defined as the fraction of time during which the instantaneous optical background rate exceeds the baseline rate by at least 20% . With this selection the active detector time was about 90 effective days, during which more than 107atmospheric muon triggers were collected.
3. Analysis chain
The analysis chain comprises the simulation of the underwater muon flux induced by the interaction of the primary cosmic rays in the atmosphere, the simulation of the Cherenkov light in the instrumented volume and the reconstruction of the muon tracks starting from the detected or simulated signals.
ACCEPTED MANUSCRIPT
Time since Runstart (min)
11m20 11m40 12m00 12m20 12m40 13m00 Rate (kHz) 0 100 200 300 400 500 600 700 OM 1 OM 2 OM 3
Figure 1 : T y pic al c ounting rates in three optic al m odules of a detec tor line storey .
3.1. S imu lation of the u nderwater mu on fl u x
Two different methods are used to describe the atmospheric muon flux reaching the detector.
The first approach is a Monte Carlo simulation based on CORSIKA version 6.2 [7]. Two different models have been considered for the description of hadronic interactions: QGSJET.01 [8] and SIBYLL [9]. Showers were simulated over an energy range from 1 to 105 TeV/nucleon and zenith angles between 0◦ and 85◦.
For zenith angles larger than 70◦ the curvature of the atmosphere is taken into account. Five mass groups
(p, He, CNO, Mg-Si and Fe) are generated with an energy spectrum proportional to E−2. More than 1010
air showers induced by primary cosmic ray nuclei were simulated with QGSJET.01. This corresponds to a detector live time ranging from few days to few years depending on the primary mass, its angle and energy. A smaller sample was simulated with SIBYLL, mainly to evaluate the effect of a different choice of the hadronic interaction model. Muons reaching the sea level with energies larger than 500 GeV are propagated through sea water to the detector with the MUSIC package [10]. The Monte Carlo events are weighted according to two different primary cosmic ray spectra : the H¨orandel/poly-gonato model (with rigidity dependent knee energies) [11] and the NSU model [12, 13]. Both are based on experimental results, combining direct measurements and results from extensive air shower arrays. Note that in the energy range relevant for us (10 - few hundred TeV) the two all-particle spectra differ by about 30%.
The second approach uses a Monte Carlo event generator based on a parametrized description of the underwater muon flux (MUPAGE) [14]. The flux, the angular distribution, the multiplicity and the energy spectrum of muons are obtained from parametric formulae [15]. A number of showers corresponding to one month of live time has been generated.
3.2. L ight produ ction and detector simu lation
All muons reaching the detector depth with an energy above 20 GeV are transported through the detector active volume using MUSIC. As the number of photons emitted along the muon trajectory is large, the simulation of the light production is very time consuming. For this reason, a set of tables storing amplitude and time of Cherenkov photons hitting the PMTs is created. They are constructed taking into account the water properties at the ANTARES site (light absorption length and scattering model), the characteristics of the optical modules (geometry and efficiency) and the position, distance and orientation of an optical module with respect to a given muon track or electromagnetic shower. The optical background is taken from
ACCEPTED MANUSCRIPT
Zenith : 130.5 Fit on 5 line(s) time (nsec) −1000 −500 0 500 1000 1500 2000 height (m) 0 50 100 150 200 250 300 350 400 450 500 Line 1 time (nsec) −1000 −500 0 500 1000 1500 2000 height (m) 0 50 100 150 200 250 300 350 400 450 500 Line 2 Run 30169 Frame 166220 Sat Nov 3 19:28:01 2007 Trigger bits 80000021Line 1−5 Physics Trigger
(L0=.3,L1=3,HRV=500,+GC,mi 1 2 3 4 5 6 photons time (nsec) −1000 −500 0 500 1000 1500 2000 height (m) 0 50 100 150 200 250 300 350 400 450 500 Line 5 time (nsec) −1000 −500 0 500 1000 1500 2000 height (m) 0 50 100 150 200 250 300 350 400 450 500 Line 3 time (nsec) −1000 −500 0 500 1000 1500 2000 height (m) 0 50 100 150 200 250 300 350 400 450 500 Line 4
Figure 2 : A downgoing track , reconstructed using all 5 lines. In each display, the curv e shows the reconstructed muon track , i.e. the z position of the Cherenk ov cone, at the x-y position of the corresponding line, as a function of time. H oriz ontal axis: time in nanoseconds; v ertical axis: height ab ov e the sea-b ed in metres. Crosses are hits in a time window of 3 microseconds around the trigger; full circles are hits passing the trigger condition (see S ection 2 ); open b oxes are hits used in the final fit.
the actual counting rate observed in the data. Dead channels and the efficiencies of the front-end electronics are also taken into account.
3.3. T rack R econstruction
A fit algorithm based on a chisquare-like minimization is used to reconstruct the tracks. It approximates each storey as a space point on a vertical detector line. The hits in the event are time ordered and merged on each storey if closer than 20 ns; in this case the time of the first hit on the storey is taken and the charges summed. In order to augment the weight of coincidences with respect to single high-charge pulses, the summed charge is further increased by 1 if the hits originate from different optical modules of the same storey. All hits, merged or single, having a minimal charge of 2.5 p.e. are defined as step-1 hits. Next, a search is made for clusters of step-1 hits by requiring the presence of two step-1 hits within 80 ns on two adjacent floors or within 160 ns on two next-to-adjacent floors. For lines having one or more such clusters, single L0 hits within the line are selected if they are causally connected to the cluster(s) of the line. The times and the positions of all selected hits on all lines are then used in a prefit of the track. The result of this prefit provides the starting values for the final chisquare minimization. This final fit yields two angles defining the track direction and the three coordinates of the track at a chosen time.
Monte Carlo studies indicate that this reconstruction strategy yields a resolution on the zenith angle of 0.7◦ for atmospheric muons. The assumption of a vertical detector line introduces a further uncertainty on
the reconstructed zenith angle. The sea currents registered during the selected data period induce displace-ments of the OMs from the nominal position which are smaller than one metre over 350 m height. This corresponds to an additional error of about 0.15◦.
An example of a downward going track, reconstructed in the data, is shown in Figure 2. The horizontal axis indicates hit time, while the vertical axis shows the height of the fired storey in metres. On this picture, crosses represent hits in a time window of 3 microseconds around the trigger, full circles indicate hits participating in the trigger and open boxes designate those hits which have been used in the fit.
ACCEPTED MANUSCRIPT
zenith (degree)
0 20 40 60 80 100 120 140 160 180
Reconstructed track rate (Hz/deg)
0 0.005 0.01 0.015 0.02 0.025 0.03 0 20 40 60 80 100 120 140 160 180
Figure 3: Z enith angle distribution of reconstructed tracks. Black points are the data. The dotted line is the MUP AG E Monte Carlo expectation. The solid line corresponds to the simulation with CO R SIK A + QG SJ E T and the NSU model of the primary cosmic ray fl ux; the dashed line is CO R SIK A + QG SJ E T with the “ poly-gonato” model. The dashed-dotted line refers to CO R SIK A + SIBYL L and the NSU model. The shadowed band represents the systematic uncertainty, with respect to the solid line. See text for details.
4. Zenith distribution
Figure 3 shows the zenith angle distribution of the reconstructed tracks. Each track represents a muon bundle, regardless of the real number of muons in the bundle. Only tracks reconstructed using hits on at least 6 floors are considered in this plot. The systematic errors on the Monte Carlo expectations are due to the uncertainties on the description of the detector, on the knowledge of the environmental parameters and on the primary cosmic ray composition and hadronic interaction models. The effect of the first two terms is shown as a grey band in Figure 3 and has been evaluated by repeating the Monte Carlo simulation described in Section 3.2 for various assumed input parameters.
The values of the ANTARES environmental parameters (light absorption and scattering) have been mea-sured during several sea campaigns, [16, 17, 18]. The uncertainty on the light absorption length in water is assumed to be ±10% over the whole wavelength spectrum and yields a variation of ±20% on the number of expected muon events.
The detection efficiency of an optical module is a function of the angle between its axis and the Cherenkov photon direction. The acceptance for photons impacting the PMT at small angles with respect to the PMT axis (i.e. head-on) is determined with an uncertainty of ±15%. This is the region of the angular acceptance mostly affecting the detection of upgoing neutrino induced muons. At large angles (i.e. glancing), where the OMs are mostly sensitive to downgoing atmospheric muons, the uncertainty is about ±30%. The global effect is a systematic uncertainty of +35%−30% on the reconstructed track rate expectation. The assumed PMT effective area is that provided in the manufacturer data sheets [19]. It takes into account the photocathode area, the collection and the quantum efficiencies. A study of40K decays observed in the ANTARES detector
indicates an uncertainty of ±10% on the PMT effective area [3] and results in a variation of about ±20% on the expected event number. Summing the contributions from the various environmental and detector related systematic uncertainties leads to an overall uncertainty on the total number of reconstructed tracks
ACCEPTED MANUSCRIPT
of+45%
−40%.
The reconstructed track rate is 1.52 Hz in the data. The expected track rate with the MUPAGE event generator is 1.55 Hz [14]. In the CORSIKA Monte Carlo samples, the reconstructed event rates are 1.1 Hz for QGSJET + NSU model [12], 0.76 Hz for the QGSJET + “ poly-gonato” model [11], 1.2 Hz for SIBYLL + NSU model. There is an important dependence of the Monte Carlo prediction on the hadronic interaction model used to describe the development of the air showers and on the energy spectra of primary cosmic rays. Within systematic uncertainties the measurements cannot distinguish between the models considered.
5. Depth-intensity relation for atmospheric muons
The 5-line data were used to determine the depth-intensity relation of atmospheric muons, i.e. the vertical muon flux versus depth, h, [20, 21]. Given the muon intensity, I(θ, ho), at a certain depth ho as a
function of direction θ, the vertical intensity of the muon flux as a function of depth underwater I(θ = 0, h) is calculated, using the relation:
I(θ = 0, h) = I(θ, ho) · |co s (θ)| · cc orr(θ) (1)
where h = ho/co s (θ) is the effective slant depth and cc orr(θ) is a geometrical correction factor which takes
into account the curvature of the Earth, [22, 23].
The underwater muon flux cannot be measured directly with the ANTARES detector (and in general with neutrino telescopes). It is calculated starting from the angular distribution of reconstructed tracks, multiplied by the average multiplicity of events, estimated with Monte Carlo methods, according to the following equation: I(θ, ho) = N (θ, ho) · µ(θ, ho) Aef f(θ) · T · ∆ Ω (θ) (2) where :
• N (θ, ho) is the number of tracks reconstructed in the angular bin around co s (θ). It is obtained from the
zenith angular distribution of all reconstructed tracks and is corrected to account for the trigger and reconstruction efficiencies, calculated with Monte Carlo simulations. An iterative unfolding procedure based on Bayes theorem was applied [24]; the resulting correction is small because of the good zenith angle resolution compared with the bin width.
• µ(θ, ho) is the mean muon multiplicity in the bundles, estimated from the MUPAGE simulation [15].
It ranges from 1.3 for vertical events to 1.1 for almost horizontal events. The CORSIKA Monte Carlo gives 7% smaller values.
• Aef f(θ) is the Monte Carlo computed effective area for muons at the θ angle.
• T and ∆ Ω (θ) are the live time for the selected data and the solid angle for the co s (θ) bin, respectively.
Figure 4 shows the atmospheric muon flux, I(θ, ho= 2000), computed at 2000 m depth. It is compared
with the MUPAGE simulation (solid line).
The measured muon flux, I(θ, ho), was finally transformed into the vertical muon flux using eq. (1).
The results are shown in Figure 5 (black points). Statistical errors are small and not visible on the plot. The error band represents the systematic uncertainties discussed in Section 4. Note, that with respect to the preliminary analysis described in ref. [20], the points are shown for the case no selection on the quality of the track fit is applied. Previous results published by ANTARES and a calculation obtained with a parametrization taken from [13] are also shown. All measurements agree within the systematic uncertainties with the model predictions. Several measurements from other underwater detectors are also shown for comparison.
ACCEPTED MANUSCRIPT
θ cos -1 -0.9 -0.8 -0.7 -0.6 -0.5 -0.4 -0.3 -0.2 -0.1 ) -1 sr -1 s -2 Muon flux (cm -12 10 -11 10 -10 10 -9 10 -8 10 -7 10Figure 4 : The flux of atmospheric muons at 2000 m depth (black points) as a function of the cosine of the zenith angle. The solid line is the expectation from the MUPAGE simulation. The grey band represents the systematic uncertainties on the measured flux.
Depth (m water equivalent)
2000 4000 6000 8000 10000 ) -1 sr -1 s -2 Vertical Intensity (cm -10 10 -9 10 -8 10 -7
10 ANTARES 5 lines-this analysis
ANTARES 1 line ANTARES 5 lines-low energy DIR param. AMANDA AMANDA-II BAIKAL DUMAND NESTOR NEMO
Figure 5: V ertical muon flux of atmospheric muons for the 5 line ANTARES data (black points) as a function of the slant
depth. Downward triangles show the results from line 1 data [2]. Full sq uares show the results obtained with a new method and a low muon energy event selection [3]. Expectation from Bugaev parametrization (dotted line) is superimposed [13]. A compilation of results obtained with other underwater detectors is shown: AMANDA [25], AMANDA-II [26 ] Baikal [27 ], DUMAND [28], NESTOR [29], NEMO [30] .
ACCEPTED MANUSCRIPT
6. C onclusions
Using the data collected with the first 5 lines of the ANTARES detector, the zenith angle distribution of atmospheric muon bundles and the vertical muon flux as a function of the water depth were measured. The results are compared with Monte Carlo expectations obtained with a complete Monte Carlo simulation chain and with a parameterized calculation of the underwater muon flux at the detector depth. The major sources of systematic uncertainties in Monte Carlos are the description of the angular dependence of the optical module efficiency and the theoretical models used to represent the primary cosmic ray composition and the hadronic interactions during the air shower development. The results of the present analysis are in agreement, within the systematic uncertainties, with the theoretical predictions and previous measurements.
Acknowledgments
The authors acknowledge the financial support of the funding agencies: Centre National de la Recherche Scientifique (CNRS), Commissariat `a l’Energie Atomique et aux ´energie alternatives (CEA), Agence National de la Recherche (ANR), Commission Europ´eenne (FEDER fund and Marie Curie Program), R´egion Alsace (contrat CPER), R´egion Provence-Alpes-Cˆote d’Azur, D´epartement du Var and Ville de La Seyne-sur-Mer, in France; Bundesministerium f¨ur Bildung und Forschung (BMBF), in Germany; Istituto Nazionale di Fisica Nucleare (INFN), in Italy; Stichting voor Fundamenteel Onderzoek der Materie (FOM), Nederlandse organisatie voor Wetenschappelijk Onderzoek (NWO), in the Netherlands; Council of the President of the Russian Federation for young scientists and leading scientific schools supporting grants, Russia; National Authority for Scientific Research (ANCS) in Romania; Ministerio de Ciencia e Innovaci´on (MICINN) and Prometeo of Generalitat Valenciana and MultiDark, in Spain. We also acknowledge the technical support of Ifremer, AIM and Foselev Marine for the sea operation and the CC-IN2P3 for the computing facilities.
R eferences
[1] M. Ackermann et al., (AMANDA/IceCube Collab.), Astrophys. J. 675 (2008) 1014. [2] M. Ageron et al., (ANTARES Collab.), Astropart. Phys. 31 (2009) 277.
[3] J. A. Aguilar et al., [ANTARES Collab.], Astropart. Phys. 33 (2010) 86. [4] P. Amram et al., (ANTARES Collab.) Nucl. Instrum. Meth. A 484 (2002) 369. [5] M. Ageron et al., (ANTARES Collab.), Nucl. Instrum. Meth. A578 (2007) 498. [6] J. A. Aguilar et al., (ANTARES Collab.), Nucl. Instrum. Meth. A570 (2007) 107.
[7] D. Heck et al., Report FZKA 6019 (1998), Forschungszentrum Karlsruhe; D. Heck and J. Knapp, Report FZKA 6097 (1998), Forschungszentrum Karlsruhe; http://www-ik3.fzk.de/ ˜ heck/corsika/physics description/corsika phys.html. [8] N.N. Kalmykov, S.S. Ostapchenko, Yad. Fiz. 56 (1993) 105; Phys. At. Nucl. 56 N3 (1993) 346.
[9] R.S. Fletcher, T.K. Gaisser, P. Lipari, and T. Stanev, Phys. Rev. D50 (1994) 5710; J. Engel, T.K. Gaisser, P. Lipari, and T. Stanev, Phys. Rev. D46 (1992) 5013.
[10] P. Antonioli et al., Astropart. Phys. 7 (1997) 357.
[11] J. H¨orandel, Astropart. Phys. 19 (2003) 193.
[12] S.I. Nikol’sky et al., Sov. Phys. JETP 60 (1984) 10. [13] E. V. Bugaev et al., Phys. Rev. D58 (1998) 05401.
[14] G. Carminati et al., Comput. Phys. Commun. 179 (2008) 915. [15] Y. Becherini et al., Astropart. Phys. 25 (2006) 1.
[16] P. Amram et al., (ANTARES Collab.), Astropart. Phys. 13 (2000) 127. [17] P. Amram et al., (ANTARES Collab.), Astropart. Phys. 19 (2003) 253. [18] J. A. Aguilar et al., (ANTARES Collab.), Astropart. Phys. 23 (2005) 131.
[19] http://sales.hamamatsu.com/assets/pdf/parts R/LARGE AREA PMT TPMH1286E05.pdf
[20] M. Bazzotti, Ph.D Thesis, Universit`a di Bologna, 2009; M. Bazzotti for the ANTARES Collab., Proc. of the 31st ICRC, Lodz 2009, arXiv:0911.3055 [astro-ph.HE].
[21] C. Picq, Ph.D Thesis, Universit´e Paris VII, 2009; Irfu report: Irfu-09-03-T. [22] P. Lipari, Astropart. Phys. 1 (1993) 195.
[23] T.K. Gaisser, Cosmic Rays and Particle Physics, Cambridge University Press (1990), Chapt.3.
[24] G. DAgostini, Nucl. Instr. Meth. A 362 (1995) 487; see alsohttp://hepunx.rl.ac.uk/adye/software/unfold/RooUnfold.html. [25] E. Andres et al., (AMANDA Collab.), Astropart.Phys. 13 (2000) 1.
[26] P. Desiati for AMANDA Collab., Proc. of the 28th ICRC, Tsukuba 2003. [27] I. A. Belolaptikov et al., (Baikal Collab.), Astropart. Phys. 7 (1997) 263. [28] J. Babson et al., (DUMAND Collab.), Phys. Rev. D42 (1990) 41.
ACCEPTED MANUSCRIPT
[29] G. Aggouras et al., (NESTOR Collab.), Astropart. Phys. 23 (2005) 377. [30] S. Aiello et al., (NEMO Collab.), Astropart. Phys. 33(2010)263.