HAL Id: hal-01524160
https://hal.archives-ouvertes.fr/hal-01524160
Submitted on 17 May 2017HAL is a multi-disciplinary open access archive for the deposit and dissemination of sci-entific research documents, whether they are pub-lished or not. The documents may come from teaching and research institutions in France or abroad, or from public or private research centers.
L’archive ouverte pluridisciplinaire HAL, est destinée au dépôt et à la diffusion de documents scientifiques de niveau recherche, publiés ou non, émanant des établissements d’enseignement et de recherche français ou étrangers, des laboratoires publics ou privés.
Bimolecular G-Quadruplex Folding Kinetics
Adrien Marchand, Rubén Ferreira, Hisae Tateishi-Karimata, Daisuke Miyoshi,
Naoki Sugimoto, Valérie Gabelica
To cite this version:
Adrien Marchand, Rubén Ferreira, Hisae Tateishi-Karimata, Daisuke Miyoshi, Naoki Sugimoto, et al.. Sequence and Solvent Effects on Telomeric DNA Bimolecular G-Quadruplex Folding Kinet-ics. Journal of Physical Chemistry B, American Chemical Society, 2013, 117 (41), pp.12391-12401. �10.1021/jp406857s�. �hal-01524160�
work see http://dx.doi.org/10.1021/jp406857s
Sequence and Solvent Effects on Telomeric DNA
Bimolecular G-Quadruplex Folding Kinetics
Adrien Marchand†,¶,$, Rubén Ferreira‡,#, Hisae Tateishi-Karimata§, Daisuke Miyoshi§,║, Naoki
Sugimoto§,║, Valérie Gabelica†,¶,$,*
† Physical Chemistry and Mass Spectrometry Laboratory, Department of Chemistry, University
of Liège, B-4000 Liège, Belgium.
¶ Univ. Bordeaux, Institut Européen de Chimie et Biologie (IECB), ARNA Laboratory, F-33600
Pessac, France
$ Inserm, U869, ARNA Laboratory, F-33000 Bordeaux, France.
‡ Department of Chemistry and Molecular Pharmacology, Institute for Research in Biomedicine
(IRB Barcelona), IQAC-CSIC, CIBER-BNN, Barcelona, Spain.
§ Frontier Institute for Biomolecular Engineering Research (FIBER), Konan University, Japan.
║ Faculty of Frontiers of Innovative Research in Science and Technology (FIRST), Konan
University, Japan.
# Present addresses: Chemical and Biological Engineering, Chalmers University of Technology, 41296 Gothenburg, Sweden and Department of Chemistry, Medicinal Chemistry, University of Gothenburg, 41296 Gothenburg, Sweden.
* Corresponding author: tel: +33-(0)5-4000.2940; fax: +33-(0)5-4000.3004; e-mail: v.gabelica@iecb.u-bordeaux.fr
ABSTRACT
Telomeric DNA sequences are particularly polymorphic: the adopted structure is exquisitely sensitive to the sequence and to the chemical environment, for example solvation. Dehydrating conditions are known to stabilize G-quadruplex structures, but information on how solvation influences the individual rates of folding and unfolding of G-quadruplexes remains scarce. Here, we used electrospray mass spectrometry for the first time to monitor bimolecular G-quadruplex formation from 12-mer telo12-meric strands, in the presence of common organic co-solvents (methanol, ethanol, isopropanol and acetonitrile). Based on the ammonium ion distribution, the total dimer signal was decomposed into contributions from the parallel and antiparallel structures, to obtain individual reaction rates, and the antiparallel G-quadruplex structure was found to form faster than the parallel one. A dimeric reaction intermediate, in rapid equilibrium with the single strands, was also identified. Organic co-solvents increase the stability of the final structures mainly by increasing the folding rates. Our quantitative analysis of reaction rate dependence on co-solvent percentage shows that organic co-solvent molecules can be captured or released upon G-quadruplex formation, highlighting that they are not inert with DNA. In contrast to the folding rates, the G-quadruplex unfolding rates are almost insensitive to solvation effects, but are instead governed by the sequence and by the final structure: parallel dimers dissociate slower than antiparallel dimers only when thymine bases are present at the 5’-end. These results contribute unraveling the folding pathways of telomeric G-quadruplexes. The solvent effects revealed here enlighten that G-quadruplex structure in dehydrated and molecularly crowded environments is modulated by the nature of co-solvent (e.g., methanol favors antiparallel structures) due to direct interactions, and by the time scale of the reaction, with > 200-fold acceleration of bimolecular G-quadruplex formation in the presence of 60% co-solvent.
Keywords: mass spectrometry, nucleic acids, telomeres, conformational changes, dehydration, circular dichroism spectroscopy,
INTRODUCTION
Guanine-rich nucleic acids can form particular structures called G-quadruplexes.1-3 The
statistical over-representation of G-quadruplex-prone sequences at specific locations in the genome suggests that their formation could be linked to particular cell functions or dysfunctions.4,5 For example, G-quadruplex formation in telomeric DNA, having repeated
sequences (TTAGGG)n in vertebrates, has been proposed to interfere with telomere capping
and cell division, and the targeting of telomeric G-quadruplexes with drugs has been proposed as an anticancer strategy.6
In G-quadruplexes, guanines form base tetrads, called G-quartets, via Hoogsteen hydrogen bonds, and cation coordination between the G-quartets crucially enhances the thermodynamic stability of the G-quadruplex. The common structural feature defining a G-quadruplex is the presence of at least two stacked G-quartets, but besides this common feature, G-quadruplexes are structurally very diverse. They can differ by the number of strands involved, strand orientation, and position of the connecting loops.2,3,7-9 The most stable structure depends on the
sequence, but even a single sequence can form several structures having very similar stabilities.7,10
The thermodynamic parameters that would allow predicting G-quadruplex structure and stability are therefore far from being completely understood.11 A very common approach to
unveil species in an ensemble is to perturb the equilibrium, for example by changing the temperature. Recent studies have shown that several species (or ensembles of species) have to be taken into account to describe equilibrium thermal denaturation of human telomeric G-quadruplexes.12-15 Besides temperature, G-quadruplex formation equilibria are very sensitive to
several other factors, such as the exact nucleic acid sequence (loop sequence, as well as the addition/suppression of bases at the 5’-end and 3’-end), the nature of the cations present in solution, or the presence of co-solutes. The effects of co-solutes have received particular attention, the original aim being to mimic cellular crowding conditions. In the case of human telomeric DNA, the addition of co-solutes such as PEG (polyethlene glycol) and Ficoll (hydrophilic polysaccharide) indeed causes a displacement of the equilibrium of towards parallel-stranded structures.16,17 Moreover, organic co-solvents like ethanol18,19 and
acetonitrile20,21, or ionic liquid media,22,23 were also found to favor of parallel G-quadruplexes,
and it is now commonly accepted that water release upon G-quadruplex formation is the main reason for the equilibrium displacement under dehydrated conditions.20,24,25
In contrast to the effects of dehydration on G-quadruplex formation equilibria, the effects on the kinetics of association/dissociation are not well documented. Kinetics studies are expected
to bring important insight into the reaction mechanisms. Hud recently showed that ionic liquid media dramatically slowed down intramolecular G-quadruplex formation of the human telomeric sequence, and this was attributed to the high viscosity of this medium.22 Here, we
studied the effects of dehydration in non-viscous solvents (methanol, ethanol, isopropanol and acetonitrile) on the formation of bimolecular G-quadruplexes consisting of two repeats of the human telomeric sequence. In potassium cations, the sequence d(TAGGGT)2 forms a mixture
of interconverting parallel and antiparallel structures.26,27 In ammonium cation, however, the
system is predominantly in single stranded form in 100% aqueous solution and displaced towards dimer formation in the presence of co-solvent, making it easy to detect and distinguish the single strand from the bimolecular G-quadruplex, using mass spectrometry (ESI-MS).28
Furthermore, as outlined below, the contribution from purely parallel-stranded structures was distinguished based on the ammonium ion distribution in the mass spectra. Finally, to get insight into the effects of sequence on the parallel/antiparallel structural preference in 100% aqueous and in dehydrated environments, we systematically studied the four possible 12-mer variants of the telomeric sequence: d(TTAGGG)2, d(TAGGGT)2, d(AGGGTT)2 and d(GGGTTA)2.
EXPERIMENTAL METHODS Oligonucleotides
All oligodeoxynucleotides were purchased from Eurogentec (Belgium) and used without further purification. The sequences were: d(TTAGGG)2, d(TAGGGT)2, d(AGGGTT)2 and
d(GGGTTA)2 (MW: 3756.5 Da). For all ESI-MS experiment, the sequence dT6 (monoisotopic
mass 1762.318 Da) was used as an internal standard for normalizing peak intensities. Ammonium acetate (BioUltra ∼5 M, for molecular biology) was provided by Fluka (Sigma-Aldrich NV/SA, Bornem, Belgium), Water was nuclease-free grade from Ambion (Applied Biosystems, Lennik, Belgium). Methanol, ethanol, 2-propanol and acetonitrile were provided by Biosolve, HPLC grade.
Circular Dichroism (CD)
CD spectra were recorded on a Jobin Yvon CD6 dichrograph using 1-cm path length quartz cells (Hellma, type No. 120-QS, France). The final concentration of single stranded oligonucleotide was 5 μM in a buffer containing 100 mM ammonium acetate. For each sample, three spectra were recorded from 220 to 350 nm with a scan rate of 0.25 nm/s.
Electrospray mass spectrometry (ESI-MS)
Electrospray mass spectrometry experiments were performed on a SYNAPT G1 HDMS (Waters, Manchester, UK) in negative ion mode The capillary voltage was set to -2.2 kV; cone voltage = 30 V; extraction cone = 4 V; source pressure (pirani reading) = 3.15 mbar; source and
desolvation temperatures = 40 °C and 60 °C, respectively; trap and transfer voltages = 6 V and 4 V, respectively. The ion mobility cell is filled with N2 at 0.531 mbar (pirani reading), and an
electric field is applied to the cell in the form of waves (wave height = 8 V) that pass through the cell at 300 m/s. The bias voltage for ion introduction into the IMS cell was 15 V.
To follow the kinetics of dimer formation, the samples were injected at a final strand concentration of 5 μM at a rate of 140 μL/h. All kinetics experiments are carried out with the sample at room temperature (22±1 °C). The kinetics of dimerization was tested in 20 %, 40%, and 60% volume percentage of co-solvent (methanol, ethanol, 2-propanol and acetonitrile), the rest of the solvent being aqueous ammonium acetate (100 mM). The single strands, water and co-solvent were pre-mixed, and the dimeric G-quadruplex formation was initiated by the addition of ammonium acetate. The mass spectral recording was started simultaneously with ammonium addition. The sample was homogenized and loaded into the 250-mL syringe, the spray was initiated as quickly as possible by manually pushing the syringe, and the flow rate was then stabilized at 140 μL/h. The time lapse between ammonium addition and spray stabilization is typically 1 min.
Water activity determination
The water activity in each solvent mixture, in the presence of ammonium acetate, was determined by the osmotic stressing method via freezing point depression osmometry using a Typ Dig. L osmometer (KNAUER, Berlin, Germany).
The logarithm of water activities (aw) is calculated from the measured osmolality (mmol/kg):
= (RT/Mw ) ln aXw (1)
where is the water potential, Mw is the molecular weight of water (0.018 kg/mol), R is the
gas constant [8.314 J mol–1K–1], and T is the temperature in Kelvin. The relationship between water potential and osmolality, assuming independence of the water potential on temperature, is calculated as follows:29
(in MPa) =osmolality (mmol kg-1) / –400 (2)
The water activity in the mole fraction scale (aXw) was converted into the water activity on the
molality scale (am
w) using equation (3):
RESULTS AND DISCUSSION
Distinguishing structural ensembles by ESI-MS
The method to quantitatively monitor the dimer formation kinetics by electrospray ion mobility spectrometry has been described in detail elsewhere.28 The folding of G-quadruplexes was
initiated by the addition of ammonium acetate to reach a 100 mM cation concentration. The relative response factors of the dimer vs. the single strand were evaluated using the internal standard method.30 The ratio between the response of the dimer (RDimer: sum of peak areas of
charge states 6-, 5- and 4-) and the response the single strand (RSingleStrand: sum of peak areas of
charge states 4- and 3-) did not vary significantly with the sequence or with the percentage of co-solvent, and hence that the response factors of the parallel and antiparallel structures seem identical within experimental error. The consensus value in our experiments was
RDimer/RSingleStrand = 1.24 ± 0.45.28 We also showed recently that, when electrosprayed in
moderately harsh conditions, the parallel dimer structure of d(TAGGGT)2 keeps its two
ammonium ions whereas other structures lose their ammonium ions more easily.28 Detailed
discussion of ammonium ion binding to G-quadruplexes and stability in the gas phase can be found elsewhere.28
Based on this observation, we devised here a method to further partition the total dimer concentration into two contributions, based on the ammonium ion distribution of the Dimer
5-peak, and we validated this method by comparison with circular dichroism (CD) spectra. d(TAGGGT)2 was previously reported to form two interconverting bimolecular
G-quadruplexes in K+: parallel-stranded and antiparallel-stranded conformations.26 The
parallel-stranded conformation contains exclusively anti-anti guanine stacking motifs, and is expected to display a Type-I CD spectrum (maximum at 260 nm, no peak at 295 nm), corresponding to the parallel conformation.31 The antiparallel-stranded conformation, in contrast, contains one
pair of G-quartets with anti/syn-syn stacking and one pair of G-quartets with and anti-syn/syn-anti stacking,26 and is therefore expected to display a Type-II CD spectrum (maxima at
260 nm and 295 nm), actually typical of a “hybrid” conformation.31
Our CD spectra in NH4+ and in the presence of co-solvents (Figure 1, left) are compatible with
these two structures as limiting cases. In the presence of 60% co-solvent, Type-II CD spectra (with characteristic maxima at both 265 and 295 nm) were obtained for d(GGGTTA)2 in all
conditions, whereas Type-I spectra (with a maximum at 265 nm) were obtained with d(TTAGGG)2 and d(TAGGGT)2. The situation for d(AGGGTT)2 was intermediate. In the
corresponding mass spectra, the proportion of 2-NH4 containing dimer followed the same trend,
the mass spectrometry signal of the dimer into two contributions based on the ammonium ion distribution is therefore grounded.
Our reaction model will assume that these structures are the two possible end points of the folding. The Type-I and Type-II dimers will be noted DI and DII, respectively. Based on the CD spectra, we assumed that d(GGGTTA)2 dimers formed only the Type-II dimer, and thus we
further hypothesized that, for a given solvent mixture, the relative peak areas in the ammonium distribution of [d(GGGTTA)2]25- (in blue in Figure 1) represent the signature of the Type-II
dimer DII. For the other sequences, the fraction of Type-I dimer, DI, is given by the proportion of the 2-NH4 peak minus the non-parallel contribution to the 2-NH4 peak, i.e. with Equation (4),
where NH is the area of the dimer peak containing n ammonium ions in the sequence of interest, and NH , is the area of the dimer peak containing n ammonium ions in the
same conditions for the sequence d(GGGTTA)2.
,
, , (4)
Notably, by this procedure it is possible to monitor the formation of the two types of dimer. Thus, kinetic parameters of the individual folding of the dimers can be evaluated, allowing us to get deeper insight into the complex folding mechanism of the human telomeric G-quadruplexes.
Figure 1. The structure formed after 1-day folding in 60/40 (v:v) EtOH/aqueous NH4OAc
100 mM depends on the sequence, and the ammonium ion distribution of the Dimer5- species
(mass spectra on the right) is correlated with the amount of parallel structure (peak at 265 nm in the CD spectra on the left). A = d(GGGTTA)2: the ammonium ion distribution is used to
calculate the last term of Equation (4). In B = d(AGGGTT)2, C = d(TAGGGT)2 and D =
d(TTAGGG)2, the fraction of parallel structure deduced from the mass spectra is given by
Bimolecular G-quadruplex formation mechanism
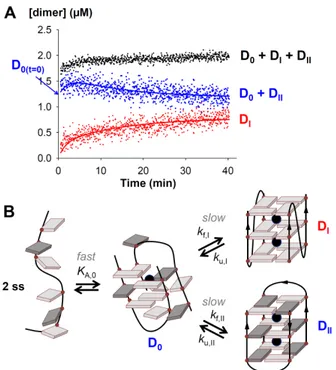
Representative quantitative results of kinetics experiments, partitioning the dimer into two contributions, are shown in Figure 2A and Figure 3. Supporting information Figure S1 shows the effect of co-solvent percentage on bimolecular quadruplex formation. In most cases, the temporal evolution shows that a significant amount of Type-II structure is already formed during the dead time of the experiment (≈ 1 min), whereas the Type-I structure forms on the time scale of the experiment (minutes to hours). The Type-II dimers can therefore be further partitioned into two ensembles, based on their kinetics of formation. The fast-forming ensemble will be noted D0. This kind of intermediate was not considered in Phan’s previous model,26 possibly because it cannot be distinguished from the single strands on the NMR time scale due to fast interconversion.
Several reaction mechanisms can be considered (ss stands for the single strand):
ss D0 (fast); ss DI (slow); ss DII (slow) (5a)
ss D0 (fast); D0 DI (slow); D0 DII (slow) (5b)
ss D0 (fast); ss DI (slow); D0 DII (slow) (5c)
ss D0 (fast); ss DII (slow); D0 DI (slow) (5d)
ss D0 (fast); D0 DII (slow); DII DI (slow) (6)
ss D0 (fast); D0 DI (slow); DI DII (slow) (7)
The program Dynafit 3 (BioKin Ltd., Watertown, MA)32, which numerically solves the set of
differential rate equations derived from a given model (see Supporting Information S2), was used to extract rate constants from evolution of the concentration of Type-I and Type-II dimer as a function of reaction time, and to evaluate the different models. Because D0 appears in fast equilibrium with the ss on the time scale of our experiments, mechanisms (5a-5d) fit the data in the same way (although they differ molecularly), and only the rates take different absolute values depending on the mechanism definition. While in most datasets DI forms slower than DII, it is the opposite in some datasets, depending on the sequence and the co-solvent. As a consequence, models (6) or (7) were not adequate to fit all the data, and were discarded.
Figure 2: (A) Example of data fitting (single strand: d(TAGGGT)2, dimer formation in 60%
iPrOH). (B) Bimolecular G-quadruplex formation model. The parallel (DI) and antiparallel (DII) G-quadruplex structures are represented according to Phan & Patel,26 with anti bases in light grey and syn bases in dark grey. The D0 ensemble represents a less well-ordered dimeric intermediate, which could contain G-quartets and cations.
Structurally speaking, rearrangement from DII to DI or vice versa does not necessarily require complete strand separation, and it makes sense to imagine that D0 can be an ensemble of ill-ordered bimolecular intermediate. Similar mechanisms involving incomplete strand and cation incorporation have been proposed previously for tetramolecular33,34 and intramolecular10,35-38
G-quadruplexes. Figure 2B shows the reaction model (Eq. 5b) chosen to fit all data, and the definition of the equilibrium and rate constants reported in the remaining of the text. We propose that D0 is in rapid equilibrium with the single strand ss, and that well-ordered G-quadruplexes DI and DII form more slowly from D0. The details of model implementation in Dynafit are given in Supporting Information S2. The fitting lines displayed in Figure 2A and Figure 3 were obtained using this model.
Experiments at different strand concentrations were carried out to demonstrate the model’s consistency. Simple second-order reactions can be confirmed by showing that 1/[SS] vs t plot are linear, However, the mechanism here is too complex (fast formation of D0, then parallel reactions having different rates) to enable us to derive an easy analytical solution to this kinetic problem. For this reason, we proofed the mechanism by running dynafit numerical simulations
on experiments performed as a function of the single stranded concentration (Supporting Information S3).
Figure 3. Effect of sequence and co-solvent on bimolecular G-quadruplex formation, in 60% co-solvent. The sequence d(TAGGGT)2 (top row) shows a preference for the parallel
structure in EtOH, iPrOH, and ACN, but the formation of the parallel structure is slower than the formation of the Type-II structure. The sequence d(AGGGTT)2 shows a preference
for Type-II structures in all co-solvents. Total dimer concentration is in black, parallel dimer is in red, and non-parallel dimer is in blue. The lines represent the data fittings obtained with the model shown in Figure 2B (in red, Type-I parallel dimer DI, in blue, Type-II dimers D0
Effect of base sequence and co-solvent on final structures
Figure 3 illustrates that, while the total dimer concentration is almost steady state, the proportions of parallel and non-parallel dimer change much more significantly, and that DI forms more slowly than DII. These effects were investigated from a thermodynamics and kinetics point of view. This section will discuss the thermodynamics aspects.
The Dynafit data analysis provides the equilibrium constant:
, (8)
and four rate constants, from which all equilibrium constants are deduced:
, ,
, (9)
, ,
, (10)
The concentrations of each species were recalculated from the equilibrium constants and from the mass balance equation applied to the single strand. Figure 4 shows how the final state depends on the sequence, nature of co-solvent, and percentage of co-solvent. Strictly speaking, these equilibrium constants describe a steady state, as it is possible that reactions occurring on a much longer time scale than the experiments (e.g., months) could further change the proportions compared to the apparent asymptotic values. In practice, the mass spectra recorded one or several days after reaction showed the same amount of total dimer as after one hour. We assume that the steady state concentrations reflect the final state at room temperature.
To complement mass spectrometry experiments, we also perform melting experiments monitored by UV-vis spectrophotometry at 295 nm, but the results are inconclusive. In particular, the experiments are complicated by organic co-solvent evaporation as the temperature increases, and the data interpretation is complicated by (1) the low abundance of bimolecular quadruplex at 20% and 40% co-solvent (the mass spectrometry data showing relative abundances of single strands and bimolecular structures are more conclusive in that respect), (2) by the fact that rates and equilibrium positions change as a function of the temperature, and (3) by hysteresis observed for some of the experiments due to slow reaction rates, consistent with our room temperature measurements and persisting at higher temperature. We therefore decided to focus only on the comparison of room temperature measurements. For d(GGGTTA)2 (representative kinetics results shown in Supporting Information S4) some
non-parallel dimer is formed in 100% H2O, and the addition of co-solvent further increases the
dimer concentration, except in the case of acetonitrile in which a decrease of dimer content is first observed at 20% acetonitrile. The latter behavior might suggest that several forms might
exist in the (D0+DII) ensemble, but these forms cannot be distinguished with the present experimental approach.
The propensity to form parallel dimer (DI) increases when terminal bases are placed on the 5’-end rather than on the 3’-5’-end (d(GGGTTA)2 < d(AGGGTT)2 < d(TAGGGT)2 < d(TTAGGG)2).
Base stacking (and in particular thymine stacking) at the 5’-end rather than at the 3’-end favors the parallel conformation. The propensity to form parallel structures also increases as the percentage of co-solvent increases, in line with the known effects of dehydration on G-quadruplexes. More surprisingly, for the sequences containing 5’-thymines, the structural preference also depends on the nature of the co-solvent: ethanol, isopropanol, and acetonitrile Figure 4. Percentage of strand in each form when the steady state defined in Figure 2B is attained, at 22 °C, as a function of the sequence (from top to bottom row: d(TTAGGG)2,
d(TAGGGT)2, d(AGGGTT)2 and d(GGGTTA)2) and co-solvent (from left to right:
methanol, ethanol, isopropanol, and acetonitrile). The total single strand concentration was 5 µM in all experiments.
tend to favor the parallel DI, whereas methanol tends to favor the antiparallel DII. The trends extracted from the mass spectrometry data are consistent with the circular dichroism spectra recorded in the same conditions (Supporting Information S5).
Folding/unfolding rates, and free energy landscapes
From each kinetics experiment, one equilibrium constant and four rate constants are obtained. The free energy differences between the stable states (minima in the free energy surface) can be computed from the equilibrium constants (Eq. 11-13). Similarly, in the framework of the transition state theory, the free energy differences between D0 and the transition states D‡I and D‡
II (saddle points in the free energy surface leading to DI and DII, respectively) can be computed from the rate constants (Eq. 14-15). The respective free energies of each species are equal to their partial molar free energies, and hence to their standard chemical potentials.
∆ ° RT ln , ° D 2 ° ss (11) ∆ ° RT ln , ° D ° D (12) ∆ ° RT ln , ° D ° D (13) ∆ °‡ RT ln , ° D‡ ° D (14) ∆ °‡ RT ln , ° D‡ ° D (15)
Equations (11-15) were used to calculate the free energy landscapes. All free energy differences were normalized relative to the free energy of the single strands, i.e. we arbitrarily set that ° ss 0. This procedure allows comparing all systems and all conditions with regard to their respective single strands. Figure 5 shows examples of free energy landscapes, for different sequences and solvents, and the full dataset is shown in Supporting Information Figure S6. In 0% co-solvent, except for d(GGGTTA)2 for which they were determined experimentally,
the free energy differences were obtained by extrapolation of graphs of ln(K or k)=f(ln(aW)) for
the different co-solvents with quadratic curves, and finding the common intercept at ln(aW)
corresponding to 100% H2O solution, supporting that the analysis utilized here is reasonable.
Figure 5 illustrates the variety of free energy landscapes and how they are influenced by the percentage of co-solvent, the base sequence, and the nature of the co-solvent. Increasing the percentage of co-solvent generally decreases the free energy of all energy minima compared to the corresponding single strands. The only exception is d(GGGTTA)2 in acetonitrile, as
mentioned above. The relative free energy of the transition states also decreases upon addition of co-solvent, with again acetonitrile presenting an exception. Volume percentages of 20% or 40% often increase the free energy of the transition states to a higher value than in pure water,
rendering the formation of DI and DII very slow, and the determination of the rate constants impossible. The relative free energy of the transition state is always lower than the free energy of the single strands, confirming the existence of a conformational switch pathway between DI and DII that would be faster than the separation into single strands.
The sequence d(TTAGGG)2 displays the same behavior in all co-solvents (see Figure 5A for
the free energy landscape in ethanol, and supporting information Figure S1 for the corresponding kinetics data). Upon co-solvent addition, the free energy of D0 is decreased compared to the single strands, but the free energy of DI and DII decrease by a larger amount. In all co-solvents except methanol, the free energy of the parallel structure DI is lower than the antiparallel DII. This is consistent with the previous studies showing such co-colvents induced a conformational transition from the antiparallel to the parallel.17,21,39 A possible explanation is
that co-solvents other than methanol bind preferentially to the parallel DI compared to the antiparallel DII. Further evidence for co-solvent binding effects will be discussed below. Furthermore, the kinetic analysis revealed that the free energies of the transition states are also lowered by a larger amount than the free energy of D0, resulting in acceleration of the formation of both DI and DII upon co-solvent addition. However, the free energy barrier of formation of
Figure 5. Representative free energy landscapes (at room temperature and 1 atm) for the bimolecular G-quadruplexes, in the presence of increasing volume percentages of co-solvent (color code in panel C). For each system, the chemical potential of reference ( ° 0) corresponds to the free single strands in the same conditions.
DI is larger than that of formation of DII. Therefore, although the parallel structure DI is the most stable in co-solvent mixtures, its formation is kinetically disfavored (the only exception being at 20% or 40% acetonitrile for d(TTAGGG)2 and d(TAGGGT)2, the latter case being
shown in Figure 5F). Similar observations had been made previously for d(TAGGGT)2 in
aqueous KCl, with thermodynamically favored parallel structures and kinetically favored antiparallel structures.26 A possible explanation is that the parallel structure is kinetically
disfavored for entropic reasons: the probability of occurrence of the “correct” base rearrangement is lower for the parallel structure than for the antiparallel structure. As all-anti guanine base conformation has no particular reason to be disfavored in unfolded strands, we postulate that the reason rather lies in the low probability of having the TTA loop exploring conformations compatible with the parallel structure. Co-solvent presence was found to accelerate all rearrangements equally well, so even in the presence of co-solvents, the parallel structure usually remains kinetically disfavored. Further exploration of the relative contributions of activation enthalpy and activation entropy to reaction rates will require performing temperature-dependent kinetics experiments.
Let us now examine the effect of the sequence, illustrated here by comparing the effect of ethanol addition on bimolecular G-quadruplex formation of d(TTAGGG)2, d(TAGGGT)2,
d(AGGGTT)2 and d(GGGTTA)2 (Figures 5A, 5E, 5B and 5C, respectively). Compared to their
respective single strands (µi°rel = 0), the species DII is the most influenced by the sequence, and the relative free energy of DII systematically decreases from d(TTAGGG)2 to d(GGGTTA)2.
Comparatively, the relative free energies of D0 and DI vary much less from sequence to sequence. Very similar trends are observed in isopropanol and acetonitrile. Therefore, parallel structures are thermodynamically favored in the presence of 5’-bases (especially 5’-TTA and 5’-TA) because the antiparallel structures are higher in free energy, and not because the parallel structures have lower free energy. In other words, terminal bases on the 3’-end rather than on the 5’-end tend to stabilize antiparallel structures. Similar effects are found in intramolecular telomeric G-quadruplex structures: in potassium solution, an antiparallel structure is predominantly formed by dGGG(TTAGGG)3T, a hybrid structure is formed by
dTAGGG(TTAGGG)3, while mixtures of these structures are formed by the
dAGGG(TTAGGG)3 sequence.7
The situation in methanol contrasts with that of the other solvents (compare for example d(TAGGGT)2 in methanol in Figure 5D and in ethanol and acetonitrile in Figures 5E and 5F).
The antiparallel structures are stabilized by a similar extent upon methanol addition, independently of the sequence. Furthermore, compared to other co-solvents, methanol presents the greatest degree of stabilization of antiparallel structures. Again, the preference for antiparallel structures in methanol is not due to a destabilization of the parallel structures, but
to a greater stabilization of the antiparallel ones.
Effects of cation capture, water release, and co-solvent binding on equilibrium and rate constants
Parsing the respective effects of hydration, cation binding, and co-solvent interaction is made challenging by the fact that it is impossible to change only one variable at a time experimentally. To partition the effects of co-solvent capture or release on the free energy landscape compared to water release or cation capture, each equilibrium is written by explicitly mentioning the number of water W, co-solvent CS, and cations M released upon product formation:
a A b B + w W + s CS + m M+ (16)
where w, s, and m are the numbers of W, CS, and M taken up through the reaction. These values can be positive or negative. In the framework of the transitions state theory, the transition state is in quasi-equilibrium with the reactant. Therefore, the following treatment applies both when B is a stable product and when B is a transition state.
The corresponding equilibrium constant is:
⊝ ⊝ ∙ ⊝ ∆ ⊝ ∆ ⊝ ∆ (17)
The standard activities of each species are often omitted in the expression of the equilibrium constants. In Equation (17), we wrote them explicitly to draw the attention to the choice of the standard state. For the solutes (A, B and the cation M), the standard state is unitary molarity. Rigorously, when the solvent is a mixture, it is more correct to define unitary molality (1 mol/kg) as the standard state. For the solvents (W and CS), however, there is a choice between choosing unitary mole fraction (e.g., ⊝ 1 in pure water) or unitary molality (e.g., ⊝ 55.5 in pure water) as the standard state.
Here, because we monitor a chemical reaction as a function of the mixture and not a colligative property of the mixture, and because we consider W and CS explicitly as reactant/product molecules, we chose unitary molality as the standard state for all species. Further discussion of the importance of the choice of the standard state and its implications is provided in Supporting Information S7. The most important point, if the reader attempts to compare our results with other publications, is to note that the values of w, s, and m deduced from the quantitative
analysis described below (which is the same as in previous papers40,41 will depend on the choice
of the standard state.
The apparent equilibrium constants ( , ) defined above (Equations 8-10) have been determined from molar concentrations:
, (18)
Replacing (18) into (17), and writing explicitly the chosen standard states in the activities, we obtain:
, ∙ ∙ ∆ ∆ ∆ (19)
The effects of different co-solvents can be discussed by measuring , as a function of the
water activity, . The latter is determined from osmometry measurements (see methods). If (16) thoroughly represents the chemical reaction, then is independent on the conditions, and therefore its derivative with regard to is zero. Hence,
, ∆ ∆ ∆ (20)
In transition state theory, the rate constant k is equal to the quasi-equilibrium rate constant K‡
multiplied by a constant, and therefore Equation (20) is also applicable. A linear decrease of ln , as a function of ln is usually interpreted as a predominant effect of the first term
in Equation (20), with release of water upon formation of B from A (∆ > 0). Furthermore, the superimposition of the curves corresponding to all co-solvents suggests that the co-solvent is merely a spectator in the chemical reaction.
Figure 6 presents the graphs of the logarithm of equilibrium and rate constants as a function of for d(AGGGTT)2, a sequence giving predominantly a Type-II structure in all solvents.
Again, with the general framework of Equations (16-20), , can be either an equilibrium
constant (B standing for the products D0, DI or DII), or a rate constant (B standing for a transition state D‡I or D‡II). The graphs for all other sequences are shown in Supporting Information S8. Note that not all data follow the same trend as d(AGGGTT)2, and the sequence effect on the
kinetics will be discussed further below.
Panels B-D in Figure 6 help interpret the data visually, regarding the relative contribution of each term of Equation (20). The relative scaling is identical in all panels of Figure 6. Panel B shows the expected slopes for different values of ∆ . The second term in Equation (20) is hard
to estimate. However, as the contribution of specific interactions of nucleic acids with other species (W, CS and M) is explicitly taken into account in the other terms, only electrostatic contributions to the activity coefficients remain. These activity coefficients will change with the dielectric constant of the solvent. Assuming that they change similarly for the reactant A and the product B because both are nucleic acids, the second term will be neglected.
Figure 6. Evolution of the equilibrium constants and rate constants (defined in Figure 2B) as a function of the water activity, for the formation of bimolecular G-quadruplex from sequence d(AGGGTT)2. (A) Equilibrium constant of formation of D0. (B-D) On same vertical scaling, theoretical slopes and trends that would correspond to (B) the release of 1, 3, 5 or 10 water molecules, (C) the uptake of one ammonium cation (m = -1), or (D) the uptake of one cosolvent molecule (s = -1), in reaction (13). Curves in panels C and D were obtained from AIOMFAC simulations. (E-H) Rate constants of formation/unfolding of the antiparallel dimer DII and the parallel dimer DI.
G-quadruplex formation is accompanied by the binding of monovalent cations.42 This includes
cations specifically coordinated between G-quartets, and cations binding in the phosphates’ vicinity. We therefore cannot ignore that changing the solvent composition also changes the activity coefficients of cations.43,44 We used the program AIOMFAC45,46 to simulate how the
co-solvent and cation activities vary as a function of the water activity in our experimental conditions. The calculation details are given in Supporting Information S9. The outputs for ln and ln as a function of ln are shown in Figures 6C and 6D, respectively. Experimentally, we decreased the molar concentration of NH4+ when increasing the co-solvent
percentage to compensate for the anticipated changes in activity coefficients. Panel 6C shows that this was partially the case, but the cation activity still slightly increases as the water activity decreases. Quantitatively, a negative slope of -1 in the ln , vs. ln can be due either
to the uptake of one cation (m = -1) or to the release of one water molecule (w = +1). Within experimental error, cation capture effects cannot be distinguished from water release effects. Because only tightly coordinated ammonium cations can be detected in the moderately harsh ESI-MS conditions used here,28,47 the number of ammonium ions preserved in the ESI-MS
spectra is not indicative of the value of m, so the relative contributions of water release and cation capture to the dependency of equilibrium and rate constants on water activity cannot be parsed here.
Simulations in Figure 6D show that the effect of co-solvent on the curvature is more dramatic: in the range of water activities probed here, co-solvent capture leads to a negative curvature. The fact that co-solvent activity is zero in pure water (and hence is equal to -∞) points to a limitation of using Equations (16-20): as the co-solvent is explicitly involved, they are only valid in the presence of co-solvent, and therefore do not allow extrapolating what happens in the absence of co-solvent. Nevertheless, negative curvature in the ln , vs. ln graphs
could be interpreted qualitatively as indicating solvent capture upon reaction, and positive curvature as solvent release.
Co-solvents interact with the G-quadruplex forming nucleic acids
Co-solvent addition stabilizes the parallel and the antiparallel G-quadruplexes, as well as the intermediates. Is this due only to dehydration or do the solvent molecules interact with the G-quadruplexes? If s = 0 in all reactions (no co-solvent capture or release), then (1) the data would superimpose for the different co-solvent (provided that the ammonium ion capture is similar in all co-solvents), and (2) the ln , vs. ln graphs would appear linear within
experimental error. This is not the case here: a curvature can be seen in several graphs of Figures 6 and S8, and the curvatures differ from one solvent to another. Co-solvents are therefore not just acting like spectator co-solutes in the system; they interact with the single strands and the G-quadruplexes.
Besides the curvature of the graphs in Figure 6 and S8, the fact that different final structures are obtained in methanol than with the other solvents points to a different type of direct interaction between the co-solvent and the DNA strands. Such dependency on the co-solvents has been observed in previous reports for co-solvents effects on DNA G-quadruplex and duplex.21,24,40
In these reports, it was proposed that co-solvents had chemical interaction with DNA molecules. The nature of the interaction (net capture or release, at different steps of reaction mechanism 5b) depends on the nature of the co-solvent. For ethanol and ispropanol, there is no significant net release or capture of co-solvent between the single strand and the final structures, but this hides more complex phenomena along the reaction pathway. The results indeed indicate the release of ethanol or isopropanol upon formation of the intermediate (Figure 6A), followed by a re-capture upon formation of the transition state to the final structures (Figures 6E and 6G). It also means that the initial release of co-solvent upon intermediate formation is compensated by the release of many more water molecules, otherwise increasing the co-solvent percentage would not stabilize the intermediate D0. Methanol differs from ethanol and isopropanol in that there is no apparent release upon formation of the intermediate from the single strands. As a result, methanol is the medium in which the intermediate D0 is the most stable. As a result, the kinetic barrier to D‡I remains high (compare Figure 5D, MeOH and 5E, EtOH).
Acetonitrile differs from all other co-solvents, by the fact that acetonitrile is released upon G-quadruplex formation. Note that the missing data at 20% ACN are due to a much slower formation of G-quadruplex than detectable; and therefore to lower kf value than measurable.
The of acetonitrile release upon G-quadruplex formation might be linked to the fact that acetonitrile is leading to a different final structure than PEG 400 for the sequence dA(GGGTTA)3GGG, as determined from NMR data,20 despite both show the CD trace of a
G-rich oligonucleotides is worthy of further investigation. In summary, our results highlight that differences in co-solvent binding between the initial state, the intermediates, and the final G-quadruplex states (and not only co-solvent binding to the final state) must be considered to interpret co-solvent effects on G-quadruplex structure.
Factors influencing the G-quadruplex folding kinetics
On the contrary to what happens in viscous co-solvents,22 the formation of the final
G-quadruplex structures is accelerated by the addition of non-viscous solvents. Whether for DI or DII, the rates of G-quadruplex folding (kf’s) are more influenced by the co-solvent than the rates
of G-quadruplex unfolding (ku’s), i.e. compare Figures 6E with 6F, or 6G with 6H. In terms of
solvent and/or cation capture or release, the transition state therefore seems closer to the final folded G-quadruplex than to the intermediate D0. The rate limiting step of the whole folding might involve solvent and cation reorganizations. When considering the effect of co-solvent on the apparent formation kinetics from the single strands, the effect of co-solvent on the first equilibration step (KA,0) multiplies with the effect on kf, because the rate-limiting step is the
slow transition from D0 to DI or to DII. Both evolve in the same way, so the co-solvent effects on the whole folding process are amplified. The net acceleration of bimolecular G-quadruplex formation from single strands, obtained by switching from 100% water to 60% organic co-solvent, is over 200-fold. This demonstrates the importance of the chemical environment in modulating the folding of DNA G-quadruplexes.
The unfolding rates are not significantly influenced by the sequence; they are consistently faster for the antiparallel dimer than for the parallel dimer. This is confirmed by dissociation experiments monitored by ESI-MS, in different co-solvents (Supporting Information Figure S10). The formation of the antiparallel dimer is kinetically favored in the presence of co-solvents, for all sequences. The unfolding rate of the antiparallel dimer depends little on the sequence. In contrast, the unfolding rate of the parallel dimer depends greatly on the sequence. For d(AGGGTT)2, the unfolding rates of the parallel and antiparallel dimers are similar by
comparing ku,I and ku,II in Figures 6F and 6H, respectively). In contrast, each additional thymine
on the 5’-end slows down the unfolding of the parallel bimolecular structure, i.e. lowers ku,I as
shown in Figure S8. The thermodynamic preference for the parallel dimer increases as flanking thymines are added on the 5’-end is therefore due to an effect on the unfolding kinetics of the parallel structure. A recent molecular modeling study has shown that thymines of in the parallel intramolecular G-quadruplex structure formed by dAGGG(TTAGGG)3 engage into hydrogen
bonds forming pentads and hexads.48 Similar participation of the 5’-thymines in hydrogen
CONCLUSIONS
Mass spectrometry monitoring of bimolecular telomeric DNA G-quadruplexes reveals details of their folding mechanism, and offers insight in the co-solvents and sequence effects on the equilibrium and dynamics. The proposed folding mechanism involves the collapse of two single strands into a bimolecular intermediate in rapid equilibrium with the single strands, followed by rearrangements on a slower time scale into antiparallel and parallel structures. With few exceptions, antiparallel structures form faster than parallel structures (even when the contribution of the intermediate is subtracted), but parallel structures unfold more slowly than antiparallel structures. We show here for the first time that thymine bases on the 5’-end slow down the unfolding rate of parallel structures. This contributes rationalizing the role of the sequence in the polymorphism of telomeric DNA sequences. Besides sequence effects, the chemical environment, modulated here by changing the amount and nature of organic co-solvent, also influences polymorphism. Organic co-solvents favor the formation of the bimolecular intermediate, and accelerates the folding of that intermediate into the final structures. In contrast, co-solvents do not significantly influence the unfolding rates of parallel and antiparallel dimers. Based on an integrated discussion of the relative contributions of water activity, co-solvent activity and cation activity changes when the co-solvent volume fraction is changed, we demonstrate that co-solvent capture or release upon assembly and structural reorganization must be taken into account in the G-quadruplex formation mechanisms. Organic co-solvents are therefore not only “spectator” co-solutes. Notably, our results suggest net acetonitrile release upon G-quadruplex formation from the single strands..These results highlight that, for nanotechnology applications requiring dehydrated conditions, possible interactions of co-solutes with each state (unfolded, intermediates, transisition states and final structures) can influence the structure and dynamics of G-quadruplex based responsive materials. They also highlight that, in the quest for mimicking physiological conditions by using co-solutes to study the folding biophysics of biologically relevant sequences such as the telomeric sequence or other important G-quadruplexes, the nature of the co-solute plays an important role as it can bind to different state in different manners. Decomposing the reaction pathways is distinct steps, for example using mass spectrometry and, in a near future, ion mobility spectrometry separations, will be important to elucidate G-quadruplex folding mechanisms.
ACKNOWLEDGEMENTS
position and FRFC grant 2.4528.11 to VG), the Inserm (ATIP-Avenir grant R1286GS to VG) the EU COST action MP0802 (STSM 9145 to RF), and the Spanish Ministry of Science (CTQ-2010-20541), Grants-in-Aid for Scientific Research, the Scientific Research on Innovative Areas "Nanomedicine Molecular Science" (No. 2306 to DM), and the "Strategic Research Foundation at Private Universities" (2009-2014 to NS) from the Ministry of Education, Culture, Sports, Science and Technology, Japan, the Kurata Grants, the Kurata Memorial Hitachi Science and Technology Foundation (to DM), and the Hirao Taro Foundation of the Konan University Association for Academic Research (to NS).
SUPPORTING INFORMATION
Additional kinetics data showing the effect of co-solvent percentage, the particular case of d(GGGTTA)2, concentration-dependent experiments and dissociation experiments; commented
Dynafit script, circular dichroism spectra, complete dataset of Free energy landscapes and equilibrium and rate constants vs. water activity, details of the AIOMFAC simulations and additional discussion of the choice of standard state are available as supporting information free of charge at http://www.pubs.acs.org
REFERENCES
(1) Davis, J. T.G-Quartets 40 Years Later: From 5'-Gmp to Molecular Biology and Supramolecular Chemistry, Angew. Chem. Int. Ed. 2004, 43, 668-698.
(2) Burge, S.; Parkinson, G. N.; Hazel, P.; Todd, A. K.; Neidle, S.Quadruplex DNA: Sequence, Topology and Structure, Nucleic Acids Res. 2006, 34, 5402-5415.
(3) Phan, A. T.; Kuryavyi, V.; Patel, D. J.DNA Architecture: From G to Z, Curr.
Opin. Struct. Biol. 2006, 16, 288-298.
(4) Maizels, N.Dynamic Roles for G4 DNA in the Biology of Eukaryotic Cells,
Nat. Struct. Mol. Biol. 2006, 13, 1055-1059.
(5) Huppert, J. L.; Balasubramanian, S.Prevalence of Quadruplexes in the Human Genome, Nucleic Acids Res. 2005, 33, 2908-2916.
(6) Neidle, S.Human Telomeric G-Quadruplex: The Current Status of Telomeric G-Quadruplexes as Therapeutic Targets in Human Cancer, FEBS J. 2010, 277, 1118-1125.
(7) Phan, A. T.Human Telomeric G-Quadruplex: Structures of DNA and Rna Sequences, FEBS J. 2010, 277, 1107-1117.
(8) Phan, A. T.; Kuryavyi, V.; Luu, K. N.; Patel, D. J. Structural Diversity of G-Quadruplex Scaffolds. In G-Quadruplex Nucleic Acids; Neidle, S., Balasubramanian, S., Eds.; The Royal Soceity of Chemistry: Cambridge, 2006; pp 81-99.
(9) Neidle, S.The Structures of Quadruplex Nucleic Acids and Their Drug Complexes, Curr. Opin. Struct. Biol. 2009, 19, 239-250.
(10) Lee, J. Y.; Okumus, B.; Kim, D. S.; Ha, T.Extreme Conformational Diversity in Human Telomeric DNA, Proc. Natl. Acad. Sci. USA 2005, 102, 18938-18943.
(11) Lane, A. N.; Chaires, J. B.; Gray, R. D.; Trent, J. O.Stability and Kinetics of G-Quadruplex Structures, Nucleic Acids Res. 2008, 36, 5482-5515.
(12) Gray, R. D.; Li, J.; Chaires, J. B.Energetics and Kinetics of a Conformational Switch in G-Quadruplex DNA, J. Phys. Chem. B 2009, 113, 2676-2683.
(13) Boncina, M.; Lah, J.; Prislan, I.; Vesnaver, G.Energetic Basis of Human Telomeric DNA Folding into G-Quadruplex Structures, J. Am. Chem. Soc. 2012, 134, 9657-9663.
(14) Petraccone, L.; Malafronte, A.; Amato, J.; Giancola, C.G-Quadruplexes from Human Telomeric DNA: How Many Conformations in Peg Containing Solutions?, J. Phys.
Chem. B 2012, 116, 2294-2305.
(15) Gray, R. D.; Buscaglia, R.; Chaires, J. B.Populated Intermediates in the Thermal Unfolding of the Human Telomeric Quadruplex, J. Am. Chem. Soc. 2012, 134, 16834-16844.
(16) Miyoshi, D.; Karimata, H.; Sugimoto, N.Drastic Effect of a Single Base Difference between Human and Tetrahymena Telomere Sequences on Their Structures under Molecular Crowding Conditions, Angew. Chem. Int. Ed. 2005, 44, 3740-3744.
(17) Xue, Y.; Kan, Z. Y.; Wang, Q.; Yao, Y.; Liu, J.; Hao, Y. H.; Tan, Z.Human Telomeric DNA Forms Parallel-Stranded Intramolecular G-Quadruplex in K + Solution under Molecular Crowding Condition, J. Am. Chem. Soc. 2007, 129, 11185-11191.
(18) Vorlickova, M.; Bednarova, K.; Kypr, J.Ethanol Is a Better Inducer of DNA Guanine Tetraplexes Than Potassium Cations, Biopolymers 2006, 82, 253-260.
(19) Smirnov, I. V.; Shafer, R. H.Electrostatics Dominate Quadruplex Stability,
Biopolymers 2007, 85, 91-101.
(20) Miller, M. C.; Buscaglia, R.; Chaires, J. B.; Lane, A. N.; Trent, J. O.Hydration Is a Major Determinant of the G-Quadruplex Stability and Conformation of the Human Telomere 3' Sequence of D(Ag(3)(Ttag(3))(3)), J. Am. Chem. Soc. 2010, 132, 17105-17107.
(21) Heddi, B.; Phan, A. T.Structure of Human Telomeric DNA in Crowded Solution, J. Am. Chem. Soc. 2011, 133, 9824-9833.
(22) Lannan, F. M.; Mamajanov, I.; Hud, N. V.Human Telomere Sequence DNA in Water-Free and High-Viscosity Solvents: G-Quadruplex Folding Governed by Kramers Rate Theory, J. Am. Chem. Soc. 2012, 134, 15324-15330.
(23) Mamajanov, I.; Engelhart, A. E.; Bean, H. D.; Hud, N. V.DNA and Rna in Anhydrous Media: Duplex, Triplex, and G-Quadruplex Secondary Structures in a Deep Eutectic Solvent, Angew. Chem. Int. Ed. 2010, 49, 6310-6314.
(24) Miyoshi, D.; Karimata, H.; Sugimoto, N.Hydration Regulates Thermodynamics of G-Quadruplex Formation under Molecular Crowding Conditions, J. Am. Chem. Soc. 2006,
128, 7957-7963.
(25) Miyoshi, D.; Sugimoto, N.Molecular Crowding Effects on Structure and Stability of DNA, Biochimie 2008, 90, 1040-1051.
(26) Phan, A. T.; Patel, D. J.Two-Repeat Human Telomeric D(Tagggttagggt) Sequence Forms Interconverting Parallel and Antiparallel G-Quadruplexes in Solution: Distinct Topologies, Thermodynamic Properties, and Folding/Unfolding Kinetics, J. Am.
Chem. Soc. 2003, 125, 15021-15027.
(27) Rujan, I. N.; Meleney, J. C.; Bolton, P. H.Vertebrate Telomere Repeat Dnas Favor External Loop Propeller Quadruplex Structures in the Presence of High Concentrations of Potassium, Nucleic Acids Res. 2005, 33, 2022-2031.
(28) Ferreira, R.; Marchand, A.; Gabelica, V.Mass Spectrometry and Ion Mobility Spectrometry of G-Quadruplexes. A Study of Solvent Effects on Dimer Formation and Structural Transitions in the Telomeric DNA Sequence D(Tagggttagggt), Methods 2012, 57, 56-63.
(29) Goobes, R.; Kahana, N.; Cohen, O.; Minsky, A.Metabolic Buffering Exerted by Macromolecular Crowding on DNA-DNA Interactions: Origin and Physiological
Significance, Biochemistry 2003, 42, 2431-2440.
(30) Gabelica, V.; Rosu, F.; De Pauw, E.A Simple Method to Determine Electrospray Response Factors of Noncovalent Complexes, Anal. Chem. 2009, 81, 6708-6715.
(31) Karsisiotis, A. I.; Ma'ani Hessari, N.; Novellino, E.; Spada, G. P.; Randazzo, A.; Webba da Silva, M.Topological Characterization of Nucleic Acid G-Quadruplexes by Uv Absorption and Circular Dichroism, Angew. Chem. Int. Ed. 2011, 50, 10645-10648.
(32) Kuzmic, P.Program Dynafit for the Analysis of Enzyme Kinetic Data: Application to Hiv Proteinase, Anal. Biochem. 1996, 237, 260-273.
(33) Stefl, R.; Cheatham, T. E.; Spackova, N.; Fadrna, E.; Berger, I.; Koca, J.; Sponer, J.Formation Pathways of a Guanine-Quadruplex DNA Revealed by Molecular Dynamics and Thermodynamic Analysis of the Substates, Biophys .J. 2003, 85, 1787-1804.
(34) Rosu, F.; Gabelica, V.; Poncelet, H.; De Pauw, E.Tetramolecular G-Quadruplex Formation Pathways Studied by Electrospray Mass Spectrometry, Nucleic Acids Res. 2010,
38, 5217-5225.
(35) Koirala, D.; Mashimo, T.; Sannohe, Y.; Yu, Z.; Mao, H.; Sugiyama, H.Intramolecular Folding in Three Tandem Guanine Repeats of Human Telomeric DNA,
Chem. Commun. 2012, 48, 2006-2008.
(36) Mashimo, T.; Yagi, H.; Sannohe, Y.; Rajendran, A.; Sugiyama, H.Folding Pathways of Human Telomeric Type-1 and Type-2 G-Quadruplex Structures, J. Am. Chem.
Soc. 2010, 132, 14910-14918.
Intramolecular G-Quadruplex Nucleic Acids, J. Am. Chem. Soc. 2012, 134, 19297-19308. (38) Gray, R. D.; Chaires, J. B.Kinetics and Mechanism of K+- and Na+-Induced
Folding of Models of Human Telomeric DNA into G-Quadruplex Structures, Nucleic Acids
Res. 2008, 36, 4191-4203.
(39) Miyoshi, D.; Nakao, A.; Sugimoto, N.Molecular Crowding Regulates the Structural Switch of the DNA G-Quadruplex, Biochemistry 2002, 41, 15017-15024.
(40) Nakano, S.; Karimata, H.; Ohmichi, T.; Kawakami, J.; Sugimoto, N.The Effect of Molecular Crowding with Nucleotide Length and Cosolute Structure on DNA Duplex Stability, J. Am. Chem. Soc. 2004, 126, 14330-14331.
(41) Miyoshi, D.; Nakamura, K.; Tateishi-Karimata, H.; Ohmichi, T.; Sugimoto, N.Hydration of Watson-Crick Base Pairs and Dehydration of Hoogsteen Base Pairs Inducing Structural Polymorphism under Molecular Crowding Conditions, J. Am. Chem. Soc. 2009,
131, 3522-3531.
(42) Gray, R. D.; Chaires, J. B.Linkage of Cation Binding and Folding in Human Telomeric Quadruplex DNA, Biophys. Chem. 2011, 159, 205-209.
(43) Hefter, G.; Marcus, Y.; Waghorne, W. E.Enthalpies and Entropies of Transfer of Electrolytes and Ions from Water to Mixed Aqueous Organic Solvents, Chem. Rev. 2002, 102 2773-2836.
(44) Kalidas, C.; Hefter, G.; Marcus, Y.Gibbs Energies of Transfer of Cations from Water to Mixed Aqueous Organic Solvents, Chem. Rev. 2000, 100, 819-852.
(45) Zuend, A.; Marcolli, C.; Booth, A. M.; Lienhard, D. M.; Soonsin, V.; Krieger, U. K.; Topping, D. O.; McFiggans, G.; Peter, T.; Seinfeld, J. H.New and Extended
Parameterization of the Thermodynamic Model Aiomfac: Calculation of Activity Coefficients for Organic-Inorganic Mixtures Containing Carboxyl, Hydroxyl, Carbonyl, Ether, Ester, Alkenyl, Alkyl, and Aromatic Functional Groups, Atmos. Chem. Phys. 2011, 11, 9155-9206.
(46) Zuend, A.; Marcolli, C.; Luo, B. P.; Peter, T.A Thermodynamic Model of Mixed Organic-Inorganic Aerosols to Predict Activity Coefficients, Atmos. Chem. Phys. 2008, 8, 4559-4593.
(47) Balthasart, F.; Plavec, J.; Gabelica, V.Ammonium Ion Binding to DNA G-Quadruplexes: Do Electrospray Mass Spectra Faithfully Reflect the Solution-Phase Species?,
J. Am. Soc. Mass Spectrom. 2013, 24, 1-8.
(48) Islam, B.; Sgobba, M.; Laughton, C.; Orozco, M.; Sponer, J.; Neidle, S.; Haider, S.Conformational Dynamics of the Human Propeller Telomeric DNA Quadruplex on a Microsecond Time Scale, Nucleic Acids Res. 2013, 41, 2723-2735.