Data Base Generation and Modeling of Homogeneous Charge
Compression Ignition Using a Rapid Compression Machine
by
Ferran A. Ayala
B.S., Mechanical Engineering
The University of Kansas, 1999
Submitted to the Department of Mechanical Engineering
in Partial Fulfillment of the Requirements for the Degree of
Master of Science in Mechanical Engineering
at the
Massachusetts Institute of Technology
May 2001
'0.
@ 2001 Massachusetts Institute of Technology
All rights reserved MASSACHUSETTS INSTITUTE OF TECHNOLOGY
FJU L
1
6
2001
LIBRARIES
ARKER
Signature of Author
Department of Mecnanical Engineering
May, 2001
Certified by
John B. Heywood
Sun Jae Professor of Mechanical Engineering
Thesis Supervisor
Accepted by
Amn A. Sonin
Chairman, Department Committee on Graduate Students
Data Base Generation and Modeling of Homogeneous Charge
Compression Ignition Using a Rapid Compression Machine
by Ferran A. Ayala
Submitted to the Department of Mechanical Engineering May 2001 in Partial Fulfillment of the Requirements for the Degree of Master of Science in Mechanical Engineering
ABSTRACT
Homogeneous Charge Compression Ignition (HCCI) is the spontaneous ignition of fully or partially premixed fuel vapor/air plus burned gas mixture due to temperature (and pressure) rise during compression. This combustion process has been shown to be feasible under certain engine conditions and has the potential of low NO emissions due to the low burned gas temperatures achieved with lean mixtures. Sufficient premixing of air and fuel also produce low particulate emissions. Thus HCCI has the potential of having low emissions and high efficiency with lean operating high compression ratio engines. However this concept requires a good understanding of the different mixture conditions and engine parameters under which the process can occur and thus be controlled. Some of the challenges are controlling ignition and the rate of fuel chemical energy release relative to piston position to obtain high torque, achieving a high enough combustion efficiency, and achieving control over a wide enough range of loads for the concept to be practical in a vehicle.
This project consists of generating a data base of ignition and energy release rates for different fuels using a Rapid Compression Machine (RCM). These results are then used to develop and validate a combustion model of Homogeneous Charge Compression Ignition. By varying parameters such as the compression ratio, initial charge pressure and temperature, and initial mixture composition, the ignition and combustion limits of different fuels can be obtained. One of the goals of this study is to determine conditions that will give ignition delays and combustion conditions comparable to those seen in a real engine (for example, ignition delays in the milliseconds range). This information is needed to develop and evaluate engine concepts under which HCCI would be possible and controllable.
Thesis Advisor: Professor John B. Heywood Title: Sun Jae Professor of Mechanical Engineering
ACKNOWLEDGMENTS
If it took me four years to get to MIT, and two years to complete this project, I think it is only fair that I spend some time meditating and thinking about all the people who helped me get to this point today, and thank them, for I did not do it alone.
I would like to thank my two great mentors at MIT: Professor John Heywood and Professor James Keck. It was a luxury to have worked with both of them; I feel very fortunate. It was the attention that I received from them, as well as their continuous feedback, support, and guidance, that motivated me and encouraged me so much during this project. I thank Professor Heywood for his advice both academic and non-academic. I admire his success and his dedication to his work and his students. Likewise, I thank Professor Keck who even though is retired, worked on this project as if he was working full time. His knowledge of the Rapid Compression Machine and his expertise in combustion and engineering in general were vital to the completion of this work
I thank all my friends at MIT and my colleagues at the Sloan Lab for their enjoyable company, and their help. Special thanks to Rolf Karlsson, a good friend who did not get tired of tutoring me in Fluids and ICE. I also thank Benoist for his extensive help in my research and in my courses. I thank Tian for the motivating conversations that we had, for his advice whenever I needed it. A special thanks also to my supportive friends from Undergraduate back in Kansas.
I thank Leslie Regan, for her flexibility and support even before coming to MIT, helping me find a RA. She is without a doubt one of the engines of this department. I also thank Karla Stryker, and Susan Lutin for all their amusing talks. I thank Thane DeWitt for his technical support and his concern with safety issues. He is another engine in the lab, and I am glad he joined at the right time.
I thank Mr. Tanaka for his help in finishing my thesis, and Dave Schmidt for helping me with the many questions that I had during this project and for providing some figures for this thesis. I also thank Robert Meyer for his support and guidance as manager of the project, and I thank BMW for their funding of this research. I hope they continue to study HCCI, and push towards cleaner fuels.
I never had the opportunity to thank my parents for all their efforts in giving me one of the finest educations I could get in Mexico; one that was beyond their reach during their childhood. An education for privileged people which gave me important tools to advance and progress. It was not education alone, but also their unending love, as well as the morals and work ethic that they instilled in me that helped me achieve many of my goals, however unreasonable these seemed at some point. "Gracias Papa y Mama."
TABLE OF CONTENTS
Abstract... 3 Acknowledgments... 5 Nomenclature... 9 List of Tables... 10 List of Figures... 11 CHAPTER 1. INTRODUCTION ... 13 1.1 M otivation ... 13 1.2 Background ... 131.3 HCCI Combustion Characteristics... 14
1.4 Challenges... 14
1.5 Objectives ... 15
CHAPTER 2. THE RAPID COM PRESSION M ACHINE ... 17
2.1 Introduction... 17 2.2 RCM Configuration ... 17 2.3 Characteristics of RCM ... 18 2.4 Specification of RCM O-Rings... 20 2.5 Basic Operation... 21 2.6 RCM Plumbing... 21
2.7 Charge Preheat System ... 25
2.8 Gas Handling System and Filling Procedure ... 26
2.9 Instrumentation and Data Acquisition ... 27
CHAPTER 3. RAPID COMPRESSION MACHINE MODIFICATIONS AND IM PROVEM ENTS ... 29 3.1 Introduction... 29 3.2 RCM Speed Ring... 29 3.3 RCM Oil Rim ... 29 3.4 RCM Piston Liner... 31 3.5 RCM Spacer... 31
3.6 Fast Acting Valve ... 31
3.7 Dovetail Groove... 31
3.8 Compression Ratio Shim ... 32
3.9 Thermal Insulator... 32
3.10 M odified Combustion Chamber Valve... 32
3.11 Other Improvements ... 32
CHAPTER 4. RAPID COMPRESSION MACHINE EXPERIMENTS... 35
4.1 Compression Calibration ... 35
4.3 Heat Release During Ignition Delay ... 39
4.4 Reproducibility of Combustion Curves ... 40
4.5 End-of-Combustion Variations... 42
4.6 Knock and High Pressure Oscillations ... 42
4.7 Piston Rebound... 43
4.8 Sensitivity Study ... 44
4.9 Experimental Program and RCM Data Base ... 47
4.10 M atrix of Experiments for M odel Calibration ... 48
4.11 Data Analysis and Chemkin Comparisons... 55
CHAPTER 5. HCCI M ODEL ... 59
5.1 Background... 59
5.2 Compression and Heat Transfer M odel ... 59
5.3 The Ignition M odel ... 62
5.4 Hydrocarbon Breakdown ... 63
5.5 CO Oxidation ... 64
5.6 Code Logic, Structure, and Equations ... 64
5.7 M odel Calibration ... 66
5.8 M odel and Data Comparisons ... 66
CHAPTER 6. CONCLUSIONS AND DISCUSSIONS ... 77
BIBLIOGRAPHY ... 79
APPENDICES ... 79
Appendix 1: Rapid Compression Machine Operation Sequence ... 79
Appendix 2: Rapid Compression Machine Modifications (Drawings)... 81
Appendix 3: Details of the Hu-Keck Reduced M echanism ... 97
Appendix 4: M ATLAB Code ... 98
NOMENCLATURE
ON - Octane Number
PRF - Primary Reference Fuel
RC - Compression Ratio
RCM - Rapid Compression Machine y - Gamma: Ratio of Specific Heats
- Alpha: Thermal Diffusivity
6 - Thermal Boundary Layer Thickness
V - Volume v - Velocity R - Radius d, DSTP - Stopping Distance h - Height h2 - Clearance height
td - Time to Decelerate Piston
CAD - Crank Angle Degrees
RPM - Revolutions Per Minute Phi, $ - Fuel-Air equivalence ratio
Po - Pressure (initial) To - Temperature (initial)
LIST OF TABLES
Table 2.1 RCM Characteristics ... 18
Table 2.2 Current Operating Pressures ... 22
Table 2.3 Operating Pressures Recommended by Park... 22
Table 2.4 Calibration of Oil and Tubing Temperatures ... 26
Table 4.1 Compression of Air ... 36
Table 4.2 M atrix of Experiments Using a 90 ON PRF ... 48
LIST OF FIGURES
Figure 1.1 Figure 1.2 Figure 2.1 Figure 2.2 Figure 2.3 Figure 2.4 Figure 2.5 Figure 3.1 Figure 4.1 Figure 4.2 Figure 4.3 Figure 4.4 Figure 4.5 Figure 4.6 Figure 4.7 Figure 4.8 Figure 4.9 Figure 4.10 Figure 4.11 Figure 4.12 Figure 4.13 Figure 4.14 Figure 4.15 Figure 4.16 Figure 4.17 Figure 4.18 Figure 4.19 Figure 4.20 Figure 4.21 Figure 4.22 Figure 4.23 Figure 4.24 Figure 4.25 Figure 4.26 Figure 5.1 Figure 5.2 Figure 5.3 Figure 5.4 Figure 5.5 Figure 5.6 Figure 5.7 Figure 5.8 Figure 5.9 Figure 5.10 Figure 5.11 Figure 5.12 Combustion Combustion Combustion Combustion Combustion Combustion Combustion Combustion Combustion Curves: Curves: Curves: Curves: Curves: Curves: Curves: Curves: Curves: $=0.4, Rc= $=0.4, Rc= $=0.4, Rc= $=0.4, Rc= $=0.3, Rc= 0=0.5, Rc= 0=0.3, Rc= 0=0.4, Rc= 0=0.5, Rc= 14, To=60 16, To=50 16, To=60 16, To=70 16, To=60 16, To=60 16, To=60 16, To=60 16, To=60 Change in Pressure due to Combustion (Po=C, Po=1 atm ... 50 C, Po=1 atm ... 51 C, Po=1 atm ... 51 C, Po=1 atm ... 52 C, Po=1 atm ... 52 C, Po=1 atm ... 53 C, Po=0.75 atm ... 53 C, Po=0.75 atm ... 54 C, Po=0.75 atm ... 54 0.75 atm ) ... 58
Change in Pressure due to Combustion (Po= 1 atm) ... 58
Compression Stage and Heat Transfer M odel ... 61
The H u-K eck Ignition M odel ... 63
C ode L ogic and Structure ... 65
Compression Stage and Heat Transfer Model Calibration ... 67
Combustion Curves, Model vs. Data $=0.4, Rc= 14, To=50 Po=1 atm... 68
Combustion Curves, Model vs. Data $=0.4, Rc= 14, To=60 Po=1 atm... 68
Combustion Curves, Model vs. Data 0=0.4, Rc= 16, To=50 Po=1 atm... 69
Combustion Curves, Model vs. Data 0=0.4, Rc= 16, To=60 Po=1 atm... 69
Combustion Curves, Model vs. Data $=0.4, Rc= 16, To=70 Po=1 atm ... 70
Combustion Curves, Model vs. Data $=0.3, Rc= 16, To=60 Po=1 atm... 70
Combustion Curves, Model vs. Data $=0.5, Rc= 16, To=60 Po=1 atm ... 71
Combustion Curves, Model vs. Data $=0.3, Rc= 16, To=60 Po=0.75 atm ... 71
HCCI Concepts and Configurations... 15
Controllability of HCCI ... 16
RCM D iagram ... 19
RCM O -Rings ... 20
D iagram of RCM Plumbing ... 23
G as H andling System ... 24
Oil-H eating System ... 25
D iagram of RCM Section ... 30
Com pression of Air, Rc=14, Po=1 atm , To=300 K ... 36
Com pression of Air at V arious Com pression Ratios ... 37
M easured Param eters ... 38
Energy Released Before Rapid Com bustion... 40
Com bustion Repeatability (90 ON PRF) ... 41
Com bustion Repeatability (Isooctane) ... 41
End-of-Com bustion V ariations ... 42
Knock O scillations ... 43
Piston Rebound ... 44
Octane N um ber Sensitivity ... 45
Sensitivity to Equivalence Ratio ... 45
Sensitivity to Initial Charge Pressure... 46
Sensitivity to Initial Charge Temperature ... 46
Sensitivity to Initial Com pression Ratio ... 47
Figure 5.13 Combustion Curves, Model vs. Data $=0.4, Rc= 16, To=60 Po=0.75 atm...72
Figure 5.14 Combustion Curves, Model vs. Data $=0.5, Rc= 16, To=60 Po=0.75 atm ... 72
Figure 5.15 M odel vs. Data Comparison: Ignition Delays... 73
Figure 5.16 M odel vs. Data Comparison: Burn Times... 74
Figure A . 1.1 Control Panel ... 80
Figure A .2.1 RCM Speed Ring ... 81
Figure A.2.2a RCM Oil Rim ... 82
Figure A.2.2b RCM Speed Ring ... 83
Figure A .2.3 RCM Piston Liner ... 84
Figure A .2.4 RCM Spacer...85
Figure A .2.5 RCM Fast Acting Valve... 86
Figure A.2.6 M odification of O-Ring Groove ... 87
Figure A .2.7 Compression Ratio Shim ... 88
Figure A.2.8 Thermal Insulator... 89
Figure A.2.9a Poppet Valve Casing... 90
Figure A.2.9b Poppet Valve Legs ... 91
Figure A.2.9c Poppet Valve Base ... 92
Figure A.2.9d Poppet Valve Base ... 93
Figure A.2.9e ACM E Shaft... 94
Figure A.2.9f ACM E Shaft... 95
Figure A .2. 10 RCM Stands ... 96
CHAPTER 1
INTRODUCTION
1.1 Motivation
With emissions regulations on IC engines becoming more stringent every day, and with rising oil prices, there is an urgent need to improve current engine technology and develop higher efficiency, lower emissions engines. Currently diesel engines have the highest brake efficiencies among IC engines (up to
45% compared with 33% for Spark Ignition engines) due to their higher compression ratios and their operation at lean fuel/air ratios. However, due to problems with air utilization during combustion, diesel engines form excessive amounts of soot, which shows up in particulate emissions in the exhaust. Hydrocarbon emissions in diesels also contribute to particulates, and nitric oxides levels are comparable to those of SI engines. Thus, although the SI engine is less efficient, its emissions are now lower because effective catalyst technology has been developed. Additionally, the SI engine remains attractive due to its high power-to-weight ratio, making it favorable for compact applications. Clearly, both engines have their advantages and disadvantages, and thus they each dominate particular markets.
Current research efforts in Homogeneous Charge Compression Ignition are trying to develop higher efficiency, lower emissions engines. This alternative combustion process is a hybrid between diesel and SI. Similar to the spark ignition engine, a well-mixed fuel-air mixture is introduced into the combustion chamber, however, unlike the SI engine, there is no spark; the mixture is spontaneously ignited during the compression stroke (like in a diesel). With a lean homogeneous mixture, locally rich areas are eliminated and combustion temperatures are lower, thus, the formation of NOx and particulate emissions can be significantly decreased. A more complete combustion can be achieved with a uniform lean mixture. Additionally, more expansion work can be extracted during lean operation due to the higher value of y. HCCI is also known to have high and very repeatable energy release rates, approximating the ideal Otto cycle when properly phased in relation to the engine cycle [1]. Although these characteristics make HCCI an attractive concept, there are still many challenges to be resolved.
1.2 Background
Early work in Homogeneous Charge Compression Ignition started in Japan [2], where this process was first known as Active Thermo-Atmosphere Combustion (ATAC). This type of combustion, characterized by the autoignition of a uniform, lean, fuel-air mixture was identified as a third combustion process of the internal combustion engine (the other two being Diesel and Spark Ignition). The high efficiency and low emissions potential of this process, known to have high and repeatable energy release rates with little cycle-to-cycle variation, was quickly identified. There has been a growing interest in
HCCI, and this concept has been successfully applied in some engines over a limited range of loads and speeds. For example, in June of 1998, Nissan put on the market the first generation of engines which successfully implemented Modulated Kinetics (MK) combustion, a version of HCCI, at part loads [3]. Honda also incorporated HCCI at light load in a direct-injection two-stroke SI engine [4]. To better understand the benefits of such engines, it is necessary to first study the combustion process of HCCI.
1.3 HCCI Combustion Characteristics
Depending on the approach, HCCI fuel-air mixing can be achieved in various ways. One possibility is to form a fully homogeneous mixture in the intake system, similar to the SI engine. Another concept is to inject early into the cylinder. Fig. 1.1 presents HCCI concepts and configurations. Like in the diesel engine, there is no spark plug, and the mixture spontaneously combusts due to the pressure and temperature rise during compression. Different from the SI engine where there is a discernible flame front and a localized high-temperature reaction region, in the HCCI concept ignition occurs at many hot spots simultaneously and at the global equivalence ratio. Thus, unlike diesel, this process is not diffusion-controlled, so it is not constrained by the mixing rate at the interface between the fuel jet and oxidizer [1].
Since the mixture in HCCI is relatively uniform, with a lean equivalence fuel/air ratio, high-temperature burned gas regions are absent in the combustion chamber, drastically decreasing the production of NOx during combustion compared to a regular SI or diesel engine. The absence of local fuel-rich regions during HCCI combustion also lowers the formation of soot. With HCCI there are very small cycle to cycle variations, which is optimal for smooth engine operation. This is a significant advantage over SI engines, where large cycle-to cycle variations occur due to significant variations in early flame development. Due to the lean mixture conditions under which HCCI typically operates, however, the low burned gas temperature decreases the rates of fuel oxidation creating high levels of CO
and HC.
1.4 Challenges
One of the main challenges of HCCI is controlling the time at which combustion occurs. Since there is no physical event that marks the start of combustion, as in a SI or a diesel engine, it is difficult to control when ignition and fuel chemical energy release will occur, relative to piston position. This process must also be controlled over a wide range of loads and speeds to obtain high torque, and a high enough combustion efficiency must be obtained. Some methods for controlling HCCI have been proposed and utilized, and they are shown in Fig. 1.2. Another of the challenges that exists is achieving a highly or partially homogeneous mixture. High combustion rates due to the simultaneous burning of the bulk gas limit this process to highly diluted mixtures which lower the rate of combustion. As discussed
previously, limited versions of this process have already been incorporated in various engines; however in these applications HCCI occurs over a narrow range of loads. Thus there are many difficulties that must still be overcome to develop a successful HCCI engine.
1.5 Objectives
The purpose of this project was to produce a data base of energy release rates and use that data to develop and calibrate a combustion model of HCCI. The data, which were obtained in a rapid compression machine, provide a deeper understanding of the different conditions under which HCCI is feasible, and possible ways to control it. Of utmost important is determining the sensitivity of mixture ignition process and energy release rate to the mixture composition and state. A better knowledge, quantification, and modeling of these combustion characteristics will help determine plausible engine concepts for HCCI.
Figure 1.1: HCCI Concepts and Configurations
I I
Figure 1.2: Controllability of HCCI
CHAPTER 2
THE RAPID COMPRESSION MACHINE
2.1 Introduction
The rapid compression machine (RCM) is a piston in cylinder apparatus that compresses a fuel-air mixture in a short time, to high temperature and pressure, with the least heat and mass loss possible. It can be used to study the chemical kinetics of autoignition and energy release processes. The RCM is ideal for observing Homogeneous Charge Compression Ignition under engine-like conditions because it generates the pressure (4-16 MPa) and temperature (1800-3000 K) regime of a real engine in times comparable to engine compression times. After compression, the gases in a RCM autoignite at constant volume, and the pressure in the combustion chamber is measured. Thus, known pressure and temperature conditions allow for direct measurement of the autoignition and energy release behavior. As explained below, rapid compression machines offer well controlled and repeatable experimental conditions, accurate measurements of cylinder pressure, and in our case, the ability to vary several parameters such as compression ratio, initial gas composition, initial gas pressure, initial gas temperature, and piston driving pressure.
2.2 RCM Configuration
A diagram of the MIT RCM used for these experiments is shown in Fig. 2.1. This machine was
designed in 1990 by Dr. Park and Professor James Keck. The driving and piston motion mechanisms were adapted from Shell's Thornton rapid compression machine. The piston is locked at its starting position through a hydraulic system; it is then pneumatically accelerated, and then slowed down and stopped by oil pressure developed in the hydraulic pin and groove mechanism. There are only two movable parts, the piston and the fast acting valve, and they are both made out of 6061 aluminum. The rest of the parts are made out of cold-rolled mild steel. The piston is hollow, decreasing the inertial forces required for acceleration and deceleration. Its head can be changed, and heads with different piston/ring crevice configurations can be used.
The main components of the machine are labeled in the diagram. The driving chamber holds the pressurized gases that drive the piston. Its volume is large enough so that the driving pressure does not drop more than 5% during the expansion of the driving chamber gas, while firing the machine. Thus, constant driving pressure can be assumed during compression of the experimental gases. The two oil chambers shown, main oil reservoir and speed control chamber, are part of the hydraulic system that moves the piston. As explained below, these two chambers are connected and isolated by the fast acting valve. A complete explanation of the operation of this system is discussed in the Appendix. The piston is
smoothly decelerated through pressure generated in the stopping pin. In addition to changing the speed of the piston by varying the driving pressure, the speed can also be varied by rotating the speed ring, adjusting the orifice area through which oil flows. The combustion chamber holds the experimental gases, which are fed in through the poppet valve in the cylinder head. Section 2.8 gives a more thorough description of the gas handling system. The heating jacket around the cylinder circulates hot oil that raises the initial temperature of the combustion chamber. The piston stroke, which determines the initial piston position, can be varied by turning the stroke adjustment screw. Its threads are 1.5-12UNF, so each turn gives 1/12 inches of stroke [8]. The compression ratio can be changed and different clearance volumes and compression ratios can be used. Low viscosity mineral oil (UNIVOL 60) is used for operating the hydraulic parts of the machine.
2.3 Characteristics of the RCM
Besides being a good apparatus for studying chemical kinetics under controlled conditions, the MIT RCM is also useful due to its flexibility in changing various parameters, and close in simulating conditions from a real engine. The most important characteristics of the RCM are shown in Table 2.1. A range of compression ratios can be achieved through different combinations of strokes and clearance volumes. Likewise, various compression times can be obtained by varying the piston speed through different combinations of driving chamber pressure and oil flow orifice area. With different combinations of compression ratio, initial charge temperature, initial charge pressure, and initial charge composition, various realistic end-of-compression temperatures can be achieved.
Table 2.1 RCM Characteristics
Cylinder Bore 5.08 cm
Maximum Stroke 11 cm
Maximum Compression Ratio 19 Clearance Height 0.6-2.0 cm
Piston Length 17.2 cm
Piston Mass 0.97 kg
Maximum Driving Pressure 3.45 MPa Maximum Piston Speed 10 m/s Maximum Compression Pressure 7 MPa Compression Time 10-30 ms Max. Compression Temperature 1300 K
Figure 2.1
RCM Diagram
High Pressure Gas
Stroke Adjust nent
Driving Chamber
Core
eII
CbUI valve-Lockin
high pressu Oil Reservoir Pressu Fast Acting Valve
Speed Ring
Control Ring peed Control
iston-Locking ' Pi.
igh pressure oil Sopn i
Heatin Jacket Opening for
Pressure
Transducer Gas Chamber
DA~ g e oil re I oil R
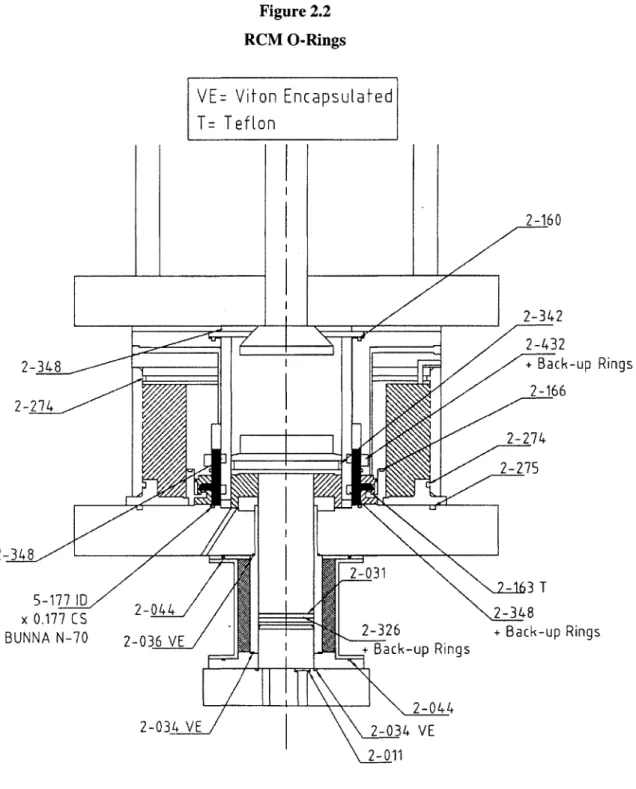
2.4 Specification of RCM O-rings
To ensure proper sealing and isolation of the different systems (hydraulic, pneumatic, gas handling), the rapid compression machine uses a variety of o-rings. These are shown in Fig. 2.2. Except for just a few, the majority of the rings are made out of viton. The combustion chamber used viton-encapsulated o-rings, due to their low hydrocarbon absorbtivity. A stiff teflon o-ring is used in the speed ring face seal with the fast acting valve to avoid misplacement of the ring between runs.
Figure 2.2
RCM O-Rings
VE= Viton Encapsulated
T= Teflon
2-160 2-4 2-348+B 2-274 -23 31 33T 5-177 ID x 0.177 CS 2-34 +348BUNNA N-70 2-036 VE Back-up Rings26+
2-034 YE up Rings ' ,,2 -0 44 2-034 YE 2-011
/ III,
2-3 z 42 32 ack-up Rings 1662.5 Basic Operation
The RCM operates through means of a hydraulic and a pneumatic system. As shown in Fig. 2.1, there are two oil chambers separated by the fast acting valve. When the fast acting valve is open (in its up position), both of these chambers are connected. The outer chamber is the main oil reservoir and it operates at relatively low pressures (30-40 psi). The center chamber, the piston locking chamber, is designed for high pressures (700 psi). After the machine has been fired, the piston is in its down position and the fast acting valve is open (up), thus both oil reservoirs are connected. To prepare for the next run, the main oil reservoir is pressurized with nitrogen, causing the oil to lift the piston until it hits the stroke stop. The chambers are then isolated by lowering the fast acting valve with pressurized gas (80 psi). The fast acting valve is then locked in place with high pressure nitrogen (500-1000 psi, depending on the solenoid valve rating). The piston is then locked with high pressure oil (P ;> Pdriving chamber ). This step is necessary because although oil can be assumed to be incompressible, this is not entirely true and locking the piston eliminates any variations in the initial volume and the compression time. After the combustion chamber has been loaded, and the required settling time has passed, the driving chamber is pressurized with nitrogen. There is now a force balance between the pressurized gases above the piston, and the pressurized oil underneath. As soon as the locking pressure on the fast acting valve is released, by opening the solenoid valve, the piston-locking high pressure oil opens the fast acting valve and the force balance is broken. The piston is accelerated by the driving gas, compressing the gases inside the combustion chamber. Before the end of compression, the piston is slowed down by the high pressure generated through the pin and grove mechanism, as shown in Fig. 3.1. This prevents the piston from damage, and provides repeatable compression. A detailed operating procedure for the machine is found
in Appendix 1.
2.6 RCM Plumbing
The plumbing of the RCM is composed of fours systems: hydraulic system, pneumatic system, oil-heating system, and gas handling system. Fig. 2.3 shows a diagram with the main lines and valves of the RCM plumbing. The gas handling system is shown separately in Fig. 2.4. All lines are " stainless steel with 0.035" wall thickness. Table 2.2 provides the relevant current operating pressures of the systems. The main oil reservoir operates at low pressures, while the piston locking reservoir operates at high pressure. The driving chamber has a pressure rating of 500 psi [8], and the rating on the current solenoid valve is 1000 psi. The oil-heating system is designed for low pressures (P<150 psi). Compressed nitrogen provides the required pressures for all the systems. The three most critical pressures for adequate and safe operation of the machine are the driving pressure, the valve-locking pressure, and the
piston-locking pressure. The operating pressures recommended by Park are shown in Table 2.3. The important thing to note is the maximum pressure rating on the driving pressure, and the proper magnitude of each pressure: Psolenoid(rated)>Pvave-locking>Ppiston-locking>Priving
Table 2.2
Current Operating Pressures
Valve Description System Operating Pressure (psi)
1 Piston and Valve Up Pneumatic 40
2 Fast Acting Valve Down Pneumatic 80
3 Fast Acting Valve Lock Hydraulic 700
4 Piston Lock Hydraulic 550
5 Driving Pressure Pneumatic 450
6 Oil Heating System Hydraulic P<150
7 Solenoid Valve Pneumatic P<1000 (current rating on valve)
Table 2.3
Operating Pressures Recommended by Park Driving Piston-Locking Valve-Locking Pressure (psi) Oil Pressure Oil Pressure
(psi) (psi) 100 150 250 200 300 450 300 450 650 400 600 900 500 700 1000
Figure 2.3
Diagram of RCM Plumbing
Gas Lines and Oil Lines of RCM Plumbing
pressure regulator 2-way valve I H G ( C F M oil pump 700 N2 B E 1000 N2 FL jo L K oil dump piston-locking
high pressure oil
300 psi N2 vent t
vent
12-valve-locking
100 psi N2 21--- ~ 3 high pressure oil
6ven or vact M
oil ven vacuun
trench muffler 50 psi N2 3000 psi N2 bottles oil heater
Oil Lines
Air Lines
Oil Heating System
oil reservoir
I VC11 e
Figure 2.4 Gas Handling System
To Vacuum
Vacuum Gauge
To Experimental
Gases
Piston
Combustion
Chamber
MKS
Pressure
Transducer
Injection
Septum
Poppet
Valve
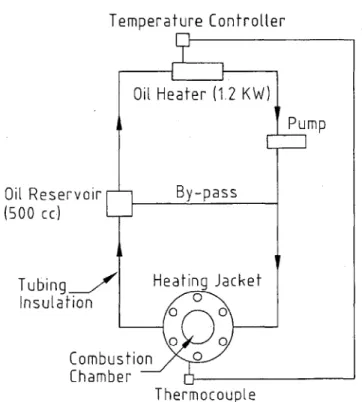
2.7 Charge Preheat System
This system is used to vary the initial charge temperature. It consists of an oil-heating system which heats up the combustion chamber, and an air heating system which heats the lines of the gas-handling system. The oil heating system is composed of a centrifugal pump and an Omegalux Strip heater arranged in a loop as shown in Fig. 2.5. This system has the capacity of delivering 1200 W of power at 120 V, and the power is controlled from 0-100% using a variac. The air heating system is made up of heaters wrapped around the gas handling system lines. Power delivered by these heaters is also controlled by a variac. When operating the charge pre-heat system one must first calibrate the oil temperature as well as the temperature of the gas handling system tubing, so that the air inside the combustion chamber and the gas handling lines reaches the desired initial temperature. This is done through bench tests, and Table 2.4 shows the oil and tubing temperatures required to achieve a certain charge temperature. To measure this initial temperature, a thermocouple was inserted through the pressure transducer opening. The combustion chamber was then vacuumed to simulate the real experiment, and then filled with air. The average steady state temperature was then recorded. Radial and axial temperature variations will exist inside the combustion chamber due to the hot walls, and the cool piston. Thus, the measured temperature was the temperature at the geometric center of the chamber.
Figure 2.5 Oil-Heating System Temperature Controller L .
Oil Heater (1.2 KW)
PumpOil Reservoir By-pass
(500 cc)
L
Tubing Heating Jacket
Insulation 0 0
CoTmhbusion 0
Chamber
Table 2.4
Calibration of Oil and Tubing Temperatures Target Initial Required Oil Required Outer
Charge Wall Tubing
Temperature (C) Temperature (C) Temperature (C)
50 65 64
60 80 68
70 105 85
75 115 95
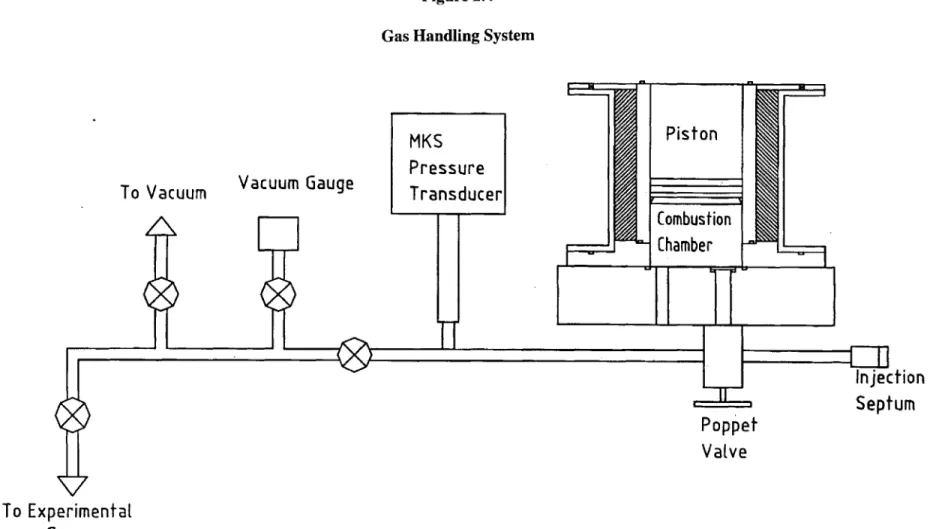
2.8 Gas Handling System and Filling Procedure
Figure 2.4 shows a diagram of the gas handling system. It consists of the combustion chamber and the lines that carry the gases to the combustion chamber. One end of the system is sealed with a gas chromatograph septum, while the other end is sealed with a two-way valve. The poppet valve connects the gas lines to the combustion chamber. This valve is sealed with a 2-011 o-ring, and the seal is designed to improve during compression and combustion of the gases, due to the high pressure inside the combustion chamber, which forces the valve down. However, the valve is not designed to see high pressures from its bottom side.
To prepare a charge of air-fuel mixture prior to firing the machine, the gas handling system is first vacuumed to less than 5 torr. This ensures that the pressure inside the combustion chamber and gas lines is kept below the mixture vapor pressure (for this project's experiments, the mixture vapor pressure was greater than 15 torr). After vacuuming the system, the two-way valve is closed and the proper amount of liquid fuel is injected through the GC septum. The fuel vaporizes and diffuses into the heated combustion chamber and the gas lines, heating up while it enters and as it remains in the gas lines and the combustion chamber. The fuel is then allowed to settle for ten minutes' reaching an equilibrium pressure and the desired pre-heat temperature. The partial pressure is recorded, and then air is introduced into the system through the two way valve, until the desired change in partial pressure is obtained. Ten minutes are also allowed to achieve mixture homogeneity. The poppet valve is then closed and the mixture is ready to ignite as soon as the machine is fired. The mixture composition can be determined from the partial pressures with the following formula:
S= (Pe /Pai,)(Al F)s (Mf I Ma) (2.1)
Where:
Pfuel= Partial pressure of the fuel
1 This number, determined in previous experiment with this RCM, is based on the time to reach pressure equilibrium.
Paj=Partial Pressure of the air
(A/F)S= Stoichiometric ratio of the mass of the air to the mass of the fuel Mf=Molecular weight of the fuel
Ma=Molecular weight of the air
After the machine is fired and the gases are compressed, the poppet valve is opened and the burned gases are vented. The combustion chamber is then flushed with dry nitrogen and vacuumed once again before the next run. In past projects, a dummy run with oxygen was performed after each trial to improve the repeatability of the experiments. It was believed that the effect of this run was to burn species remaining on the walls and the o-rings, so that they would not carry on to the next trial, and all runs would then be independent of each other. During this project this technique was tried a few times but was then dropped. With the combination of adequate flushing and consistent mixture composition and initial conditions, good repeatability was obtained. Equation 2.1 should emphasize the importance of keeping consistent conditions to achieve repeatability. One of the most critical factors, the equivalence ratio is dependent on both the partial pressures and the initial charge temperature, and thus, careful and consistent measurements of these variables are necessary. It is essential to learn how to reproduce the conditions for each trial in order to compare the repeatability of identical runs.
2.9 Instrumentation and Data Acquisition
To determine the initial mixture composition of the charge, the partial pressures of the gases inside the gas handling system were read with a MKS 122A (range 0-1000 mmHg) diaphragm pressure gauge with an accuracy of 0.1 mmHg. The voltage signal produced by the MKS 122A transducer was read by an MKS PDR-D 1 unit. To measure the combustion chamber pressure, a Kistler 6125 piezoelectric pressure transducer was used. The transducer was periodically calibrated with a dead weight tester. This transducer is placed in the bottom of the combustion chamber as shown in Fig. 2.1. The voltage produced by the pressure transducer was amplified with a Kistler 5010 amplifier box. This voltage was then sent to the data acquisition system, and recorded using a LABVIEW VI. Data was sampled 100 times per millisecond. The data was processed with MATLAB.
CHAPTER 3
RAPID COMPRESSION MACHINE MODIFICATIONS AND IMPROVEMENTS
3.1 Introduction
Several modifications were made to the MIT rapid compression machine to improve its operating repeatedly and to facilitate the assembly and disassembly process. In the past, several mechanical problems were observed with the machine. These were mainly related to oil leakage due to improper o-ring sealing and due to the high pressures used. These problems were temporarily solved by loweo-ring the operational pressures, modifying parts, and using RTV to keep o-rings in place or to fill gaps. However, the problems still persisted. From the beginning of this project, careful measurements were made of all the RCM components. New drawings were made and they were compared against the original drawings, and several parts were found to be dimensionally incorrect. They had not been machined to the specifications indicated in the original drawings. Some of the modified parts are discussed here and the drawings are shown in the Appendix. Other areas of improvement include the plumbing system, the implementation of the oil heating system, replacement of viton o-rings for viton-encapsulated with teflon rings, and the elimination of all gaskets.
3.2 RCM Speed Ring
One of the main inconsistencies of the machine was that the parts were not registering on the proper location. As shown in Fig. 3.1, the surface of the base plate was intended to be the main point of reference of the machine. The area control ring and the high pressure oil chamber would rest on the base plate supporting and fixing the location of all other parts. However, due to dimensional inconsistencies, the area control ring was registering on the speed ring, shifting the position of the fast acting valve. As a result, the fast acting valve did not provide an adequate seal, and the speed ring, which was designed to rotate freely about the area control ring, was fixed because it carried the load of the entire machine. To
assure that all the parts were registering properly, the speed ring was modified as shown in Fig. A.2. 1.
3.3 RCM Oil Rim
This part is responsible for containing the oil of the main reservoir. It is not designed to see high pressures, as it only has a snug seal with o-rings, and it should be able to rotate with the speed ring. The oil rim was also contributing to the registration inconsistencies. This part was originally machined too tall, so due to this interference, the RCM core (see Fig. 2.1) rested on the oil rim rather than on the area control ring. This created leakage between the core and the area control ring. Also, the entire weight of the core and of the driving chamber would be supported by the oil rim, again constraining the motion of
the speed ring. Modifying this part was simple, as shown in Fig. A.2.2a. In order to keep the speed ring and the oil rim together during a rotation, set screws were adapted to the oil rim as shown in Fig. A.2.2b, holding both of these pieces together. Other small but significant modifications include side notches for ease of assembly and disassembly, and the addition of an optical oil tube to monitor the level of oil inside the machine. Figure 3.1
I-=1*
LI1~
/ ITqL
-eI
9
3.4 RCM Piston Liner
This part was also dimensionally incorrect, being too tall, creating a gap that was too big to seal with the o-ring between the RCM core and this high pressure oil chamber. The modification, and the machining down of the legs of the chamber was straightforward (see Fig. A.2.3). The interior walls of this part were also polished so that the piston would move smoothly inside the chamber, without damaging the piston o-rings.
3.5 RCM Spacer
To eliminate the gasket that provided a seal between the driving chamber and the RCM core, an aluminum plate was machined as shown in Fig. A.2.4. The center of this part was designed to hold an o-ring, being constrained on its sides by the inner walls of this plate, and on the bottom by the top surface of the RCM high pressure chamber. The weight of the driving chamber was sufficient to compress the o-ring, creating a good seal.
3.6 Fast Acting Valve (Fig. A.2.5)
The most critical part of the machine, the Fast Acting Valve, is responsible for separating the main oil reservoir and the high pressure piston locking chamber. In order to isolate both chambers the fast acting valve must seal simultaneously at two points. In practice this is a poor design, as it is difficult to provide this double seal. The valve was sealing at the upper point, but because dimensions did not allow proper registering, it was not sealing in the bottom. Once the parts were modified to register at the proper location, the fast acting valve also had to be machined to tight tolerance so that there would not be a gap left, and if there was, it would be small enough that the extrusion from the o-rings would be able to seal it. Round corners were also machined into the inside of the fast acting valve for ease of assembly, and to prevent any damage to the o-rings around the RCM high pressure chamber. The valve was also polished because it was out of round. The results of these modifications were better sealing and much smoother dynamics.
3.7 Dovetail Groove
One of the more challenging problems with the operation of the RCM was the popping out of the o-ring which creates the seal between the high pressure oil chamber and the low pressure oil reservoir (see Fig. A.2.6). The Fast Acting Valve presses against this o-ring prior to firing the machine (creating the seal), and when the solenoid valve is opened, high pressure oil flows out radially from the high pressure chamber and into the low pressure reservoir. Initially, the high pressure oil would push the o-ring out of place because of a defective o-ring groove, which was made larger than specified. Although
custom-made o-rings were used to solve this deficiency, they still moved out of place. It is believed that this effect was mostly due to high pressure oil getting into the groove, which did not provide a perfect seal, and also due to lift from the high speed oil flowing over the curved o-ring surface. RTV was used to fix the problem temporarily. However, RTV shed pieces in to the oil, and the o-ring would still move out of place after some 30-40 runs. A better solution was to make the groove a dovetail shape as shown below, designed to keep the o-ring in place in a face seal situation. However, despite the friction opposing the oil pressure pushing the o-ring out, this did not solve the problem completely. To eliminate the problem, the groove was filled with a special silicon glue (Omnivisc 1002-provided by BMW), prior to placing the o-ring in place to eliminate all gaps. The o-o-ring was then pushed in place, and the excess glue removed. This has successfully resolved the problem.
3.8 Compression Ratio Shim
To eliminate all the gaskets and spacers that were previously used with different clearance volumes, a new compression ratio shim was machined. This new shim was made of the required thickness to eliminate any gaps. O-ring grooves were machined into this piece to provide a seal for the oil heating
system. See Fig. A.2.7.
3.9 Thermal Insulator
As part of the oil heating system implementation, an insulation shim was machined as shown in Fig. A.2.8. This shim is made out of phenolic, and insulates the base plate of the RCM, which acts as a heat sink, from the hot circulating oil. The shim had o-ring grooves to provide a good seal for the oil-heating system.
3.10 Modified Combustion Chamber Valve
Due to frequent failure of the threads in the poppet valve mechanism, a new valve was designed. This valve has stronger threads, and will not fail as the previous one (see Figs. A.2.9a, b, c, d, e, f).
3.11 Other Improvements
Other improvements include machining down the combustion head to provide adequate o-ring extrusion (and better seal), machining stands for the RCM (Fig. A.2. 10) and various improvements in the plumbing system. Appendix A. 1.1 shows a diagram of the panel from which the entire machine was controlled. In addition to better organization and logistics, the plumbing was significantly improved by containing all the oil in a closed system. A mist system was implemented to filter the high pressure oil-containing air that was vented. Another improvement, as has already been discussed, was the implementation of the oil
heating system. To minimize hydrocarbon absorption, all the o-rings in the combustion chamber, with the exception of the poppet valve o-ring, were replaced with viton-encapsulated o-rings. The poppet valve viton-encapsulated o-ring was too rigid, and did not provide a good seal. All gaskets were eliminated and replaced with o-ring seals. These modifications have made a more robust and repeatable machine.
CHAPTER 4
RAPID COMPRESSION MACHINE EXPERIMENTS
4.1 Compression Calibration
After testing the dynamic behavior of the machine and making the required modifications to ensure proper motion and sealing, the compression behavior of the machine and its repeatability were checked. Several runs were performed with air at different compression ratios, at an initial temperature and pressure of 300K and 1 atm, respectively. End of compression pressures were then compared with isentropic calculations as shown in the example below:
1 1
vr = V, - =117 -= 73.3 which gives P, = 3390 (4.1) \ rc )
where the compression ratio is 16 and values for the reduced volumes vr , and reduced pressures Pr, are obtained from tables of thermodynamic properties of air at low density. The pressure at the end of (adiabatic) compression is then obtained from:
P 3390
P2 = r =
46
atm (4.2)+
P =Iati
73.4Using the air tables, the temperature at the end of compression can also be found, and for this example:
T(Pr2)=863K (4.3)
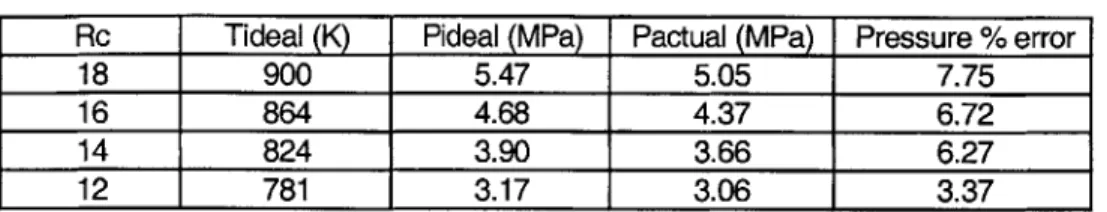
Figure 4.1 shows experimental data for the compression of air (Rc=14). The peak isentropic value of the maximum compression pressure is also shown. For this set of conditions, the experimental values are within 7% of the ideal value. This indicates that there is little heat loss or leakage during compression. This plot also reflects the good repeatability of the machine: the three consecutive runs are basically indistinguishable. Figure 4.2 shows the compression of air for various compression ratios, and the results of several runs are summarized in Table 4.1. As noted in this Fig., the deviation of the experimental results from the theoretical value increases with compression ratio because of increased heat transfer at higher temperatures (it is believed that it is heat transfer and not leakage what causes this discrepancy since the time scale is very small). As shown below, all experimental results are at least within 8% of the ideal value.
Table 4.1 Compression of Air
Rc Tideal (K) Pideal (MPa) Pactual (MPa) Pressure % error
18 900 5.47 5.05 7.75
16 864 4.68 4.37 6.72
14 824 3.90 3.66 6.27
12 781 3.17 3.06 3.37
Figure 4.1
Compression of Air, Rc=14, Po=1 atm, To=300K
Isentropic 0 5 10 15 20 25 30 35 40 Time (ms) 4 3.5 3 2u n~ 2.5 2 1.5 1 0.5 0
Figure 4.2
Compression of Air at Various Compression Ratios. Po=1atm, To=300K Isentropic Rc=16 .Isentropic Rc=1 4 - . . . .2. . . . .. .-.. .. 6 5 4 S3 2 1 0 25 30 35 40 4.2 Combustion Calibration
This section covers the combustion curves obtained with the RCM as well as some of the measurements. These curves were filtered to eliminate the high pressure oscillations generated due to the rapid energy release during combustion, facilitating the post-processing of the data. The Matlab code used to filter the signals is found in the Appendix. A typical filtered' combustion curve obtained with the RCM is shown in Fig. 4.3. The gas mixture is compressed in about 10 Ms2
, to a maximum pressure and temperature which marks the end of compression. Due to heat transfer and boundary layer growth in the combustion chamber, a slight decrease in pressure and temperature follows during a delay period prior to combustion. This delay ranges from 20 to less than 4 milliseconds, depending on the mixture composition, its initial conditions, and the compression ratio. The mixture then spontaneously ignites reaching a second peak in pressure and temperature, after which heat transfer and boundary layer growth once again dominate causing a drop in pressure.
I an unfiltered curve is shown in Fig. 4.8
2 the compression time is defined as the time from the start of compression (P>Po), to the end of compression (marked by the peak pressure),
0 5 10 15 20
9 8 7 6 0z S5 "'4 3 2 1 0
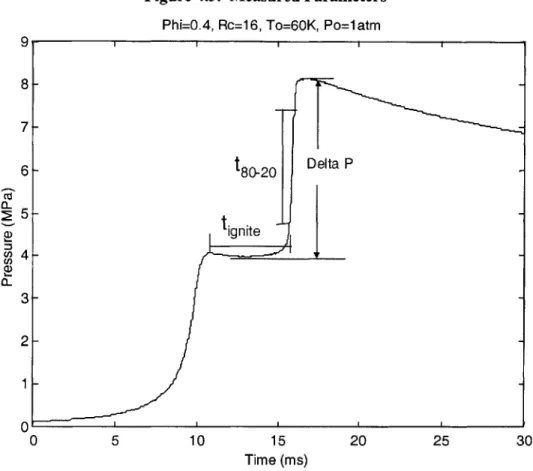
Figure 4.3: Measured Parameters Phi=0.4, Rc=16, To=60K, Po=latm
- 80-20 Delta P
tignite
0 5 10 15
Time (ms)
20 25 30
As with the inert gas runs, the compression of the fuel/air mixture was also checked against ideal calculations. An average value of gamma was calculated using STRAPP, which is a computer program that calculates the thermophysical properties of mixtures and pure fluids. The inputs to this software are the mixture composition, pressure, and temperature. The average end of compression temperature is calculated using the ideal gas law, and used together with the maximum compression pressure to calculate gamma at the end of compression. The final pressure and the core gas end-of-compression temperature
can then be calculated using the following isentropic relationships:
PV7 = constant (4.4)
T2 = TI- (4.5)
To check the combustion state of the burned gases, and to obtain a better understanding of the results produced with the RCM, equilibrium combustion calculations are conducted with CHEMKIN. The input data are the number of moles of each component for a given mole of air (the mixture composition) and the end of compression temperature and pressure, which serve as the initial conditions. Constant volume combustion is then computed with the internal energy held constant. After each combustion calculation,
CHEMKIN outputs the equilibrium pressure and temperature. The calculated change in pressure due to combustion can then be compared against the data. For the CHEMKIN results, this change in pressure is defined as the equilibrium pressure less the initial pressure: (Pcombustion-Pcompression). Due to the slight pressure drop during the delay period, the change in pressure definition for the experiments is the equilibrium pressure less the minimum pressure after compression but before combustion (Pcombustion -Pmin).
Two other important numbers that are extracted from the data are the ignition delay and the burn
time. The ignition delay is defined by:
Td "2= % - tend of compression (4.6)
where:
t20% 3= time to reach 20% of the change in pressure due to combustion
tend of compression = time at which the peak pressure occurs during compression.
The burn time is defined by:
Tb = t80 % - t20 % (4.7)
where:
t8 0% = the time to reach 80% of the change in pressure due to combustion.
All the important variables that are extracted from the data are labeled in the Fig 4.3.
4.3 Heat Release During Ignition Delay
Comparing the combustion curves, with the compression curves of inert gas at the same compression ratio, it can be seen that the post-compression, pre-combustion pressure drop is different for both cases. After the compression of the inert gas, the pressure drops approximately with the square root of the thermal diffusivity (alpha). This is indicative of heat transfer due to boundary layer growth, and will be discussed further in Chapter 5. However Fig. 4.4 shows that during combustion the post-compression pressure does not drop at this same rate. Although heat loss due to boundary layer growth still follows the same relationship (square root of alpha times time), chemistry starts right at the end of compression, creating a rise in pressure. Assuming that the gas constant R, for both the inert gas runs and the fuel/air mixture is approximately the same, the change in energy released during the delay time can be assumed to be proportional to the change in pressure:
%AEnergy Released
= l''nert AP (4.8)P - P
AP
max inert max
3 The 20 and 80% values are used to clearly separate ignition, and the slower end of combustion from the main burning process
Where Pinert is the pressure from the inert gas compression curve and AP is the difference between the combustion curve pressure and the inert curve pressure at a given time during the delay period. Thus, the amount of fuel energy that has been released can be roughly calculated by comparing the change in post-compression pressures between the combustion curve and an inert gas curve for the same condition. For example, for Fig. 4.4, the percent of fuel burned at the indicated point, right before rapid combustion is approximately:
AP
%AFuel burned
=
=10%
(4.9)
APMOAmax
4.4 Reproducibility of Combustion Curves
Using adequate fuel preparation and mixing procedures, the combustion process in the RCM is fairly reproducible, taking into account the fact that combustion is difficult to replicate. Figures 4.5 and 4.6 show the repeatability of the combustion in the RCM using a 90 octane number Primary Reference Fuel and isooctane, respectively. As these Figs. show, good combustion repeatability can be achieved in the RCM and it is mostly dependent on having a consistent mixture filling/preparation procedure.
Figure 4.4: Energy Released Before Rapid Combustion Rc=16, To=60C, Po=1 atm
12 10-90 O N, Phi=0.4 8-cc a-Air 4- _
-Energy Released Before Rapid Combustion
2-0
-5 0 5 10 15 20
Figure 4.5: Combustion Repeatability (90 ON PIRF)
90 ON, Phi=0.4, Rc=16, To=60C, Po=latm
-5 0 5 10 15 20 25 30
Time (ms)
Figure 4.6: Combustion Repeatabilibty (Isooctane) Isooctane, Phi=0.4, Rc=16, To=60C, Po=latm
2 0 5 10 15 20 25 30 Time (ms) 12 10 U, (, 2~ 8 6 4 2 C 1 10 U, , (n 8 6 4 2 -5
'
4.5 End-of-Combustion Variations
Occasional irregularities in the combustion process were also observed as shown in Fig. 4.7. There are several possible reasons that can contribute to these differences in the combustion process. Inconsistent mixing procedures can give rise to experiment-to-experiment differences in the equivalence fuel/air ratio, resulting in runs with different initial conditions. Other reasons include leakage or blowby of the combustion gases, hydrocarbon absorption (due to o-rings or the thin film of oil in the combustion chamber wall), and perhaps differences in the quenching of the HCCI combustion process depending on the homogeneity of the mixture.
Figure 4.7: End-of-Combustion Variations 90 ON, Phi=0.4, Rc=16, To=50C, Po=latm
8 7 6 25 3 2 1 0
0
5 10 15 20 Time (ms) 25 30 35 404.6 Knock and High Pressure Oscillations
Figure 4.8 shows an unfiltered pressure signal. During combustion the curve shows a steep pressure rise followed by high frequency oscillations. This pressure effect is real, and the frequency of these oscillations was found to be approximately 37 kHz, which is close to the calculated frequency for oscillations in both the gas and the combustion chamber. The steep pressure rise responsible for these oscillations was common at an equivalence ratio of around 0.4 or greater, and it is a current controllability
concern for successful implementation of HCCL. For the purpose of analyzing the data, all curves were filtered using a 10 point forward average as shown in the MATLAB program in Appendix 4.
Figure 4.8: Knock Oscillations 90 ON, Phi=0.5, Rc=16, To=60C, Po=latm 16 14- 12-10-
-0-6
4-2 0 8 10 12 14 16 18 20 22 24 26 28 30 Time (ms) 4.7 Piston ReboundFigure 4.11 shows a problem that was experienced with especially high combustion pressures: piston rebound. Whenever the pressure in the combustion chamber rose high enough, the pressure-force on the piston became greater than the downward force from the compressed gas in the driving chamber. Consequently, there would be a force imbalance which would push the piston up. The increase in volume would cause an expansion of the gases, dropping their pressure and temperature. Due to the inertia of the piston, it would overshoot, and the driving pressure force would become greater than the opposing combustion chamber pressure, forcing the piston down to its original locked position. The force balance on the piston was calculated, and showed that the pressure force from the gases was high enough to accelerate the piston upwards. To fix this problem, a higher driving pressure was used to lock the piston in place. There is however a limit on this driving pressure.
In order to increase the driving pressure, the piston locking pressure must also be increased, and consequently, the fast acting valve locking pressure also needs to be increased. To handle higher
pressures, the solenoid valve was replaced with a higher pressure rated valve. There is however a 500 psi design limit on the driving pressure, imposed by the maximum possible stress allowed by the driving chamber. Thus, for mixture conditions where the combustion chamber pressure is very high, it will not be possible to lock the piston. This problem was observed mostly for high octane fuel-air mixtures at an initial pressure of 1 atm, compression ratio greater than 16, and an equivalence ratio above 0.5.
Figure 4.9: Piston Rebound
Isooctane, Phi=0.85, Rc=15.8, To=300K, Po=133kPa 20 18-16 - -CO, 0-1 1 5 10 15 20 25 30 Time (ms) 4.8 Sensitivity Study
During the initial testing stage, various parameters were varied to determine their sensitivity. These parameters were type of fuel (octane number), compression ratio, initial charge temperature, relative fuel-air ratio, and initial pressure. The sensitivity to some of these variables is shown in Figs. 4.10 through 4.14. These Figs. show that this spontaneous combustion process depends mostly on octane rating, compression ratio, fuel-air equivalence ratio, and initial charge pressure. These last two are related because they both affect the amount of chemical energy and species concentrations in the mixture. The compression ratio on the other hand affects the post compression temperature, which has a strong effect on the kinetics of combustion.
4-2- 3 Runs 0- 8- 6- 4-2 n