HAL Id: ineris-00973700
https://hal-ineris.archives-ouvertes.fr/ineris-00973700
Submitted on 4 Apr 2014HAL is a multi-disciplinary open access
archive for the deposit and dissemination of sci-entific research documents, whether they are pub-lished or not. The documents may come from teaching and research institutions in France or abroad, or from public or private research centers.
L’archive ouverte pluridisciplinaire HAL, est destinée au dépôt et à la diffusion de documents scientifiques de niveau recherche, publiés ou non, émanant des établissements d’enseignement et de recherche français ou étrangers, des laboratoires publics ou privés.
Multi-scale analysis of water alteration on the rockslope
stability framework
Sandra Dochez, Farid Laouafa, Christian Franck, Sylvine Guedon, François
Martineau, Julie d’Amato, Albane Saintenoy
To cite this version:
Sandra Dochez, Farid Laouafa, Christian Franck, Sylvine Guedon, François Martineau, et al.. Multi-scale analysis of water alteration on the rockslope stability framework. 16. French-Polish Colloquium of Soil and Rock Mechanics, Jul 2013, Montpellier, France. pp.NC. �ineris-00973700�
MULTI-SCALE ANALYSIS OF WATER ALTERATION ON THE ROCKSLOPE
STABILITY FRAMEWORK
Sandra DOCHEZ*1,2, Farid LAOUAFA1, Christian FRANCK1, Sylvine GUEDON2, François MARTINEAU2, Julie D’AMATO2, Albane SAINTENOY3
[email protected], [email protected], [email protected],
[email protected], franç[email protected], [email protected], [email protected]
1 INERIS, Parc Technologique ALATA, BP 2, 60550 Verneuil en Halatte, France
2 IFSTTAR, Boulevard Newton Champs sur Marne, 77447 Marne la Vallée Cedex 2, France 3 Université Paris Sud, IDES, UMR 8148 UPSUD-CNRS, 91405 Orsay Cedex, France
ABSTRACT: Water is an important weathering factor on rock discontinuities and in rock mass mechanical behavior. The increase of rainfall in frequency or in intensity highlights some problems on the rock slope stability analysis. The aim of this paper is the multi scale analysis of the chemical impact of water on rock (surface roughness and matrix). In this study we show how water induces degradation and thus may decreases the stability of the discontinuous rock mass. Water is known to have significant erosion and dissolution effects on rock surface or rock matrix. The chemical features of water such as temperature, pH or salinity make it a “good” candidate to rock degradation. This study has two main components. The first one is the study of water-solid chemical mechanisms and the other is the analysis of the mechanical response of the discontinuity modified by the water alteration. The stability of the rock mass is naturally a function of the type and the space distribution of discontinuities. The study aims also to evaluate the effect of water flow on the rock slope stability and it is performed at two space scales: laboratory (micro scale and macro scale) and in situ scales. The last one is still under investigation and will be presented.
KEY WORDS: Water, chemical degradation, rock discontinuity, stability.
1 INTRODUCTION
Roads are frequently closed because of collapsing boulders or more generally by rock fall phenomena. These events are mainly induced by the presence and the behavior of discontinuities in mountains rock mass. As a matter of fact, theses discontinuities play a major role on the stability of the rock slopes [1]. An event as heavy rains is an important factor of rock stability. The Intergovernmental Panel on Climate Change (IPCC) [2] related the phenomena of increasing precipitations and rise in altitude permafrost due to climate change will impact the occurrence of the rock fall phenomenon. A number of large-scale slope movements is also linked to precipitation (rain and snow melting [3]). In this framework water is considered as an important weathering factor because of the specificity of its molecule which confers to it a strong erosive power [4]. Water effects in fractured media are significant by the interactions between water and rock. Many reactions either mechanical pressure or chemical dissolution are involved in rock weathering. Dissolution is certainly the main cause of limestone weathering due to its mineralogy [5][6][7]. Indeed one of the main mineral of limestone is calcite (CaCO3). This crystal is very sensitive to dissolution, particularly with water acidified. It
shows an effervescence due to CO2 formation thanks to the reaction with acid [4]
CaCO3+2H3O +
-> Ca2+ + CO2 + 3H2O
It is known that water pH of natural waters varies between 4 and 9 [4]. The reaction between water and calcite shows dissociation with product of reaction calcium ion and carbonate ion
CaCO3 + CO2 + H2O -> Ca 2+
+ 2HCO3
In addition of chemical reactions, there are also physical mechanisms whose modify the rock cohesion in order to open the way of chemical degradation [8]. Some features of the rock will be modified by the influence of water [8][9]. This paper will focus on the behavior of discontinuities subjected to chemical action of water. Two experiments reproduced in laboratory showed the influence of water degradation on rock discontinuities. That degradation will be accelerated by a decrease of pH water. The first one considers the alteration of a rock bridge, the rock shape and the shear strength evolution. The second analysis presents the dissolution rate and the roughness evolution. Finally we present the in situ block test under investigation.
2 ALTERATION OF LIMESTONES IN LABORATORY
In order to examine the behavior of discontinuities subject to water alteration several series of experiments are performed. The alteration is performed in laboratory according to type of stone and water flow. This section shows how water may cause discontinuity degradation. The alteration is performed on six different limestone’s sample (Table 1) from French quarries. Four of them are oolitic limestones as Pierre de Lens (Lens Stone) from south of France and Pierre de Caen (Caen Stone) from Normandy, Chamesson and Larrys are from Burgundy. The others as the Comblanchien is a micrite with some stylolitic joints and tension cracks and the sixth named Montagnole is a micrite and locally detritic with tension cracks and stylolitic joints. Some of their properties are given in (Table 1).
Table 1: Some properties and features of the different limestones used in the experiments.
Name Caen
Stone
Lens Stone Larrys Comblanchien Chamesson Montagnole
Density (kg/m3) 2050(5) 2185(5) 2573(5) 2674(5) 2230(3) 2680(8)
UCS* (MPa) 26 50(3) 175(5) 180(1) 80(3) 145(8)
Total porosity (%) 24 14(3) 6.7(4) <1(5) 17,4(3) 0,7(8)
Porosity Hg (%) 17(5) 15(5) 3,5(5) ND 16.1(3) ND
Mean radius pore (nm) 1900(5) 1600(5) 52(5) 30(7) 200(3) ND
Capillarity (g/m2/s0,5) 143(2) 60(2) 10(2) 0,4(1) 66 ND
Permeabilityy (µD = 9.869.10-19 m²)
20000(6) 409(3) 15(4) 0,05(3) 88(3) ND
Sources :1site carrière SETP, 2R.Bost (2008), 3A.Saad (2011), 4M.Bost (2008), 5J.D’Amato (2012), 6E.Nauleau (2010), 7Bachaud
(2009), 8Rapport Géolithe (2006). UCS* : uniaxial compression strength. ND : not determined
Two experiments are performed. The first experiment is based on quasi-static water, which means that there is “no” flow of the solution on the sample. In that case it is simulated a water which comes into the discontinuity and remains in it at rest. In the second experiment, the water is flowing in order to model a runoff inside the discontinuity during rains fall. In this experiment the flux is one liter of fluid per day. The different types of limestone are submitted to acidic water (water with 0.035µl sulfuric acid (35%)). Thus acidic water is chosen to accelerate the phenomenon of dissolution. This acid is used in order to increase the rate of chemical rock degradation, it is selected to enhance the degradation kinetics of the rock, and also to reproduce the percolation of rainwater in soil and that loads in humic acid to becomes more acidic than rainwater. This kind of water causes damages to the rocks through discontinuities. Water used for the two experiments has the same pH.
2.1 Alteration in quasi-static regime
2.1.1 Experimental procedure
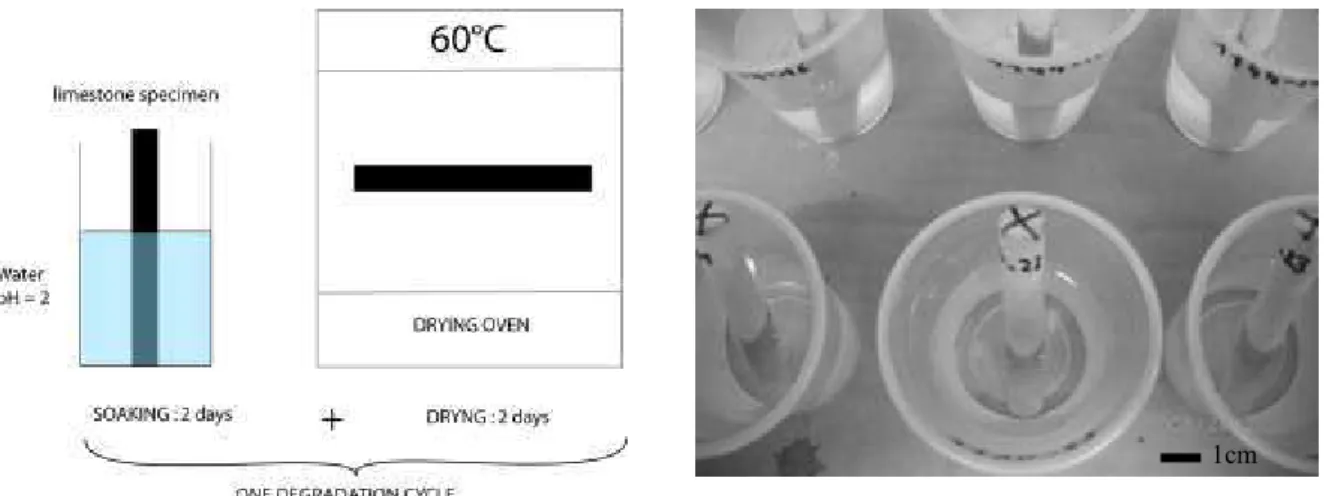
This first experiment consists in leaving limestone’s samples at rest in a fixed volume of acidic water (Figure 1). The evolution of weight of each samples during cycles of alteration are measured at different times. A cycle is composed of two steps. During the first step all samples are soaked 2 days in a sulfuric acid solution
at pH 2 then during the second step samples are dried at 60°C for 2 days (Figure 1). The acidic solution is renewed. Thanks to that change, the alteration is more effective by repetitions of these cycles, in fine, the samples degradation is increased.
The rock samples are cylindrical (diameter: 12 mm, high 100 mm) (Figure 1). A number of 24 sticks samples are used for each type of limestone. We used four types of limestone: Pierre de Caen (Caen Stone), Pierre de Lens (Lens Stone), Larrys and Comblanchien whose differ by their porosity. Limestones’ porosity extend to a range from one to several tens percent. Caen Stone and Lens Stone have a high porosity respectively 20% and 17%, whereas the two others have a low one respectively 7% and 1%.
Figure 1: Schematic representation of the two steps of the experiment “alteration in quasi- static regime” which is composed of one cycle of weathering (left). Picture of the first phase of the experiment quasi-static regime limestone samples sticks are soaking in the acidic water (right).
After each cycle of degradation the weight sample is measured in order to follow the evolution during the experiment. A picture of each sample is also taken in order to analyze qualitatively the limestone’s aspect between each cycle. This first step of analysis is extended to a smaller scale. During a second step (more quantitative), we performed measures by mercury porosimetry intrusion (MIP) in order to follow the evolution of the porous matrix. The analysis is performed at micro-scale within an environmental scanning electron microscope (ESEM).
2.1.2 Analysis
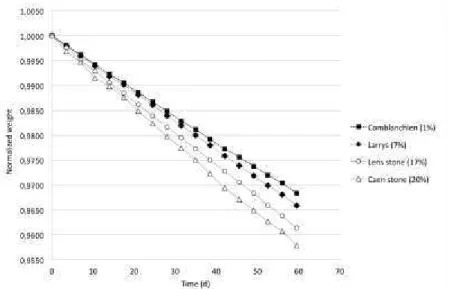
The evolution of each sample weight is measured during the dissolution process. A decrease of weight is measured for each type of limestone. Figure 2 represents normalized weight (weight (t)/weight (0)) versus time of degradation. We noticed linearity with time of the loss of weight for all the type of limestone (Figure 2). This indicates there is a constant rate of dissolution for limestone. In this figure below, we can observe that whatever the giving porosity the rate of decreasing weight is quite constant. However we can observe the higher the porosity, the higher the rate. This difference of rate means that the dissolution process also affects the pores of the matrix although the pore pressure is very small. Moreover the dissolution process has a higher influence on the more porous sample (Caen stone).
Figure 2: Evolution of sample weight during the experiment Alteration in static regime.
We observed on the sample with high porosity (Lens stone and Caen Stone) the fluid at a very small pressure rise into them whereas the fluid does not for the low porosity sample. The visual trailing shows a brownish aspect of the sample mainly for all samples but with an exception for Lens stone which conserve its whiteness. The change of color is due to the presence of impurities specially remobilization of iron often turns the sulfuric acid a yellowish brown color.
At the fluid-air interface recognized by the different of coloring, a recession of the surface is observed for each sample of each limestone (Figure 3, Figure 4). This recession suggests a loss of material. The high degradation in this part of the sample is also attributed to the influence of the CO2 in ambient air. Actually,
CO2 is considered as an important acidifying component of water. The interface is the place where the
exchange between ambient air and the water near the surface is the most important, makes it a zone where degradation is improved.
(Zoom)
Figure 3: Pictures of Caen Stone samples: Initial state (E0), after 10 days (E3), 20 days (E6), 30 days (E9), 40 days (E12), 50 days (E15) and 60 days (E17).
We observe the same high degradation near the interface, for all types of limestone. This information suggests an influence of CO2 whatever the porosity.
Figure 4: Pictures of Larrys samples during alteration: Initial state (E0), after 10 days (E3), 20 days (E6), 30 days (E9), 40 days (E12), 50 days (E15) and 60 days (E17).
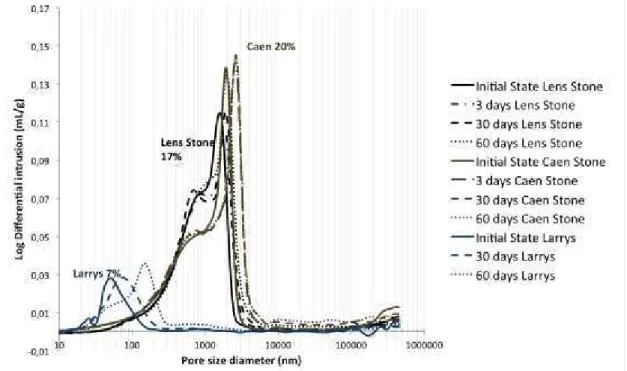
In order to evaluate the different states of alteration of the porous matrix evolution inside the sample, mercury intrusion porosimetry (MIP) measures have been done. This method is commonly used to evaluate the total porosity and the pore size distribution of different materials. MIP results are expressed as the total mercury volume intruded (log diffential intrusion) in a sample versus pore size (mean diameter pore). Measures were carried out after several cycles of degradation. The Figure 5 shows the volume of mercury intrusion versus the pore diameter. We represent on the graph three of the four limestone used for the study (Larrys (7%) Lens Stone (17%) and Caen Stone (20%)). First of all we can observe the mean pore diameter increases with the limestone’s porosity. Then for each type of limestone there is an increase of the mean pore diameter between the initial state and 3 days of alteration. The alteration increase pore volume. Low porosity sample have little mean pore diameter whereas high porosity have their mean diameter higher. Matrix of Lens Stone and Caen Stone samples are modified after the first cycle. Indeed an aperture of the mean diameter pore is measured after the first cycle but the mean diameter doesn’t increase for the other cycles. Nevertheless on Lens Stone, the volume of mercury increases between 30 days and 60 days of alteration. This reveals an increase of pores with same size. Larrys’ samples show an increase of the mean diameter pore all along the state of degradation (Figure 5).
Figure 5: Volume of mercury intrusion versus pore size diameter for samples of Lens Stone, Caen Stone and Larrys and for several state of weathering
We observe sample of limestone named Lens Stone at micro-scale with an environmental scanning electron microscope (ESEM) (Figure 6). These three pictures show three states of limestone degradation's at different time, the first represents non-altered sample, the second at 10 days of alteration and the last one after 60 days of alteration. The limestone observed is Lens Stone, it is composed of ooids which are spherical grains composed of concentric layers. We observe along the period of alteration a digging around the ooids, which indicates dissolution of calcite. This kind of feature shows the non-homogeneous fact of dissolution either at space scale.
Figure 6: ESEM pictures from sample of Lens Stone at initial state (left) after 10 days (middle) and after 60 days (right). The dash line circles emphasize the gap between oolites; this gap was
created during the alteration.
2.2 Shear strength analysis
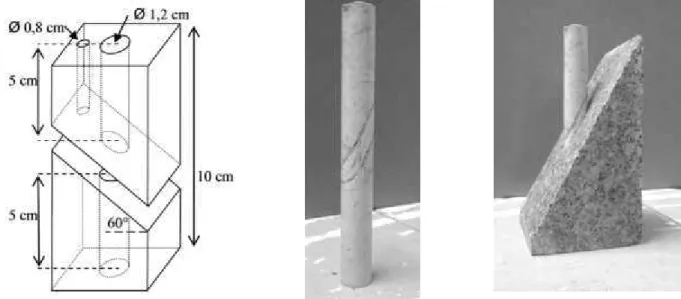
In order to the observation and measurement of chemical degradation an evaluation of the mechanical response of the sample submitted to a shear loading is performed. The measurements are made with a uniaxial cell in order to evaluate the influence of alteration on the mechanical properties of limestone samples. We used cylindrical samples (Figure 7) as samples in the alteration in quasi-static experiment. Each sample is positioned in a shaped granite base (Figure 7) and put in the uniaxial cell (Figure 8).
Figure 7: Shape of the granite base with dimension (left) the sample of limestone (middle) are inserted into the granite for the test (right) (after Druon)
The loading (kinematically controlled) applied for the shear on the weathered sample is measured and it is called: mechanical strength. Each sample is sheared in order to compare them in function of their porosity in one case and their weathering degree in another case.
Figure 8: Picture of the uniaxial cell used for the experiment “alteration quasi-static” (left). Sample in the granite base (middle) and the broken sample after the test (right) (after Druon).
Shear strength measurements are performed on different non-altered limestone samples on a range of porosity 2% from 35 % (Figure 9). The different curves show an increase in the shear stress versus tangential displacement until a peak is reach and then a decrease followed by an increase to a maximum and then failed. The first stress drop is associated to micro-cracks of the sample and the final stress drop is related to the failure of the sample. All limestone samples seem to have the same behavior.
We noticed the smaller the porosity the stronger slope, this implies that the slope of curves is hardening with the decreasing porosity. It suggests porosity affects the mechanical response of samples.
Figure 9: Shear stress versus tangential displacement for different limestone’s porosity (modified from Druon, 2011 [10] ).
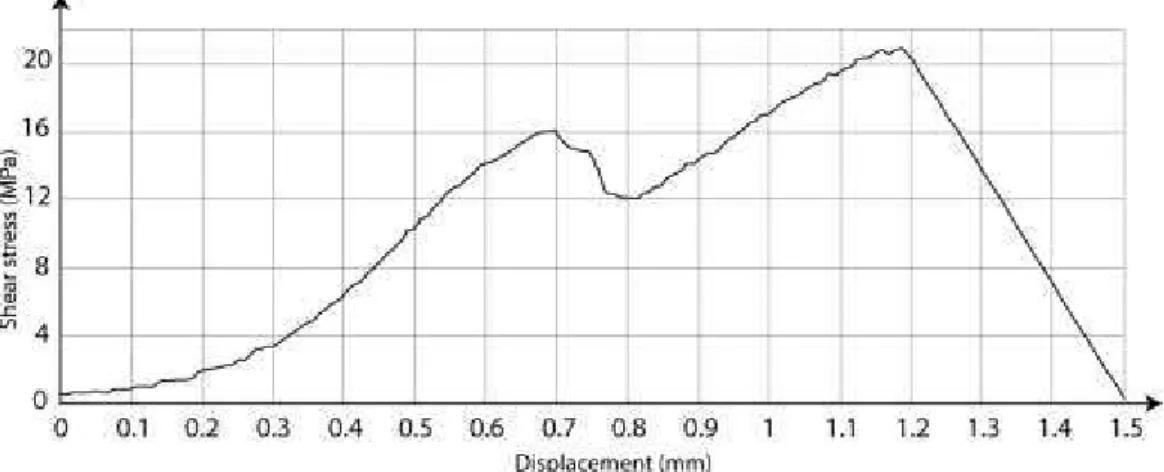
The following experiment focused on non-altered Larrys (7%) sample. The Figure 10 shows the evolution of shear stress versus tangential displacement. The curve shows an increase to a peak at 16 MPa and a decrease to 12 MPa. This first part of the curve with the little peak, indicate a first micro-crack in the limestone sample. After that the shear stress rises to a maximum at 21 MPa and after the shear stress collapse. This part of the curve represents the rupture of the sample.
Figure 10: Evolution of shear stress versus tangential displacement for the limestone Larrys (modified from Druon, 2011).
In order to show the alteration influence on limestone mechanical behavior, we performed a test also on weathered limestone. First limestone samples are undergoing a flow of acidic water (pH 2) and others with non aggressive water (pH 7) during several weeks. Two samples of weathered limestone are used for mechanical test.
The Figure 11 shows the evolution of Larrys’ samples mean failure peak during alteration period for two different pH degree of water (pH 2 and neutral water pH (7)). Which is surprising in that two curves show an increase of mean peak rupture to a maximum and a decrease. They have the same shape except the maximum for the acid water (pH 2) appears before that for rain water (pH 7). The difference between the curves points out the acceleration process of dissolution. The comparison between two different pH degrees of water shows how much the influence of pH water is relevant during the alteration process. Furthermore the slope before the peak for the pH 2 curve is stronger than the slope for pH 7.
Figure 11: Evolution of the mean failure peak after period of alteration for Larrys limestones. A comparison between different water, acid (pH 2) and neutral (pH7). Dashes (above and below) represent respectively the standard deviations max and min. The small dashes for pH2, and the
2.3 Rock bridge alteration in the case of flowing water
2.3.1 Experimental procedure
It exists [11] [12], part in the rock mass which is connected to the block ready to fall. These parts are called
rock-bridge and they constitute the block stability. In this experiment, the shape of the sample and the water
flow are different from the first one. Limestone’s blocks are sawn so as to leave a continuous part, called rock bridge. The rectangular geometry of the bridge is connected to the surface of the block. The above part is taken off. The experiment is realized in open system where CO2 of the atmosphere can influence the
interaction between the acidic solution and the surface of the block because CO2 is known to acidify water.
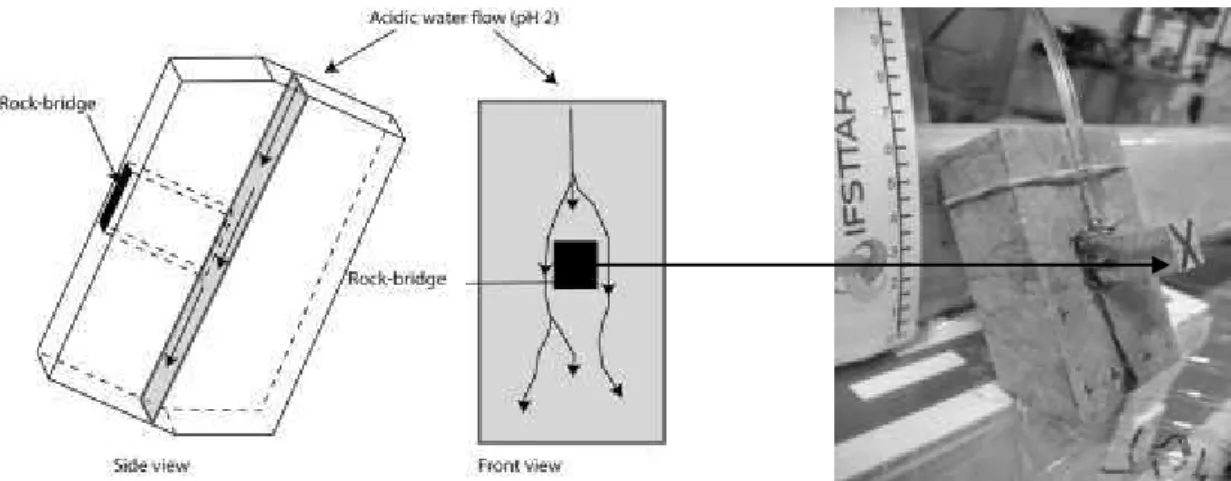
The acidic solution is stored in tins and the solution flows via a drip system. The water flow is about one liter per day (Figure 12).
Figure 12: Schemes of the shape limestone samples for the experiment Alteration in the case of “flowing water”, the acid solution is in drip system, the flow is one liter of solution per day, and run along the discontinuity and around the rock bridge (left). Picture of the runoff along the
discontinuity and around the rock-bridge (right).
Figure 13 depicts the time evolution of water pH during two different experiments. A continuous flow on the limestone surface; maintains pH stability around 2 whereas limestone’s sample immersion in an acidic solution buffers it at pH 7. This graph shows how time-contact between rock and solution is relevant.
Figure 13: Representation of the evolution of pH as a function of time, the dotted curve with open symbols shows the evolution in the case of an alteration in static water regime: limestones (CaCO3) are soaking in an acidic solution (H2O; H2SO4). The solid curve and filled symbols
shows the evolution in the case of an acidic solution flows along the limestone.
The experiment is performed in an open system, which means the sample in contact with ambient air. The interaction with the CO2 of the ambient air increases the phenomenon. The flow of water causes a material
observed by Kupper [13]. The picture shows also an asymmetric flow of the solution. Indeed we observed during the period of runoff that water followed different paths. It is obvious that water prefers the easier path to dissolve crystals less competent that the rest of the rock sample.
Figure 14: Picture of Montagnole limestone (CaCO3) sample surface degradation by acidic
solution (H2O; H2SO4)
2.3.2 Analysis
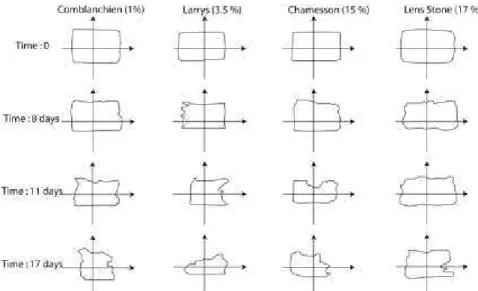
Each type of limestone received 12 liters of acid solution flowed for a period of 17 days. After 8, 11 and 17 days, a geometric analysis by laser is performed. Many profiles were done in order to show the influence of the alteration surface and to establish the decreasing of the rock bridge perimeter. This decreasing of the perimeter is observed during the water flowing for all samples (Figure 15). In addition we noticed an intact part of the rock bridge below. The recession of the rock-bridge perimeter may imply a decrease of the mechanical resistance of the rock bridge.
Figure 15: Comparison between the different states of alteration for each limestone of their rock bridges’ perimeter measured with laser.
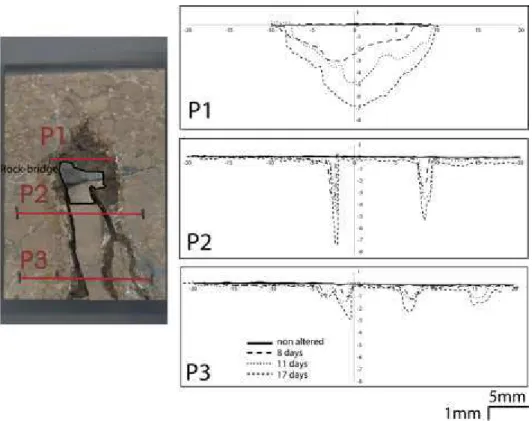
We performed other laser profiles (Figure 16). Profile P1 was taken above the bridge then profile P2 just under the bridge, and the third P3 was measured on the below far from the bridge (Figure 16). These profiles were made at initial state, after 8 days of runoff, 11 days and at final state (17 days). Profile P1 is made near the place where the drop fell. It shows a digging which increases significantly over time. Profiles under the
bridge show two diggings (P2) then three (P3). These paths followed small fractures. These ones indicates preferential path of water circulation (P2 and P3).
Figure 16: Montagnole sample after acidic water runoff, line P1, P2, P3 represent the place we take the profile by laser (left). These graphs represent the 3 profiles done by laser, the different curves show the evolution of the “topography” of the sample surface during alteration period
(right)
3 METHOD IN SITU TO IDENTIFY ROCK BRIDGE
3.1 Localization and geometry of the site
The site is located in Montagnole near Chambery (73) in France. The block is a triangle shaped dihedral with fractures and it is apparently ready to fall (Figure 17). This work aims to evaluate the potential of Ground Penetrating Radar (GPR) measurements to find and estimate the quantity of rock bridges into a block with a discontinuity.
Figure 17: View of the rock mass, it presents a dislocated area on the left, and major discontinuities are in black and superficial are in white.
3.2 Methods
GPR data were acquired using high frequency (1600 MHz) to estimate the presence of rock bridges (continuity in the rock mass). This high frequency is adapted to detect interfaces such as rock-air-rock in two meters thick. The air tends to disperse the signal, so we can deduce the rock bridge’s presence or not. In this paper, GPR measurements consisted in profiles acquired from the block (Figure 18), in order to make a grid of the block and identify the presence of rock bridges.
Figure 18: Depict of the North Face of the block in Chambery (73). The black lines reveal the different discontinuities observed. The black horizontal lines identified each radar profile, profile
3 to 9 from the bottom to the top.
3.3 Results and discussion
The first observation in situ reveals many discontinuities; the major ones represented in black on Figure 17 are those where we suppose there are rock bridges to maintain the stability of the rock mass. The white ones appear to be just on the surface but they are important for the surface degradation. The GPR reveals the possibility to identify the surface discontinuity (Figure 19). As a matter of fact radar-gram present some weirdness, these ones are the proofs of different environment as air or rock mass. These are analyzed and after a treatment, a 3D view of the discontinuity surface could be made as Figure 20 shows.
Figure 19: Radar gram acquired after profiles from the block, profile 3 to 6, the black lines represented the weirdness observed and used for the 3D representation.
Figure 20 show horizontal dots, which represented the separation between rocks and void i.e. the discontinuity inside the block.
Figure 20: 3D view of the surface discontinuity after analyze and treatment of the data.
4 CONCLUSION
These results allow us to highlight some points on the rock bridges or more generally rock behavior under dissolution caused by water flow.
The experiments in laboratory give us interesting information on the surface, as we showed for the experiment in static regime and also on the behavior of the porous matrix submitted to dissolution. Concerning the loss of weight, we noted that it is related to the available amount of oxonium ion in the solution to dissolve calcite. In this experiment the solution is saturated in 2 days whereas in the experiment in flowing regime the solution is never saturated due the dynamic flow of water.
The shear strength of different rock bridges unaltered limestone indicates that it is a link between physical characteristics of rocks. This is the value of Young's modulus, the average compressive strength and the average force measured at the rupture.
These two experiments confirmed this relevance of water in alteration process. The experiment in flowing regime is more efficient than static one. The 60 days of alteration for the first experiment in static regime showed less important damages whereas the 17 days of alteration for the flow regime, the damages are impressive.
We show alteration on the surface, but also inside the sample, which indicate relation between them. During the flowing regime experiment we observed that the reactive water use preferential path no matter what limestone used.
For instant the first results with the GPR method reveal it to be an important tool in characterization of rock bridges and also the visualization of surface discontinuity. Our results need to be correlated with other geophysics methods. The laboratory analysis will be extended to the in situ scale.
5 REFERENCES
[1] M. Zare et S. Torabi, « The effect of moisture on the stability of rock slopes », in Advances in
Transportation Geotechnics, E. Ellis, N. Thom, H.-S. Yu, A. Dawson, et G. McDowell, Éd. CRC Press,
2008, p. 355‑359.
[2] R. K. Pachauri et A. Reisinger, « Bilan 2007 des changements climatiques. Contribution des Groupes de travail I, II et III au quatrième Rapport d’évaluation du Groupe d’experts intergouvernemental sur l’évolution du climat ».
[3] J. L. Durville, « Mécanismes et modèles de comportement des grands mouvements de versants », Bulletin
of the International Association of Engineering Geology, vol. 45, no 1, p. 23‑40, avr. 1992.
[4] C. Javey, « L’altération des roches et des monuments. Etude documentaire », Bulletin du B.R.G.M, vol. Section III, no n°1, p. p. 39 66, 1972.
[5] E. L. Sjöberg et D. T. Rickard, « Calcite dissolution kinetics: Surface speciation and the origin of the variable pH dependence », Chemical Geology, vol. 42, no 1‑4, p. 119‑136, janv. 1984.
[6] J. Liu, A. Polak, D. Elsworth, et A. Grader, « Dissolution-induced preferential flow in a limestone fracture », Journal of Contaminant Hydrology, vol. 78, no 1‑2, p. 53‑70, juin 2005.
[7] W. Dreybrodt, J. Lauckner, Liu Zaihua, U. Svensson, et D. Buhmann, « The kinetics of the reaction CO2 + H20 + H + + HCO3-, as one of the rate limiting steps for the dissolution of calcite in the system H2O-CO2-CaC03 », Geochimica et Cosmochimica Acta, vol. 60, no 18, p. 3375‑3381, 1996.
[8] B. Vásárhelyi et P. Ván, « Influence of water content on the strength of rock », Engineering Geology, vol. 84, no 1‑2, p. 70‑74, mars 2006.
[9] A. Calvo-Cases, C. Boix-Fayos, et A. . Imeson, « Runoff generation, sediment movement and soil water behaviour on calcareous (limestone) slopes of some Mediterranean environments in southeast Spain »,
Geomorphology, vol. 50, no 1‑3, p. 269‑291, févr. 2003.
[10] J. Druon, « Aspect expérimentaux des effets de l’eau sur l’altération des discontinuités rocheuses », Université Paris Est Marne La Vallée, Master 2, sept. 2011.
[11] J. Kemeny, « Time-dependent drift degradation due to the progressive failure of rock bridges along discontinuities », International Journal of Rock Mechanics and Mining Sciences, vol. 42, no 1, p. 35‑46, 2005.
[12] M. Frayssines, « Contribution à l’évaluation de l’aléa éboulement rocheux (rupture) », Université Joseph-Fourier - Grenoble I, 2005.
[13] M. Kupper, « Les vitesses d’érosion du calcaire dans l’eau: études des phénomènes actuels. », Annales
de la Société Géologique de Belgique, no


![[PDF] Cours de Matlab : commandes et fonctions | Formation informatique](data:image/gif;base64,R0lGODlhAQABAIAAAP///wAAACH5BAEAAAAALAAAAAABAAEAAAICRAEAOw==)