Phonology 11(1): 1, pp. 1–41. DOI: https://doi.org/10.5334/labphon.195
JOURNAL ARTICLE
The imitation of coarticulatory timing patterns in
consonant clusters for phonotactically familiar and
unfamiliar sequences
Marianne Pouplier
1, Tomas O. Lentz
1,2, Ioana Chitoran
3and Philip Hoole
11 Institut für Phonetik und Sprachverarbeitung, Ludwig-Maximilians-Universität, Munich, DE 2 Institute for Logic, Language and Computation, Universiteit van Amsterdam, Amsterdam, NL 3 Clillac-ARP, Université Paris Diderot, Paris, FR
Corresponding author: Marianne Pouplier (pouplier@phonetik.uni-muenchen.de)
This paper investigates to what extent speakers adapt to unfamiliar consonant cluster timing patterns. We exploit naturally occurring consonant overlap differences between German and Georgian speakers’ productions to probe the constraints that language-specific patterns put on the flexibility of cluster articulation. We recorded articulography data from Georgian and German speakers imitating CCV clusters as produced by a German and Georgian audio model, respectively. The German participants adapted their relative overlap towards the Georgian audio model to various degrees depending on whether the cluster was phonotactically familiar to them or not. A higher degree of adaptation was observed for clusters phonotactically illegal in German. Phonotactically legal clusters showed only an intermediate degree of articulatory adaptation, even though acoustically these clusters showed a rather strong move towards the Georgian audio model in terms of the aerodynamics of the interconsonantal transition period. Georgian speakers on the other hand failed to adapt to the German audio model articulatorily and acoustically, possibly because the German cluster inventory is a subset of the Georgian inventory. This means that Georgian speakers can draw on native speaker knowledge for all clusters, which is a factor known to constrain imitation. Also language-specific cue weighting effects may partly condition the results.
Keywords: coarticulation; imitation; clusters; L2; articulatory timing; German; Georgian
1. Introduction
Speakers are able to modulate the phonetic detail of their own speech in order to resemble the speech that they just heard (Goldinger, 1998). Numerous studies have demonstrated this adaptive ability for a range of phonetic parameters such as vowel formants, duration, VOT, as well as tonal alignment (Delvaux & Soquet, 2007; D’Imperio, Cavone, & Petrone, 2014; Nielsen, 2011; Sancier & Fowler, 1997; Shockley, Sabadini, & Fowler, 2004); at the same time adaptation is constrained by social (Babel, 2012), but also by lexical and phonological factors. For instance, a study by Nielsen (2008) indicated that the scope of adaptation interacts with and is limited by the inventory of contrasts specific to the language involved: Voice onset time in an imitation experiment was only free to vary in the direction not relevant for phonological contrast. Relatedly, Whalen, Best, and Irwin (1997) found that speakers could imitate an inappropriate ([un]aspirated stop) allophone only in non-words, not in words. Therefore, speakers’ imitation of each other seems to be mediated by their knowledge of their native language and the lexicon. Grammar has a stabilizing function in that phonological contrast limits the direction and amount of
adaptation. The flexible adaptation in speech production is at the same time essential for the dynamic evolution of speech, since it is this basic skill that also enables learning of new sounds, phonotactic sequences, and other languages and it is also an essential ingredient in the evolution of sound change (e.g., Harrington, Kleber, Reubold, Schiel, & Stevens, 2018; Zellou, Dahan, & Embick, 2017).
In our current study, we focus on the learnability and flexibility of coarticulatory timing patterns (patterns of temporal overlap) between successive consonants. While consonant timing is usually not considered to be a locus of category contrast, it is well known that languages generally have different constraints on how successive articulatory gestures of consonants or consonants and vowels overlap in time (Bombien & Hoole, 2013; Hermes Mücke, & Auris, 2017). We refer to this overlap as coarticulatory timing (for an overview of coarticulatory patterns arising from the temporal overlap see e.g., Farnetani & Recasens, 2010). Coarticulatory timing is part of native speaker knowledge and can be seen as part of a language-specific grammar of coarticulation. While quite a number of publications are concerned with phonotactic learning in perception and production (among many others, Davidson, 2006; Goldrick & Larson, 2008; Redford, 2008; Seidl, Onishi, & Cristia, 2013), less is known about how flexibly adult speakers can adapt the phonetic detail of consonant sequences to unfamiliar coarticulatory timing patterns, and it is this question that our study addresses.
The sequencing of consonants (and of consonants and vowels) is language-specific at two levels. First, the phonology of a language restricts which phonemes can follow each other. Such phonotactic restrictions are psychologically real as language users show knowledge of them (Moreton, 2002; Polivanov, 1931; Scholes, 1966) and use them in speech processing (Lentz & Kager, 2015; Massaro & Cohen, 1983; McQueen, 1998; Vitevitch, Luce, Charles-Luce, & Kemmerer, 1997; Weber & Cutler, 2006); they also shape L2 learning (e.g., Hallé & Best, 2007; Hallé, Segui, Frauenfelder, & Meunier, 1998). Second, the same linear sequence of segments differs between languages in how it is produced, among others, in terms of its coarticulatory timing pattern (Pouplier, 2012; Yanagawa, 2006; Zsiga, 2003). That languages contrast in the degree of coarticulation has been recognized at least since the foundational work of Öhman (1966), and the relevance of this fact for second language learning on the one hand and sound change on the other has been discussed for instance in Flege (1988) or Carignan (2018). Language-specific effects in coarticulation have been found in both vowel-to-vowel (Beddor, Harnsberger, & Lindemann, 2002; Ma, Perrier, & Dang, 2015; Manuel, 1990; Mok, 2010, 2012; Smith, 1995), consonant-vowel (Boyce, 1990; Clumeck, 1976; Lubker & Gay, 1982; Solé, 1995; Steinlen, 2005), as well as consonant-consonant coarticulation (Bombien & Hoole, 2013; Hermes et al., 2017; Kochetov, Pouplier, & Son, 2007; Yanagawa, 2006; Zsiga, 2003). Because the temporal orchestration of successive segments is language specific, coarticulatory timing has to be learned and is part and parcel of native speaker knowledge and a language’s phonotactics (Davidson, 2006; Gafos, 2002).
The particular coarticulatory timing differences that are at the focus of this paper relate to the amount of temporal overlap between successive consonants forming an onset cluster, a known locus of cross-linguistic differences: For instance, the two consonants of an onset cluster overlap more in German compared to French (Bombien & Hoole, 2013). In languages such as Spanish (Hall, 2006), Norwegian (Endresen, 1991), Russian (Zsiga, 2003), or Georgian (Chitoran, 1998; Chitoran, Goldstein, & Byrd, 2002), consonant sequences may be produced with a so-called open transition. Such an open transition arises if the constriction for the second consonant is still being formed while the constriction for the first consonant has already been released (Catford, 1985). An open transition can be defined as a period of sound radiation from an open vocal tract between two constrictions (see e.g., Figure 10b).
This may under certain circumstances, depending on glottal aperture and aerodynamic conditions, lead to the emergence of an excrescent vocoid. It is generally understood that the acoustics of the transition are purely contextually conditioned but separating transitional vocoids from epenthetic vowels with a vocalic constriction target is notoriously difficult (e.g., Davidson, 2005; Ridouane, 2008). The work we report here does not crucially depend on such a distinction, and we return to this point in the Discussion.
In our current study, we exploit crosslinguistic differences in the temporal orchestration of consonant sequences in order to further our understanding of how flexible language-specific coarticulatory timing patterns are in an imitation task for both known and unknown consonant clusters. While previous studies have investigated how L1 speakers of a language prohibiting complex onsets produce these unfamiliar structures in L2 (e.g., Wilson, Davidson, & Martin, 2014), or how native knowledge of cluster production extends to phonotactically unknown consonant clusters in L2 (e.g., Davidson, 2005; Davidson, Martin, & Wilson, 2015), there is comparatively little work on the plasticity of coarticulatory timing patterns for segmentally identical sequences. Our current study compares the possible adaptation of such timing patterns between phonotactically known and unknown sequences. The study aims to contribute to our knowledge of how coarticulatory timing patterns are acquired and how they may flexibly adapt to unfamiliar patterns through imitation. This in turn will be relevant for our understanding of the nature of possible phonetic biases in coarticulatory timing patterns, and possible sources of stability and change in consonant clusters.
There is very little previous work on the imitation of coarticulatory timing patterns specifically. Much relevant previous work on learning of timing patterns has been done in the context of L2 research. Thereby one extensively studied area is VOT (for an overview see Zampini, 2008), which arises in part from different oral-laryngeal coarticulatory timing patterns in interaction with aerodynamics (Hirose & Gay, 1972). The case of VOT is somewhat different from the coarticulatory timing differences in consonant cluster production under investigation here, in the sense that VOT is one of the key cues to segmental contrast, whereas consonant cluster timing is not usually involved in contrast and category formation in the same way (although of course Catford, 1985, argued for such a view). Studies investigating the flexibility of L1 VOT patterns in L2 production found that speakers’ L2 productions are often characterized by an intermediate VOT pattern between their native L1 and a given L2 (e.g., Flege & Hillenbrand, 1984; Flege, Munro, & MacKay, 1995; Sancier & Fowler, 1997) which suggests first that native coarticulatory timing patterns can in principle change towards non-native timing patterns, and secondly, that this change towards L2 may be partial—timing patterns of L1 may persist into L2 for many years (Flege, 1987). Relatedly, Solé (1997) specifically called attention to articulatory timing differences between Catalan and English, showing how native coordination patterns which have the status of primitives for native speakers may shape L2 pronunciation in terms of voicing, vowel nasalization, and assimilation patterns. Overall these L2 studies thus point to the fundamental flexibility of coarticulatory timing
in adults while at the same time revealing limits of this flexibility.1
1 There has been a surge of studies on vowel nasalization over the last decade, particularly with a focus on
inter-speaker differences in the production and perception of vowel-nasal coarticulation in the context of sound change (Beddor, 2009; Beddor et al., 2002; Harrington et al., 2018; Zellou et al., 2017; Zellou & Tamminga, 2014), yet the focus of these studies is different from ours. These studies were able to show that the perception of phonetic detail is idiosyncratic and depends on experience: That is, listeners may not agree on how much coarticulation to attribute to the source that gives rise to it. Given the propensity for interlocutors to imitate each other’s fine phonetic detail (Babel, McGuire, Walters, & Nicholls, 2014) sound change may be due to listeners’ variable parsing of coarticulatory cues from the signal leading to variability in imitation of each other’s production patterns (Beddor, Coetzee, Styler, McGowan, & Boland, 2018).
One of the few studies specifically addressing the question of coarticulatory flexibility in the context of L2 was presented by Steinlen (2005) in a comparative study of consonant-vowel coarticulation in Danish, British English, and German. Based on acoustic recordings she first confirmed differences in the degree of CV coarticulation between these languages. In particular Danish vowels showed hardly any spectral effects of consonantal context, while English and German vowels were affected by context to a similar degree. Despite the virtual absence of coarticulatory effects of consonants on vowels in Danish, Steinlen’s Danish participants produced a high degree of CV coarticulation in L2 English, but only in some consonantal contexts, not in others. German speakers did not adapt their CV coarticulation in L2 English. Steinlen concluded that while L2 speakers transfer language-specific aspects of coarticulation from L1 to L2, there was also some evidence for the learnability of the L2 pattern in her study (the Danish speakers adopting some of the English coarticulatory patterns).
Davidson (2005, 2006) pioneered the use of articulatory measures to probe coarticulatory timing patterns in unfamiliar consonant cluster production. Her work revealed that production inaccuracy for unknown phonotactic sequences is at least partially rooted in insufficient temporal overlap: English native speakers articulated the component consonants of unfamiliar clusters at least some of the time temporally so far apart from each other that a vocoid emerged between the consonants. She suggested that what may look like vowel epenthesis may in fact be the acoustic result of an open transition between two consonants, arising from what she called ‘gestural mistiming.’ English speakers thus produced phonotactically illegal sequences with a timing pattern different from the native English pattern, since English onset cluster productions are not typically characterized by an open transition. While speakers did not retain their native timing pattern, they neither adopted the pattern they heard for the foreign CC sequences, since the CC sequences were produced without a vocoid (and in fact contrasted with CəCV in the same experiment). Davidson argued that gestural mistiming arises not just from a lack of motor skill, but rather that, for English, phonotactic constraints comprise a prohibition on close coordination patterns for phonotactically illegal sequences. That is, for English L1 speakers, a high overlap pattern is part and parcel of phonological phonotactic legality: If abstract gestural coordination is viewed as part of phonological representations in the vein of Gafos (2002), phonotactic illegality extends to a prohibition of producing illegal sequences with the native gestural coordination pattern. Our research extends this work by comparing the imitation of phonotactically illegal clusters with the imitation of known clusters with an unfamiliar coarticulatory timing pattern which may include an open transition. If known clusters are imitated within one’s native language with a different timing pattern, this would provide evidence for the possibility of open transitions arising as part of faithful imitation.
In terms of the characteristics of non-native production patterns, two major factors are discussed in the literature. For one, it could be shown that the specific type of response produced for auditorily presented phonotactically illegal sequences will vary as a function of fine phonetic detail of the stimuli (Wilson & Davidson, 2013; Wilson et al., 2014). For instance, Wilson and Davidson (2013) systematically manipulated the phonetic detail of their stimuli and confirmed that increased burst intensity conditioned higher rates of epenthesis in illegal CCV sequences. Lower amplitude bursts also predicted a higher rate of C1 deletion or misidentification (see also Daland, Oh, & Davidson, 2018 for phonetic factors in loanword adaptation).
Secondly, to study speakers’ performance with unfamiliar sound patterns is a well-known approach to assessing universal knowledge and constraints which presumably emerge in
situations in which learned behavior is not available without transfer (Berent, Lennertz, Jun, Moreno, & Smolensky, 2008; Wiese, Orzechowska, Alday, & Ulbrich, 2017). The observation that not all patterns observed in L2 are explainable on the basis of transfer serves as a main argument for the role of markedness in L2 learning. For one, there may be asymmetries in transfer, such as observed among others by Zsiga (2003), a study we will review in detail below. Asymmetries in transfer may arise if a given L2 has a universally less marked pattern compared to a given L1. In this case the L2 pattern will be learned relatively easily, but not vice versa (e.g., Eckman, 2008). If it is L1 that has an unmarked structure, transfer of the unmarked pattern to L2 is likely (Cebrian, 2000). Likewise, it has been argued that even in the total absence of a particular structure in L1 (such as consonant clusters), universally unmarked structures are acquired more readily than marked structures (e.g., Berent, Steriade, Lennertz, & Vaknin, 2007; Broselow, Chen, & Wang, 1998).
Naturally occurring overlap differences between phonotactically identical CC sequences, as we employ in our study, have only very limitedly been exploited before, either in L2 or in imitation studies. Zsiga (2003) is to our knowledge one of the first studies in this area, specifically investigating the L1 to L2 transfer of coarticulatory timing patterns in interaction with markedness constraints. She analyzed acoustic recordings of stop-stop consonant sequences across word boundaries contrasting English and Russian. Zsiga specifically tested whether consonant timing in these sequences (e.g, English stop tarts) would be characterized by a transfer of the L1 pattern or by the emergence of an unmarked pattern in which speakers would be expected to maximize perceptual recoverability by pronouncing each word as a separate unit (‘word integrity effect,’ see also Cebrian, 2000). In English, there is often substantial overlap in stop-stop sequences and C1 in C1#C2
sequences is mostly unreleased.2 This contrasts with an obligatory release of word-final
stops in Russian, indicative of a lesser degree of overlap across word boundaries (Kochetov et al., 2007; Kochetov & So, 2007; Zsiga, 2000).
Zsiga found that Russians continued to release the first consonant even in L2 English, keeping their native pattern in L2. English speakers, on the other hand, adopted the Russian pattern, but did not differentiate between cluster types as Russian L1 does. Zsiga interpreted the across-the-board low overlap pattern for English speakers within a perceptual optimization approach: Speakers optimize cue recoverability in L2 on a word-by-word basis (Weinberger, 1994). According to Zsiga, English natively sacrificies perceptual recoverability of final consonants in stop-stop sequences (though see Gow, 2002) in favor of cueing prosodic phrasing, whereas Russian ranks the requirement to release C1 higher. Since recoverability principles seem to dominate non-native language production, for Russians the native and unmarked non-native pattern coincide, but English speakers will adopt a pattern similar to L1 Russian in an instance of the emergence of the unmarked.
English speakers’ behavior could be interpreted as emergence of the unmarked (rather than just adoption of the Russian pattern) because English speakers failed to implement cluster-specific timing differences which are, according to Zsiga, characteristic of Russian but not English. Zsiga thus found effects of both transfer of an L1 pattern and the emergence of the unmarked. Yet Yanagawa (2006) who systematically compared consonant-consonant timing for consonant sequences in various positions for four languages could not replicate Zsiga’s results: In an articulography study, she compared L1 Cantonese, Japanese, and 2 Davidson (2011) reports that 25% of stops followed by a consonant are released in spontaneous speech; see
German speakers but found that language-specific differences in CC timing failed to predict L2 English production. All speakers adopted a pattern quite close to that produced by control English native speakers. She thus could not replicate for her languages the results Zsiga (2003) had obtained for Russian and English. Since Zsiga (2003) assessed articulatory overlap indirectly from acoustic measures, possibly more subtle effects may have been missed, especially for stop-stop sequences. For our current imitation study we recorded articulatory data for two speaker groups with different coarticulatory timing patterns, and thus will be able to observe fine-grained effects of articulatory adaptation.
In our current study, we capitalize on the coarticulatory timing differences between Georgian and German as they have been reported in the literature. Georgian has been described as having a low degree of overlap between consonants (Chitoran et al., 2002), while German has been described as having a high degree of overlap in consonant clusters (Bombien & Hoole, 2013; Pouplier, 2012). The goal of our current study is thereby to shed light on the adaptive flexibility of coarticulatory timing patterns for known and unknown clusters, and on whether this flexibility depends on the specific coarticulatory timing pattern of a given language. This allows us, in turn, to gain further insights into possible phonetic biases in coarticulatory timing patterns. The particular focus is thereby on the German speakers for whom we contrast clusters which exist phonotactically in both languages—but with different coarticulatory timing patterns—with those that exist in Georgian only. If German speakers imitate, within a German speaking context, a Georgian-like low overlap pattern for known clusters, this would provide evidence that low overlap patterns may arise as part of a controlled imitation of an unfamiliar pattern within one’s native language. If, on the other hand, imitation or move to a generic low-overlap pattern occurs for unknown clusters only, this would provide evidence for native coarticulatory timing patterns being deeply entrenched for phonotactically legal clusters vis-à-vis the force of phonetic biases in unknown cluster production.
For the Georgian speakers of our experiment, on the other hand, all clusters are known. Since it has been shown that access to native language knowledge limits imitation (Nye & Fowler, 2003), we could expect less imitation. The same prediction of a lesser degree of imitation by the Georgians could be gleaned from Zsiga’s L2 study on the grounds that Georgian has been reported to have a low overlap pattern (which Zsiga argues to be unmarked). Since the timing patterns of Georgian have not been extensively studied, we formulate this possible prediction with care. On the other hand, our Georgian participants were recruited in Munich and have some L2 knowledge of German which would give reason to expect a faithful imitation of German.
Before presenting our Methods, we will now briefly contrast the main characteristics of Georgian and German relevant for our study. Georgian is a Kartvelian language of the Caucasus which has an extensive cluster inventory (Butskhrikidze, 2002; Shosted & Chikovani, 2006). For stop-stop sequences, an obligatory release has been reported (Chitoran, 1998), consistent with the observation of a relatively low C-C overlap pattern. German has a more restricted cluster inventory (Wiese, 2000). In contrast to Georgian, which has no central vowels, German allows for vowel reduction in unstressed weak syllables and has the central vowels /ə, ɐ/. Thereby especially Southern German, the region from which we recruited our speakers, is characterized by schwa elision in the pretonic prefixes /bə-, gə-/ unless the stem is stop-initial, in which case the entire prefix is dropped (Rowley, 1990; Wiesinger, 1989).
The stop phonation contrast in Georgian is described phonologically as voiced, voiceless aspirated, and laryngealized. Prevoicing in Georgian is weak though and there have been suggestions to better cast the contrast in terms of unaspirated, aspirated, and laryngealized
(Butskhrikidze, 2002; Shosted & Chikovani, 2006). The German stop contrast is described as voiced/lenis versus voiceless aspirated/fortis. Fortis stops can be aspirated in all positions, except when following a sibilant in a cluster (Hoole, 2006; Kohler, 1995). Voiced stops show considerable variation depending on position, context, region, and speaker idiosyncracies and can in initial position variably be prevoiced (particularly in voiced contexts) or voiceless unaspirated (Jessen, 1998; Piroth & Janker, 2004). We infer that the phonation of phonologically voiced stops in German and Georgian may be relatively similar, although to our knowledge they have never been directly compared in this respect.
In sum, given the known global differences in coarticulatory timing between German and Georgian, and given that listeners are very sensitive to coarticulatory variability, we explore to what extent native coarticulatory timing patterns are flexibly adapted in a task designed to elicit the imitation of non-native timing patterns, and whether there is evidence for low overlap patterns arising independently of functional pressures. While previous research on English leads us to expect that coarticulatory timing patterns will be stable for known clusters but move to a generic low overlap pattern for unknown clusters, Zsiga’s results obtained for Russian in the context of L2 research point to the possibility that also in an imitation task the degree of adaptation might not be equal across languages. While we recorded German as well as Georgian speakers imitating each other’s CC coarticulatory timing patterns, the emphasis of our study is on the German speakers since it is only for this speaker group that we can contrast known and unknown sequences and that we have a relatively clear picture of native coarticulatory timing patterns. In addition, our Georgian participants already had some exposure to German.
Methodologically, we investigate CC coarticulatory timing patterns by relating specific articulatory ‘landmarks’ to each other, a method which has been used in previous research to quantify overlap patterns in consonant sequences. These will be described in detail below. Although these measures can be used as a convenient tool to differentiate coarticulatory timing patterns, it is possible that participants zoom in on other aspects of non-native productions when imitating them. To determine if participants imitate the non-native coarticulatory timing patterns they hear in any way, we additionally employ a greedy machine learning approach to separate Georgian and German speakers’ timing patterns on whichever aspect they differ. Such a global separation then allows us to see whether there is imitation in other dimensions than those quantified by our measures. In addition, we also, for a subset of our stimuli, ask to which extent the acoustic phonation profile of the transition between consonants is imitated.
2. Methods
The recordings of two audio models served as stimuli for the main experiment. For the main experiment, we had two groups of speakers, one group of German native speakers and one group of Georgian native speakers. The technical recording setup was identical for all parts.
2.1. Audio model recordings and stimulus preparation
One female native speaker of German, aged 25, and one female native speaker of Georgian, aged 26, served as audio models. The German audio model was a member of the Institute of Phonetics in Munich but naive as to the questions of the experiment. The Georgian audio model was selected on the basis of her being the first Georgian native speaker to respond to our search for participants and realizing a coarticulatory timing pattern
different from the German speaker in the direction expected given the existing literature.
She was a fluent L2 speaker of German.3
The audio models were asked to read, in their native language, CCa non-words in a neutral carrier sentence displayed on a computer screen. All CC combinations were phonotactically legal in the native language of the respective audio model. The German phrase was /ɪç høːʁə CCaː bɛsɐ ap/, Ich höre CCa besser ab, meaning ‘I’d better check CCa by listening,’ and /sitʼqʼva CCa pʰuʧʼia/, for Georgian, meaning ‘The word CCa is useless.’
For all participants, audio models and others, we recorded articulography data (EMA) with synchronous audio recording (details below). From the audio models’ data the CCV syllables were excised from the carrier sentence. For each cluster and each audio model, the last of two (Georgian) or three (German) repetitions was selected, unless the last repetition was erroneous or noisy, in which case the penultimate was used. This token selection was performed in this way in order to maximize familiarity with the stimulus material and the recording situation. The speakers were also familiarized with the recording material prior to the beginning of the recording session. For the German audio model recordings, the vowel of all tokens was reduced by 30 ms to remove coarticulation with the following labial of the carrier phrase which induced a /CCVb/ percept in the excised syllables. For the Georgian stimuli this was not necessary since no labial coda percept was induced by the carrier phrase, as confirmed by informal pilot testing. All stop-initial clusters were cut at the beginning of the burst. All recordings were intensity equalized using Praat (Boersma & Weenink, 2018).
2.2. Main experiment: Participants
For the main experiment, eight native speakers of German without knowledge of Georgian and living in the Munich area participated in the German-native version of our experiment. An additional two German participants were tested but had to be excluded, one for technical recording reasons and one for failure to complete the task as intended. The German participants had spent most of their lives in Germany and reported L2 knowledge in various Germanic and Western-Romance languages (one of them also spoke L2 Japanese). The two speaker groups had the same median age of 26 with a range of 22–30 for the German and 20–30 for the Georgian group. For the Georgians, data from 10 native speakers are available for analysis; data from an eleventh participant had to be excluded for technical reasons. All participants resided in Munich at the time of the recording and they all had some level of L2 knowledge of German. They had lived in Germany between 4 months and 7 years at the time of recording with the average being 3.3 years (SD 2.4; median 3.5). The level of L2 knowledge of German was not controlled for due to the constraints on finding Georgian native speakers in Munich. Four of the participants had studied German in school, one had studied German at university level, one participant had studied German for 5 years, another for 12 years. Two others had been studying German for only 4 months; one of them had virtually no knowledge of German. Some participants were thus very fluent in German; others had only very basic knowledge. They all reported speaking Russian (two were Georgian Russian bilinguals); most of them also had L2 knowledge of English. All consent forms were translated into Georgian.
3 We use the term audio model since these speakers’ recordings served as stimuli for the imitation task. We
thereby make no claims about where these speakers fall within the general statistical distributional proper-ties of the overall population of German or Georgian native speakers. Crucially, what is primarily important for our experiment is that these audio model speakers realize a coarticulatory timing pattern different from each other and their timing patterns are on a macroscopic level consistent with the existing literature on coarticulatory consonant sequence timing in these languages.
2.3. Main experiment: Experimental protocol
The participants’ task was to imitate as part of a constant carrier phrase the audio stimulus they heard at the beginning of each trial. The carrier phrase was in a given participant’s native language. Each audio stimulus was presented twice with 500 ms silence between the two repetitions. This was done in an effort to minimize the danger of categorical misperception of the stimuli, which were presented in isolation.
The experiment consisted of a baseline native condition and a non-native test condition which were presented in two blocks. The native condition was always recorded first and consisted of the clusters phonotactically legal in the respective native language of the participants, with the audio stimuli being from the audio model sharing the given participant’s native language. Thus German participants heard the German audio model, Georgian participants heard the Georgian audio model. In the non-native condition, the audio stimuli of the ‘other’ audio model were used, i.e., German participants were presented with the audio recordings of the Georgian audio model and Georgians listened to the German audio model’s productions.
Note that for the Georgians, all clusters were phonotactically legal in both conditions, only the audio model differed between the native and non-native conditions. This is because the German #CCV cluster inventory is a subset of the Georgian inventory. For the German speakers, the non-native condition comprised all the clusters of the native condition (heard with the coarticulatory timing pattern of the Georgian audio model) plus the additional clusters which exist in Georgian only (see below). For the native conditions, three repetitions were recorded per cluster in differently randomized blocks; for the non-native conditions, there were eight repetitions. Experiment time, i.e., number of repetitions, was divided unequally between the two conditions for the following reason: Whereas the native condition merely served as a baseline, for the non-native condition, we were interested in the possibility of practice or learning effects over the course of the experiment and thus biased the repetition number in favor of this condition. Since no such effects were found for our measures, we do not report on this aspect any further.
Overall we expected that the Georgian audio model’s productions should show a lower degree of C-C overlap compared to the German audio model’s productions for the lag measures employed (see below). It turned out that the German and Georgian audio models’ productions, while generally distinct, overlapped due to three clusters: /sp, ʃm, dg/, for which the Georgian audio model produced a higher degree of temporal overlap compared to the German audio model on at least one of our measures (we return to this observation in the Discussion). This was evaluated on a by-cluster basis for /sp/ and /ʃm/; for /dg/, which does not exist in German, the production was compared to the mean of the German audio model’s productions. We excluded these three clusters altogether.
A total of seven clusters that occur in both German and Georgian and an additional fourteen that occur in Georgian but not in German were included in the analysis. Clusters existing in both languages were /ʃp, sm, bl, gl, gn, kl, kn/; clusters existing in Georgian only were /bg, bn, gb, gd, lb, lm, md, mg, ml, mn, mt, nb, ng, tm/.
The targeted data set thus contains 7 clusters × 3 repetitions × 8 speakers = 168 tokens for the German native condition. The German non-native condition comprises 21 clusters × 8 repetitions × 8 speakers = 1344 tokens. For the Georgian native condition, the data set contains 21 clusters × 3 repetitions × 10 speakers = 630 tokens; for the non-native condition 7 clusters × 8 repetitions × 10 speakers = 560 tokens, rendering a targeted grand total of 2702 tokens across both languages and conditions.
Participants were instructed that they would hear syllables from a model speaker and their task was to repeat these syllables after the audio model, embedded in a sentence,
to the best of their abilities. All participants were advised that the syllables of the first part of the experiment would sound quite familiar to them, whereas in the second part the syllables were from a different language and might sound unfamiliar. In any case they should still repeat back what they heard from the audio model as closely as possible. They were not explicitly informed about the specific languages the syllables were from in order to keep their attention focused on the phonetic detail of the stimuli; participants from both groups reported informally after the experiment that they recognized the stimuli of the first part as being from their respective native language.
The carrier phrase was displayed on the screen for each trial with a blank for the target syllable. The carrier phrase was for all conditions in the given participant’s native language. The German carrier phrase was the same as for the audio model: /ɪç høːʁə CCaː bɛsɐ apʰ/, Ich höre CCa besser ab, meaning ‘I’d better check CCa by listening.’ The Georgian carrier phrase was for technical reasons slightly different from the one used for the audio model: /veeba CCa pʰuʧʼia/, meaning ‘A large CCa is useless.’
2.4. Recording procedure
We used the Carstens AG501 articulograph to record articulatory movement data for both of the audio models and the participants. We used standard calibration and position recovery procedures for every recording session. Three receiver coils were placed on the tongue: just behind the tongue tip (TT), one on the dorsum to capture velar constrictions, and one in the mid region. One coil was placed on the lower incisors to measure jaw movement and one coil each was placed on the vermilion border of the upper and lower lips. All of these coils were placed in the midsagittal plane. Reference coils to correct for head movement were placed on the nose ridge, the maxilla, and behind each ear on the mastoid process.
After position recovery the recordings were corrected for head movement and rotated to the occlusal plane. Articulatory data were sampled at 1250 Hz. As part of position recovery, the signal of each transducer was low-pass filtered with a cut-off frequency of 20 Hz, with the exception of TT which was filtered at 60 Hz and the reference coils which were filtered at 5 Hz. The velocity signals of all time series were smoothed at 24 Hz with a moving average filter. Synchronously with the articulatory data audio recordings were acquired at a sampling rate of 25.6 kHz.
2.5. Analysis
2.5.1. Auditory Analysis
Trials in which the pronunciation differed in segmental composition from the given audio stimulus (e.g., /s/ instead of /ʃ/; /nba/ instead of /bna/) were identified based on auditory evaluation, combined with visual inspection of the oscillogram, spectrogram, and the articulatory time series data. This was performed by one of the authors (T.L.). We operationally term these tokens categorical errors. No meaningful analysis of the kinematics could be performed for these tokens and they were analyzed according to error category only. This applied to 9% of the data (246 Tokens). For the remaining tokens, articulatory gestures were annotated according to the procedures detailed in Section 2.5.2. 2.5.2. Gesture annotation and measurements
For each sensor time series of interest, the articulatory constriction formation and release were identified in Mview (kindly provided by Mark Tiede) based on the first derivative of the position signals. For each gesture, the peak velocities associated with constriction formation and release, and the velocity minimum associated with the maximal constriction were identified. A 20% threshold of the peak velocity was used to identify the time points
of movement onset, achievement of target (plateau onset), and release (plateau offset). Thresholds were adjusted in a range between +/–5% if the automatically detected gesture was clearly incorrect. Only for two tokens one of the time points, namely the onset of the first consonant gesture, could not be reliably identified and this landmark was not used. This is only relevant for the machine learning analysis (see Section 3.2.3) as the other analyses do not use this time point. Movement onset and target achievement were determined for each consonant relative to the peak velocity of the constriction formation; the release time point was computed relative to the peak velocity of the constriction release. The time point of maximal constriction was identified as velocity minimum between the two peak velocities.
To measure labial constrictions, lip aperture was computed as the Euclidean distance between the upper lip and lower lip. Coronal constrictions were segmented based on the tangential velocity profile of the tongue tip sensor; dorsal constrictions were identified based on the first derivative of the vertical movement component of the tongue dorsum
sensor.4 Segmentation of landmarks based on the velocity profile is illustrated in Figure 1.
As quantification measures of gestural overlap, we employed two articulatory measures which have both routinely been employed in previous studies investigating consonant-consonant timing (among others, Chitoran et al., 2002; Marin, 2013; Pouplier, Marin,
4 These measurement variables were selected since they capture the main constriction formation and release
motions of the different articulatory structures (see for instance also Bombien & Hoole, 2013). In particular velars are known to show a looping motion with a fronting of the tongue during occlusion (Perrier, Payan, Zandipour, & Perkell, 2003). The tangential velocity profile is sensitive to this fronting motion and thus impacts our plateau measure in a way orthogonal to our study. For coronals, a raising and fronting is often seen as part of the constriction formation itself and as such the tangential velocity profile is an appropriate basis for measuring constriction formation, target, as well as release. An aperture function was chosen for labial constrictions since both upper and lower lip contribute to labial constriction formation and release. Importantly, the measurement variables for a given constriction were constant across all conditions and speaker groups, thus any relative differences in coarticulatory timing between conditions and speaker groups cannot be due to the choice of tract-variable specific measurement dimensions.
Figure 1: Illustration of kinematic segmentation of a tongue tip constriction (here, for /l/). The top panel shows horizontal (dashed line) and vertical (solid line) position of the tongue tip sensor over time. The bottom panel displays the tangential velocity profile. Numbers indicate the time points of the following landmarks: 1) movement onset of constriction formation, 2) peak velocity of constriction formation, 3) target achievement, 4) maximum constriction, 5) release, 6) peak velocity of release. See main text for details. For display purposes, the position values have been centered to zero.
-2 0 2
cm
Tongue Tip Position and Tangential Velocity
1.04 1.12 1.2 1.28 1.36 1.44 Time (sec) 0 10 20 30 40 50 cm/sec 1 2 3 4 5 6
Hoole, & Kochetov, 2017). For one, normalized plateau lag, defined in (1), is the interval between release of C1 and target achievement of C2, normalized for the duration of the entire C1C2 target plateau (target achievement of C1, release of C2). Secondly, onset
lag, as defined in (2), quantifies the time point of C2 movement onset relative to C1’s
target achievement onset. This measure is normalized for the plateau duration of C1 and expresses the proportion to which the plateau of C1 is produced prior to the onset of C2. Negative values mean that C2 begins its movement before C1 has reached its target, as is the case in the example given in Figure 2.
Figure 2: Illustration of coarticulatory timing measures taken from the kinematic signals. Top figure /bla/ produced by the German audio model. Bottom figure: /bla/ produced by the Georgian audio model. In each figure, the four panels show, from top to bottom: audio, spectrogram, tongue tip position (horizontal: dashed line, vertical: solid line; positions centered on zero for display purposes), lip aperture. Time is on the x-axis. The boxes indicate the plateau interval (target achievement to release) for each gesture. The arrows indicate the time points of movement onset for each consonant. Absolute plateau lag is indicated by an arrow; this interval was normalized for the interval from plateau onset of C1 to the plateau offset of C2. Onset lag was defined as the onset movement of C2 (here: tongue tip) relative to the plateau onset of C1, normalized for plateau duration of C1. All landmarks were identified based on the velocity profile; see main text for details. Note the marked difference in plateau lag and onset lag between the two productions of /bl/. The Georgian production can be characterized as having an open transition due to the pronounced lag between the acoustic release of C1 and target achievement of C2. 20 25 30 35 LA -50 5 TTPOS AUDIO 1100 1200 1300 1400 1500 1600 msecs mm mm Plateau Lag 15 20 25 mm LA -5 0 5 mm TTPOS AUDIO 1300 1400 1500 1600 1700 1800 msecs Plateau Lag
(1) Plateau lag target achievement C2 release C1 release C2 target achievement C1
(2) Onset lag =movement onset C2 target achievement C1
release C1 target achievement C1
There were overall 26 tokens which could not be included in the kinematic analysis due to technical difficulties associated with position recovery. Additionally, speakers sometimes seemed to hesitate on the first consonant of the cluster, leading to overly long plateau values which severely impacts the onset lag measure. We therefore decided to remove outliers from the data set based on the interquartile range. Any token with an onset lag or normalized plateau lag value more than three times the interquartile range from the upper/lower quartile was considered an outlier and removed from analysis. The procedure identified 66 outliers. The final data set for the kinematic analyses thus comprises 2364 tokens. The machine learning analyses reported below only use clusters that occur in both languages, of which one token had to be discarded due to segmentation difficulties, as mentioned above (a German native production of /kl/).
2.5.3. Acoustic analysis
For acoustic analysis of the interconsonantal transition interval we first cut the CCV target words from the acoustic beginning of C1 to the end of the vowel for all files. All analyses were performed in Matlab. We centered the signal to zero and performed amplitude normalization on the CCV interval; this means effectively that all tokens were normalized to the amplitude of the vowel. Our choice of acoustic analysis parameters was guided by the concern that many of the transitions are fairly short; we therefore favored methods that are robust for short time windows over any methods that rely on pitch period detection.
We quantified the degree of voicing during the closure of C1 by taking the median of the absolute normalized amplitude of the signal during stop closure. Stronger voicing during closure is associated with higher signal amplitude values.
To identify transition intervals, we decided to use a combination of acoustically and articulatorily defined landmarks as given in (3), since demarcating a transition by visual inspection of the acoustic signal can be quite tricky.
(3) transition = articulatory target achievement C2 acoustic burst C1
We used the acoustic release of C1 rather than the articulatory release, since due to tissue viscosity the articulatory release systematically precedes the acoustic release and occurs at a time point at which the acoustic signal indicates that the vocal tract is still closed, even though articulator motion out of the constriction is well on its way. The acoustic release of C1 was manually identified and defined as the beginning of the burst. Note that (3) implies that a transition interval is defined for all tokens, independently of their coarticulatory timing pattern, and that the transition interval can be negative, (close to) zero, or positive (for examples see Section 3.2.4, particularly Figure 10).
Phonation profile analyses were performed on the transition interval as defined in (3), but only tokens with transitions > +10 ms were taken into account since for shorter transitions a phonation profile analysis is not meaningful. The phonation profile of each transition > +10 ms was quantified on the basis of amplitude envelope modulation and normalized zero crossing rate. For voiced speech, energy tends to be concentrated
in frequencies below 4 kHz (though dominated by f0 and F1); for voiceless parts the energy is expected in the higher frequency regions. This implies higher zero crossing rates compared to voiced parts of the signal. Zero crossing rate for a given transition was normalized for the number of samples in that transition.
The amplitude envelope was calculated using Matlab’s envelope function set to use spline interpolation over local maxima. We captured modulation of the amplitude envelope, ΔE, based on the difference between two envelope time points: the envelope amplitude at the beginning of the transition (E1) and the maximum of the envelope at least 10 ms into the transition (E2). Envelope modulation was thus defined as ΔE = E2–E1. The 10 ms threshold on the location of E2 was imposed due to some tokens—those with a very strong burst—having their envelope maximum at the beginning of the transition. Due to the threshold ΔE will be negative for such tokens. In order to avoid edge effects in the envelope amplitude values at the beginning of the transition, we averaged the envelope values of the first 2 ms to determine E1. Examples for transitions and their analysis values can be found in Section 3.2.4, particularly Figures 12, 13.
2.5.4. Statistical analyses
For statistical analyses, we used mixed linear models with the lme4 and lmerTest packages in R (Bates, Mächler, Bolker, & Walker, 2015; Kuznetsova, Brockhoff, & Christensen, 2017; R Core Team, 2018) with a Satterthwaite approximation of the degrees of freedom.
As stated above, we recorded three repetitions for the native and eight repetitions for the non-native condition with the intention to look and control for practice effects. However, there were no meaningful repetition effects in the data for any of our analyses and we thus included the factor Repetition as a nuisance variable in the statistics but will not comment on it any further.
3. Results
3.1. Audio model cluster productions
For all audio model productions which are used in the subsequent analyses of the main experiment, Figure 3 shows the onset lag and normalized plateau lag values. The larger filled symbols represent the audio model specific means across productions. As can be seen visually, the desired separation of two coarticulatory timing patterns was achieved.
Figure 3: Scatterplot of audio model productions. Capital <S> stands for /ʃ/. AM stands for audio model.
-0.1 0 0.1 0.2 0.3 0.4 0.5 0.6
Normalized plateau lag
0 0.5 1 1.5 2 2.5 3 Onset lag Sp bl gl gn kl kn sm Sp bg bl bn gb gd gl gn kl kn lb lm md mg ml mn mt nb ng sm tm German AM Georgian AM German AM mean Georgian AM mean
To quantify the distance between the audio model productions statistically, we calculated the mean across all clusters separately for the German and Georgian models. The mean normalized plateau lag and onset lag were .17 and .68 for the German audio model and .41 and 1.54 for the Georgian audio model. To test whether there is a significant difference between the two audio models, we compared the set of German audio model data to the mean of the Georgian audio model and vice versa, using a t-test. For the German data, the t-tests were significant for both normalized plateau lag (t(6) = –6.3, p < .001) and onset lag (t(6) = –13.3, p < .001). For Georgian, the t-tests were likewise significant for both normalized plateau lag (t(20) = 14.3, p < .001) and onset lag (t(20) = 6.3,
p < .001). Hence, the set of productions of each audio model differed significantly from
the coarticulatory timing pattern of the other model, in the direction that we expected given the literature.
3.2. Main experiment 3.2.1. Categorical errors
There were overall 246 categorical errors, i.e., productions in which consonants were produced in incorrect order, or with a different manner or place. The majority of errors affected both consonants, followed by errors on C1. C2 was less affected by error (both: 45%, C1 only: 42%, C2 only: 13%).
We binned the categorical errors into the following categories: addition, deletion, place error, manner error, serial order, or multiple errors (e.g., manner and place or place and
order).5 Figure 4 gives the proportional error types. Proportions were calculated relative
to the token total of each native language and condition (native, non-native). Overall, both the German and Georgian native conditions had errors on 6% of tokens, the German non-native condition on 8% of tokens, the Georgian non-native condition on as many as 16% of tokens. The higher error rates for the non-native condition agrees with other studies that have found worse phoneme-identification in non-native compared to native speech (Cutler, Weber, Smits, & Cooper, 2004).
Some of the errors, particularly those occurring in the native conditions, were presumably caused by the fact that some of the auditory stimuli contained initial stops and some
5 Note that the audio models differed in the duration of the transition as defined in Section 2.5.3 of the
Methods (see Section 3.2.4 in Results for analysis), but the nature of the transition between the consonants produced by our speakers in the main experiment was not considered in the categorical error analysis. The categorical error analysis concerns only tokens which had to be excluded from the continuous signal analyses because the intended consonants were not produced or produced in wrong serial order, making a continuous signal analysis void. Transitions are analyzed acoustically in detail in Section 3.2.4.
Figure 4: Error type proportions within each native language and condition.
German nat. Georgian nat. German non−nat. Georgian non−nat.
addition deletion manner multiple order place
Proportional error type occurrence by native language and condition
percent
0246
81
stop-stop sequences, which can be expected to be perceptually vulnerable (e.g., Miller & Nicely, 1955). This problem could not be avoided, since presenting the clusters in a /V#CCV/ context might have induced perceptual resyllabification of the phonotactically illegal clusters for the Germans. Another error that occurred frequently was that sibilant-initial clusters were often pronounced with a preceding labial, such as /pʃp/ for /ʃp/. This occurred in 51 instances, thus making up 21% of all errors across conditions. This specific error makes up for 1% of tokens in the native conditions versus 2% of tokens of the non-native conditions (across non-native languages).
Concentrating on the errors occurring in the non-native conditions, we observed for the German speakers a predominance of place errors (41), followed by initial vowel additions (24), consonant additions (8), and a small number of various other types (order: 1, manner: 1, multiple: 4). The 24 initial vowel additions occurred exclusively in the German non-native condition for the sonorant-initial clusters /md, lb, lm, nb/ which were produced as VCCV. We note that all of these were produced by a single speaker and thus must not be attributed to a general perceptual repair strategy that emerged in the experiment overall.
For the Georgian speakers, the high number of place errors stands out in the non-native condition. Of these 59 cases, 6 are due to /s/ being pronounced as /ʃ/; all the other cases are due to /gl/ being mispronounced as /bl/. The /gl/ produced by the German audio model was repeated as /bl/ or /vl/ consistently by 7 Georgian speakers and 3 German speakers. This error also accounts for the comparatively high error rate in the Georgian non-native condition.
3.2.2. Kinematic data analysis
We now proceed to evaluate the kinematic data of the main experiment. As stated above, the categorical errors accounted for in the previous section are excluded from the analyses presented in the remainder of the paper. To assess whether speakers changed their production patterns between native and non-native conditions, we calculated the log squared Mahalanobis distance ratio of each token from the main experiment to the audio model distributions (in two dimensional space using onset lag and normalized plateau lag) as follows. We calculated the squared Mahalanobis distance of each token to the two audio model productions, giving us two Mahalanobis distance values, M1, M2, per token which represent the distance of a given token to the German (M1) and Georgian (M2) audio model productions respectively. We then take the log Mahalanobis distance ratio (MDR), as log(M1/M2), to quantify the relative proximity of the given token to the two audio model distributions.
An MDR of zero means that the token is equidistant to the two audio model distributions. A negative MDR means that a given token is closer to the German audio model than to the Georgian audio model. Our main question is whether the MDR values change between native and non-native conditions and whether German speakers further differentiate, in the non-native condition, between clusters that are phonotactically legal for them (i.e., they occur in both languages) and those clusters unfamiliar to them (legal in Georgian only).
In the first instance, we confine the analyses to the clusters that exist in both languages. Note that the reference distributions of the audio models relative to which the Mahalanobis distance values were calculated contain all audio model data (as given in Figure 3); this way MDR values are comparable across the different analysis sections of this paper.
On the left of the boxplot in Figure 5 we see the MDR values for the German speakers separately for the native and non-native conditions. There is a clear difference between the two conditions with the native condition being closer to the German audio model (negative
values) and the non-native condition being closer to the Georgian audio model (positive values). For the Georgian speakers, on the right-hand side of the graph, both medians are positive, indicating that the productions are overall closer to the Georgian audio model. By visual inspection there is no difference between conditions for the Georgian speakers, and both conditions are closer to the zero line compared to the German speakers (the zero line indicates equidistance to the two audio model distributions).
For statistical analysis, we considered a model with a 3-way interaction Native Language × Condition × Cluster; this model did not converge. We therefore designed a model that takes account of the two-way interactions and thus corrects for the effects of Cluster in the data but we do not evaluate cluster effects at this point of the analysis, where we are interested in overall adaptation effects between conditions. We consider cluster-specific effects in a separate analysis below. The statistical model had the dependent variable MDR with the fixed factors Condition (native, non-native), Native Language (German, Georgian), and Cluster (7 levels). Repetition was included as a fixed factor. The interactions included were Native Language by Condition, Cluster by Condition, and Cluster by Native Language. Random factor was random by-Condition intercept and slope for Participant. All effects (except for Repetition) and interactions were significant: Condition: F(24.9) = 8.1, p = .009; Native Language: F(18.6) = 5.4, p = .03; Cluster (1177.68) = 21.6,
p < .001; Native Language × Condition: F(18.6) = 7.5, p = .013; Condition × Cluster:
F(1180.8) = 2.9, p = .007; Native Language × Cluster: F(1178.1) = 4.3, p < .001. The important aspects of these results at this point in the analysis are that the two speaker groups differ significantly from each other overall, as well as the significant Condition × Native Language interaction. This significant interaction arises because the German speakers show a larger differentiation between the conditions compared to the Georgians.
In the preceding analyses, we asked how much a given token approximated the overall
distributions of the audio models which the participants heard. The results revealed a
significant difference between the two speaker groups. It is notable that the two speaker groups also differ in their relative distance to their native audio models. Therefore it is important to also evaluate the relative change between conditions for the two speaker groups independently of the audio model distributions.
Figure 5: MDR values by speaker group and condition; only clusters existing in both languages are included. A negative MDR means that a given token is closer to the German audio model than to the Georgian audio model.
● ● ● ● ● ● ● ● ● ● ● ● ● ● ● ● ● ● ● ● ● ● ● ● ● ● ● ● ● ● ● ● ● ● −12 −9 −6 −3 0 3 6 9 12 German Georgian Native language MDR CONDITION Native Nonnat. MDR by condition
We thus paired the data from the native and non-native conditions produced by each speaker in order to assess the degree of change each speaker exhibits between conditions without explicit reference to the audio model distributions. We correlated separately for the two speaker groups the productions from the native and the non-native conditions. Samples from the two conditions were paired as follows: For each speaker, we computed a by-cluster average for their native productions. Each token for a given speaker and given cluster produced in the non-native condition was then paired with that speaker’s native average for that cluster. For instance, German speaker DE1’s native /bl/ productions were averaged and each of DE1’s non-native /bl/ productions was paired with their native /bl/ average. We then correlated these matched native and non-native production values across speakers within a given language group. If speakers did not change their production pattern for a given cluster between conditions, there should be a very strong correlation between their native and non-native productions. To the degree that they changed their production pattern between conditions, a relatively weaker correlation should hold.
Figure 6 gives the scatterplot for the normalized plateau lag measure. Both correlations
were significant which is not surprising given we are correlating speakers’ own productions across conditions. More interesting is here the marked difference in the strength of the correlation for the two speaker groups. For the German speakers, the correlation was weak with r = .21 (p < .001), reflecting what we have already observed in terms of the MDR ratios: German speakers change their production patterns between the native and non-native conditions. In contrast, for the Georgians the correlation was comparatively strong with r = .65 (p < .001) which again confirms that the Georgian speakers do not seem to adapt their consonant coarticulatory timing patterns between the native and non-native conditions.
We now investigate whether speakers react to finer grained differences between clusters within the audio model productions and show cluster-specific effects in their non-native productions. Observe, for instance, how in Figure 3 the distance between /kl/ between the German and Georgian audio model productions is much larger than between the two /ʃp/ productions because within Georgian, /kl/ has a much larger onset lag value
Figure 6: Scatterplot for normalized plateau lag pairing on a by-cluster basis each speaker’s native and non-native productions, separately for the two speaker groups.
0.0 0.5 −0.25 0.00 0.25 0.50 Native productions Non−nativ e productions Speaker group German Georgian Normalized plateau lag
compared to /ʃp/. If German/Georgian speakers imitate these cluster specific differences, we should see a greater change in MDR value for, e.g., /kl/ than /ʃp/. We tested this for the German and Georgian data separately. The statistical model had the dependent variable MDR and the independent variables Condition (native, nonnative), Cluster (7 levels), and Repetition and a by-participant random intercept. Models with a random slope did not converge. If speakers’ adaptation to the non-native audio model varies as a function of cluster, we expect a significant interaction. For the German speakers, Condition was significant (F(549.04) = 15.9; p < .001), as was Cluster (F(549.48) = 6.4, p < .001) and indeed the interaction (F(548.65) = 4, p = .0006). For the Georgian speakers, Condition was not significant (F(642.46) = 2.6, p = .11), but Cluster (F(642.75) = 21, p < .001) and the Interaction were (F(642.08) = 3.5, p = .002).
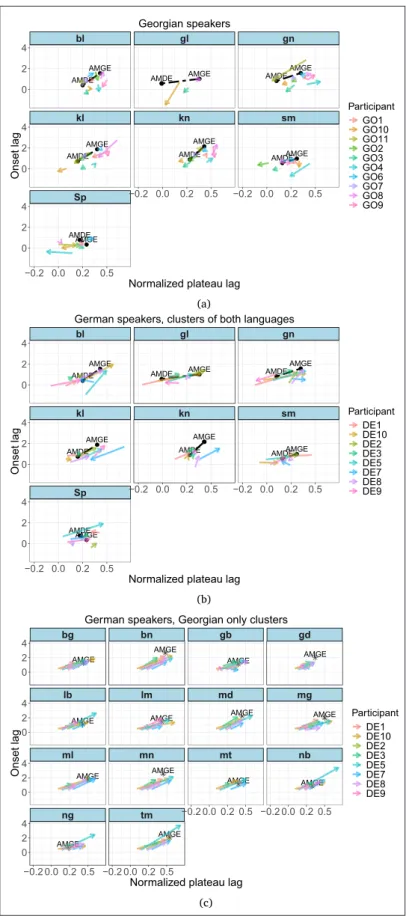
The significance of this interaction alone tells us that speakers’ pronunciation changed to different degrees between conditions as a function of cluster, but it does not tell us about the direction of change. Figure 7a and 7b illustrate for each cluster the average change per speaker between the native and the non-native condition. The arrows always point in the direction of change from native to non-native condition. The audio model productions for the clusters are also indicated in each panel. We can observe that the German speakers quite consistently changed their productions towards the Georgian audio model. The Georgian speakers, for whom there was overall no effect of condition, do show changes between conditions on a by-cluster level, hence the significant interaction. However, in contrast to the German speakers, the Georgian speakers’ production behavior was not necessarily influenced by the German audio model. The arrows point in all directions, and there was generally less change for the Georgian speakers.
We next proceed to look at the role of the phonotactic status of the cluster, i.e., whether the cluster is legal in both languages or in Georgian only. Here we have to treat the German and Georgian data separately and begin with the Georgians. Recall that the German cluster inventory is a subset of the Georgian cluster inventory and hence all clusters are phonotactically legal for the Georgian participants. Yet since the Georgians all had some proficiency level in L2 German, and given that native patterns are known to drift towards an ambient L2 language (Chang, 2013; Sancier & Fowler, 1997), it does seem relevant to look for this speaker group at the native condition and differentiate clusters that exist in Georgian only versus those that exist in both languages. Figure 8a gives the MDR Distance values for all data recorded from the Georgian speakers for the native condition by cluster status (both languages, Georgian only).
Statistically, we compared the MDR values of the two groups in Figure 8a with fixed factors Cluster Status and Repetition and by-participant random intercept and slope for Cluster Status. Note that inclusion of Cluster as fixed factor was not possible here due to the collinearity between Cluster Status and Cluster. The effect of Cluster Status was not significant (F(10.11) = 1.2 and p = .3). We conclude that there is no evidence for a difference between the two cluster groups in the Georgian speakers’ native productions in MDR values.
We now turn to the German participants, the main group of interest of this analysis.
Figure 8b gives the MDR values as a function of Condition and Status. The boxplot
suggests a three-way distinction for the German speakers. Since we have already seen above that the MDR values for the German speakers for the clusters that exist in both languages differ significantly from each other (significant interaction in Figure 5), we ran here a model comparing the two cluster groups in the non-native condition. The model had the dependent variable MDR and the fixed factors Cluster Status and Repetition, and a random intercept and slope for Cluster Status by Participant. Cluster Status was significant (F(8.21) = 60.8; p < .001).
● ● AMDE AMGE E E E E E E E E E M M●●●● MD M M MD MDE●●●●●●●●●●DDDDDDD MDDD ●●●●● ● ● AMDE AMGE ● ● ●DEDE ● ● ● M M●●●●●DDDDDDDDDDDEEEEE ●● G D DEE D D DE D D D DEEE DE D DE DEEEE D D D DEEEEE E E ● ●
AMDEAMAMGEAM●●●●●●●●MGMEEEGEGEGEG
● ● AMDE AMGEM●●●●●●●●●●●●●●● ● ● AMDE AMGE● E ● ●DE ● ● ●DD ● ● ● ● ● ● ● ● DE DE DE D D ● ●
AMDEMMDEM●●●●●D AAAMGEAM●●●●●
● ● AMDEAMGE●●●● ● ●DEEE M EEEEEEEE● ● ● ● ● ● MDD MD●●●●●●●●●●●●●●●D Sp kl kn sm bl gl gn −0.2 0.0 0.2 0.5 −0.2 0.0 0.2 0.5 −0.2 0.0 0.2 0.5 0 2 4 0 2 4 0 2 4
Normalized plateau lag
Onset lag Participant GO1 GO10 GO11 GO2 GO3 GO4 GO6 GO7 GO8 GO9 Georgian speakers D ● ● AMDE AMGE ●DEEE E E E E M M M M M A AMMDEMDEMMMMMM●●●●●●●●●●●●●●●●●●●●●●DEDDDE●●●●●●● A●●● ● ● AMDE AMGE ● ● M E●●●●●●DDEDDEDEDDDDDDEE MD●●●●●●●●●●●DEDDDDDDDDDDDDDDDDDDDD ● ● AMDEAMGEDEDMGMGMMGGEGEEEEEEE AMDE A DMMAAAAMAM●●●●●●●M ● M M M ● ● ● ● ● ●MMMMMM ● ●MM ● ● ● ● ●G MG M●●● ● ● AMDE●●●●●●●● AMGE●●●●●●● M●●●●● MG M●● M●●●●GG E ● ● AMDE AMGE ● ● ● M●●●●● M●●●●●●● MD M M M MD●●●●●DDDDDDDDDDDDDDDEDDDDD ● ● AMDE●●●●DEEAMGE●●●●●●● ● ● ● M ● ● AMDEDEAMGEEEEEEEE● ●EEEEEE●●●●●●●●●●●●●●●● ● ● ● ● ● ●DDDDEE ● ● ● ● ● ● ● ● ● ● ● ● ● ● ● ● ● ● ● ● Sp kl kn sm bl gl gn −0.2 0.0 0.2 0.5 −0.2 0.0 0.2 0.5 −0.2 0.0 0.2 0.5 0 2 4 0 2 4 0 2 4
Normalized plateau lag
Onset lag Participant DE1 DE10 DE2 DE3 DE5 DE7 DE8 DE9
German speakers, clusters of both languages
E AMGE A A GEGEEE AMMMMGMMMMMMMMMMGMMMMMGMMMGGGGGGGGGGGGGGGGGGGGGGGGGGGGGGGGGGGGGGGGGGGGGGGGGGGGGGGGGGGGGGGGGGGGGGGGGGGG AMGEMMMMMMMMMMMMMGMGGGGGG AMMGMMMMMMGMGMMMMMMMMMMGMGGGGGG A A A A A AM AMMM AMMM A A A A AM A A AM AM AMGEMMMGMMMMGGEGGGGGGGGGGGEGGEGGGGGGGGGGGGGGE AMGEMMMMGEMGMMMMMGMMGMMGGGGGGEGGGGGGGGGGGGGGGGGGGGGGGGGGGGGGGGGGGGGGEGGGGGGGGGGGGGGGGGGGGGGGGGGGGGGGGEGGGGGGGGGGGEEEEEEEEEEEEEEEEEEEEEEEEEEEEEEEEEEEEEEE AMGE AMGEMMMMMMMMMMMGMMMMMMGGGEGGGEGGGGGGGE AMGE AMGEMMMG AMM AMGE AM AM AM AMMMGMMMMMMMMMGMMGMMMMMMGGGEGGGGGEGEGGGGGGGGGGGGEEE AMGEGEE AMGEMMMGMGGGG AM AMMMMMMMMMMMM A A A AMMMMMMMGMMMGGGEGEGGGGGEGGEGEGGGGEEEEEEE AMGE AMGE AMGEMMGGEGEGEGGEEEEEE A AMMMMMMMMMMMMMMMMMMMMGMMGMMMMMMMMMMMGMMMMMMMMMMMMMMGGGGGGGGGGGGGGGEGGEGEGGEGEGGGGGEGGGGGEGGGGGGGEGGGEGGGGGGGGGGGEEEEEEEEEEEEEEEEEEEEEEEEEEEEEEEEEEE AMM A AMMMMMM A AMMMMMM AMMMMM AMMMM ng tm ml mn mt nb lb lm md mg bg bn gb gd −0.2 0.0 0.2 0.5 −0.2 0.0 0.2 0.5 −0.2 0.0 0.2 0.5 −0.2 0.0 0.2 0.5 0 2 4 0 2 4 0 2 4 0 2 4
Normalized plateau lag
Onset lag Participant DE1 DE10 DE2 DE3 DE5 DE7 DE8 DE9 German speakers, Georgian only clusters
F
Figure 7: Average change for each speaker and cluster between the native and non-native conditions. In Figures (a) and (b), the black dashed line indicates the distance between the two audio model productions. AMDE and AMGE stand for the German and Georgian audio model, respectively. <Sp> stands for /ʃp/. Figure (c) shows German speakers’ productions of the clusters existing in Georgian only. In this case the native/starting point of the arrow is the mean of each speaker’s native condition productions across clusters. The Georgian audio model productions are indicated by an asterisk and the letters AMGE.