HAL Id: halshs-02160268
https://halshs.archives-ouvertes.fr/halshs-02160268
Preprint submitted on 19 Jun 2019
HAL is a multi-disciplinary open access
archive for the deposit and dissemination of sci-entific research documents, whether they are pub-lished or not. The documents may come from teaching and research institutions in France or abroad, or from public or private research centers.
L’archive ouverte pluridisciplinaire HAL, est destinée au dépôt et à la diffusion de documents scientifiques de niveau recherche, publiés ou non, émanant des établissements d’enseignement et de recherche français ou étrangers, des laboratoires publics ou privés.
Technology-induced Trade Shocks? Evidence from
Broadband Expansion in France
Clément Malgouyres, Thierry Mayer, Clément Mazet-Sonilhac
To cite this version:
Clément Malgouyres, Thierry Mayer, Clément Mazet-Sonilhac. Technology-induced Trade Shocks? Evidence from Broadband Expansion in France. 2019. �halshs-02160268�
WORKING PAPER N° 2019 – 27
Technology-induced Trade Shocks? Evidence
from Broadband Expansion in France
Clément Malgouyres Thierry Mayer Clément Mazet-Sonilhac
JEL Codes: Keywords :
Technology-induced Trade Shocks? Evidence
from Broadband Expansion in France
∗
Cl´ement Malgouyres
†Thierry Mayer
‡Cl´ement Mazet-Sonilhac
§June 12, 2019
Abstract
In this paper, we document the presence of “technology-induced” trade in France between 1997 and 2007 and assess its impact on consumer welfare. We use the staggered roll-out of broadband internet to estimate its causal effect on the importing behavior of affected firms. Using an event-study design, we find that broadband expansion increases firm-level imports by around 25%. We further find that the “sub-extensive” margin (number of products and sourcing countries per firm) is the main channel of adjustment and that the effect is larger for capital goods. Finally, we develop a model where firms optimize over their import strategy and which yields a sufficient statistics formula for the quantification of the effects of broadband on con-sumer welfare. Interpreted within this model, our reduced-form estimates imply that broadband internet reduced the consumer price index by 1.7% and that the import-channel, i.e. the enhanced access to foreign goods that is allowed by broadband, accounts for a quarter of that effect.
∗We are grateful to Philippe Aghion, Antonin Bergeaud, Antoine Bozio, Thomas Breda, Bruno
Cr´epon, Franc¸ois Fontaine, Tarek Harchaoui, Claire Lelarge, David Margolis, Isabelle M´ejean, Jean-St´ephane M´esonnier, Ariell Reshef, Fr´ed´erique Savignac, Marcel Timmer and participants at Crest, Coll`ege de France, Groningen GEM, 2018 European meeting of the Econometric Society in Naples, the 2018 DARES conference, PSE labour seminar, Bolzano OECD-workshop, RES 2019,
OECD applied economics seminar and the 9thmeeting of the Urban Economics Association in
Amsterdam. This work is supported by public grants overseen by the French National Research Agency (ANR) as part of the “Investissements d’avenir” program within the frameworks of the Centre d’acc`es s´ecuris´e aux donn´ees - CASD (ANR-10-EQPX-17). We thank Julienne Liang for help with understanding the data on local exchange upgrading dates. We are extremely grateful to Laurian Choain and ARCEP for providing the ARCEP data on local exchanges coverage. Re-searchers from the Banque de France participated in this work, the views expressed in this paper are their own and do not necessarily reflect those of the Banque de France or the Eurosystem.
†Institut des Politiques Publiques (IPP) and Paris School of Economics (PSE)
‡Sciences Po, Banque de France, CEPII and CEPR
1
Introduction
From 1995 to 2008, the value of imports by high-income countries has grown twice as fast as global GDP.1 This acceleration of globalization has induced
well-documented labor market impacts (Autor et al., 2016b, summarize the recent lit-erature on the impact of the “China shock” on labor market outcomes), as well as rises in consumer welfare through lower prices and gains in varieties (see Feen-stra and Weinstein, 2017, for a recent example). This period was also charac-terized by radical innovations in information and communication technologies (ICT) and by their rapid diffusion throughout the world economy. It is most likely that the “ICT revolution” (Cohen et al.,2004) lowered the cost of carrying out international transactions and contributed to raising the pace of economic integration. To the extent that ICT facilitated international trade, part of the con-sumer gains induced by trade development should be attributed to the diffusion of ICTs. In this paper, we test this proposition by estimating the effect of the diffusion of broadband internet on the importing behavior of French firms from 1997 to 2007 and by developing a theoretical framework to assess the impact of broadband-induced imports on consumer welfare.
Identifying the causal effect of technology on trade is generically difficult be-cause of its endogeneity. The French data and context allow us to make progress on the causal identification of how technology affects firm-level import behavior. In terms of data, we assemble a novel dataset on broadband internet availability at the municipality level over the 1997-2007 period and combine it with informa-tion regarding firms’ importing behavior. Regarding the context, we exploit the gradual roll-out of broadband internet in France, which was staggered over sev-eral years due to limited funding and completed primarily in order to maximize population coverage with only limited attention paid to local economic condi-tions. This setup provides natural ground for an event-study identifying how ICT availability affected firms’ importing behavior.
We find that the local access to broadband internet leads to a surge in the total value of firm-level imports. Our point estimate implies a 25% increase after five years. When applied to our estimating sample and taking into account dynamic effects, the aggregate effect of broadband expansion on the value of imports in constant dollars over the 1997-2007 period was to increase its growth rate from 75% to 91%, i.e. 16 p.p. or 21%. Our results are robust to several potential threats
1The World Bank World Development Indicators report that the ratio of imports over GDP for
to identification. First, we find no evidence of pre-expansion differential trends in outcomes. Second, while it is possible that broadband introduction was sys-tematically associated with contemporaneous local economic shocks, we show that adding a rich set of city-level controls for local industry and income dynam-ics hardly affects our estimates. Additionally, flexibly controlling for changes in local labor market conditions, by including a large set of local fixed effects inter-acted with year dummies, barely changes our estimates.
We further document changes in importing activities along several margins. We find that the increase in the overall value of imports is primarily associated with an increase in the number of flows and find no effect on the average value per flow (where a flow is defined as the combination of an importing firm, an origin country and a specific product). All types of goods (intermediary, con-sumption and capital) are affected. We also find that broadband internet has a positive impact on firm performance as measured by value-added and sales. Im-portantly, the import-intensity of firms increases: the ratio of imports over sales is positively affected and the share of domestic inputs in overall consumption of intermediates declines.
In the final part of the paper, we assess the welfare implications of our em-pirical findings through the lens of a simple but general theoretical model of firm-level imports. We use the standard monopolistic competition cum CES de-mand setup for final goods so as to link firm-level sales with (quality-adjusted) unit cost. On the production side, firms combine labor with domestic and im-ported inputs. Our model features the sufficiency result highlighted by Blaum et al. (2018): the firm-level domestic share of inputs fully characterizes the con-tribution of imports of intermediates to the reduction of its unit cost. The gen-erality of the setup allows us to remain agnostic regarding which type of trade costs (variable, fixed per destination or product, search friction etc.) is affected by the broadband internet expansion shock. It also generates a very parsimonious framework for welfare analysis. The overall effect of access to fast internet on the consumer price index and the contribution of enhanced access to foreign inputs to that overall effect (which we refer to as the import channel) are expressed as a function of two reduced-form estimates and three parameters to be calibrated (either from descriptive statistics or from the existing relevant literature). Under our preferred values for calibrated parameters, our event-study estimates imply that broadband internet led to a price index decrease of 1.7%. The import channel contributed up to 0.48%, i.e. about one quarter of the overall effect.
The remainder of the paper is structured as follows. We start by relating our paper to several streams of papers that have studied the links between technol-ogy improvements and trade. We then present the data and institutional context in Section3. We detail our empirical approach in Section4. Baseline results and robustness checks are presented in Section5. Section 6analyses the heterogene-ity of the effect by types of goods and sourcing country. The section additionally presents findings on firm sales and value-added as well as import intensity (im-ports over sales and im(im-ports over overall intermediate consumption) that will be important inputs into the welfare analysis that is carried out in Section7. In Sec-tion7, we introduce a firm-level model of input importing and derive the welfare formula allowing us to quantify the contribution of the import-channel as well as the total effect of broadband internet on consumer welfare.
2
Literature
This paper connects with several strands of the literature. First, it enriches the large literature regarding the interactions between trade and technical change. Second, it has implications for the origins of trade shocks whose effects have been extensively studied in recent years. Finally, it contributes to the literature on firm international sourcing choices.
While technology is often mentioned as a force amplifying globalization, em-pirical evidence on the matter appears scarce. For instance, in his rich account of the recent wave of globalization and its interplay with technology, Muendler (2017) mentions the possibility of technology-induced trade but does not cite em-pirical papers estimating the impact of ICTs on trade flows. Baldwin(2016) ar-gues that globalization over the 1990s and 2000s was driven by information tech-nology by lowering the cost of coordinating activities across borders. It boosted intra-industry trade between advanced economies and a handful of emerging economies as multinational firms from the North moved labor-intensive tasks to the South. Steinwender(2018) provides empirical evidence on the role of the an-cestor of modern ICT on trade during the 1800s by studying the impact of the telegraph on trade between the United Kingdom and the United States. A possi-ble reason as to why modern data causal evidence on technology-induced trade is rather scarce might be related to the difficulty of measuring technology availabil-ity at the firm-level that varies over time while simultaneously observing trade patterns. Consequently, most studies documenting a positive impact of ICT on
trade are either at the country (Portugal-Perez and Wilson,2012;Clarke and Wall-sten,2006) or macro-regional level (Barbero and Rodriguez-Crespo,2018).2
There are some recent exceptions that have documented the effect of tech-nology using firm-level trade and outsourcing decisions. Kneller and Timmis (2016) find a positive effect of broadband internet on the export of services. Fort (2017) documents the firm-level relationship between investing in an electronic-integrated network and outsourcing, either domestic or international, of complex manufacturing tasks. In the context of developing African economies and rely-ing on survey data,Hjort and Poulsen(2018) show that fast internet increases em-ployment and that rising exports is one of the mechanisms explaining the upward shift in labor demand. Most closely related to our paper isAkerman et al.(2018) who estimate how broadband local availability affects the effect of distance on trade flows using a panel of bilateral trade flows between Norwegian cities and foreign countries, building on the identification strategy ofAkerman et al.(2015). While their results display a significant interaction effect between fast internet and distance, they do not find that broadband increases significantly trade flows. Their coefficients are positive, although imprecisely estimated. We depart from these papers in several ways. First, we focus on the import side with the aim of quantifying the welfare consequences of the broadband-induced variation in im-ports. Second, we are able to document additional margins of adjustment of trade to broadband expansion, notably the “sub-extensive” margin of imports (i.e. the number of goods and origin-country imported by firms) that has been shown to be relevant in other settings (Gopinath and Neiman, 2014). Third, while Aker-man et al.(2018) frame their empirical analysis in the gravity literature, aiming at explaining the distance puzzle, we adopt a more agnostic approach and aim pri-marily at documenting the extent to which technology-induced trade might have contributed to the recent rise in import penetration across advanced economies. Finally, we combine our estimates with a simple theoretical framework to quan-tify the impact of broadband internet on consumer welfare, relying on a sufficient statistic approach. We focus on welfare and do not model explicitly the impact of internet on the geography of trade.3 A limitation of our paper with respect
2Several papers have recently documented the impact of trade on innovation, i.e. the reverse
direction of causality compared to our focus. Aghion et al.(2018) find that expanding exporting
opportunities increase the innovative activities of the most productive firms. On the import side,
Bloom et al.(2016) find that greater Chinese import competition from China is associated with
higher firm patenting in a panel of European firms whileAutor et al.(2016a) find opposite results
in the US case.
3Note also that our sample size is considerably larger due to the sheer number of
municipali-ties in France (about 35,000 cimunicipali-ties versus 400 in Norway) thus allowing us to uncover effects that might be otherwise impossible to detect.
toAkerman et al.(2018) is that we do not observe firm-level adoption and there-fore focus on local availability while they have access to information on broadband adoption from surveys. They can therefore estimate the effect of adoption on trade while we focus on the reduced-form. Note however that the reduced-form effect is relevant policy-wise as it is straightforward to increase local broadband avail-ability through policy intervention while manipulating adoption involves more intricate interventions.4
Starting withAutor et al.(2013), a growing body of evidence, based on a local labor market approach5, has documented the impact of trade shocks from
emerg-ing countries – in particular China and Eastern European countries, seeDauth et al. (2014) – on the local labor market outcomes (manufacturing employment, wages or employment rate etc.). Most studies analyze the effect of trade or tech-nology in isolation, treating the factor left-out as a potential omitted variable to account for. By contrast,Autor et al.(2015) attempt to “untangle” the respective effect of trade and technology on several local labor market outcomes, notably the decline in manufacturing employment in the USA. Their analysis, however, considers sectoral aggregate trade flows as given. We instead make the point that the remarkable increase in trade flows over the period is in part driven by concomitant technical change. Moreover, we also find a large effect for imports sourced from Eastern European countries and China, suggesting that the recent “trade shocks” from the 2000s were, in part, driven by technological change. Our results echo the point raised byFort et al.(2018) that in the presence of technology-induced trade, it is delicate to disentangle the effects of technology from those of trade.
A sizable reduced-form literature has documented that increased access to foreign inputs lead to favorable firm-level outcomes, notably productivity gains (Amiti and Konings, 2007; Topalova and Khandelwal, 2011). Most of the litera-ture relies on trade liberalization episode to estimate the effect of trade in inputs on firm-level outcomes.6 We contribute to this literature by using a new source of
identifying variation (staggered roll-out of an ICT) and implementing a
transpar-4SeeAndrews et al.(2018) for a cross-country empirical investigation of the numerous
deter-minants of ICT adoption by firms and their complex interaction.
5This approach was pioneered by Topalova(2010) andKovak (2013) who analyse the local
impact of trade liberalization in India and Brazil respectively.
6In their recent assessment of the literatureShu and Steinwender(2019) review 20 papers, 15
of which adopt a reduced-form approach. Among these 15 papers, 14 rely on variation in foreign
input access driven by trade policy reforms. The one exception isJuh´asz and Steinwender(2018)
who estimate the effect of the roll-out of the telegraph network on technology adoption. While the source of variation is similar to ours, the context (19th century), the level of variation (cross-country) and the outcome differ starkly from our set-up.
ent event-study design that is allowed by the longitudinal nature of the data and the large number of local events. An additional contribution is to build on recent theoretical results in the literature on firm-level importing (Blaum et al., 2018) in order to translate our reduced-form estimates overall impact of broadband inter-net consumer welfare and to isolate the contribution of the import channel.
As such, our findings also relate to the theoretical and structural literature studying the link between international sourcing, productivity and consumer welfare (Halpern et al.,2015). As broadband internet is found to increase the share of spending on foreign inputs as well as the variety of inputs, trade appears to be one of the mechanisms through which fast internet boosted productivity and ulti-mately consumer welfare. The paper documents the direct effect of broadband on firm-level outcomes, most importantly sales and value-added (subsection6.3). In order to quantify the import channel through which fast internet boosts imports, we take our reduced-form estimates into a general model of firm-level import-ing. Rather than specifying the model fully and estimating its parameters (as in e.g.Sandoz, 2017;Antras et al., 2017), we rely instead on a sufficient statistics approach (Chetty,2009) as first developed byBlaum et al.(2018) in the import lit-erature.7 Our estimates combined with the calibration of this model with French
data implies that broadband internet allowed for a reduction of about 1.7% in the unit cost of production and that about 25% of that overall effect is related to the import channel.8
3
Data and context
3.1
Context: the diffusion of Broadband Internet in France
The ADSL technology.The ADSL (Asymmetric Digital Subscriber Line) is a data communication technology that enables fast data transmission over copper tele-phone lines (much faster than what a conventional voiceband modem could
pro-7These micro-results build on the seminal work of Arkolakis et al.(2012) that show that in a
large class of trade models observed changes in the share of domestic consumption, together with the price elasticity of trade are sufficient statistics for evaluating welfare changes associated with a foreign shock.
8Perhaps more incidentally, our paper contributes to the literature on the overall impact of
broadband internet (Bertschek et al.,2015) for a recent review. Few papers documented the local
economic impact of broadband internet in France and no paper we are aware of look at firm-level outcomes. In a set of two papers, Houngbonon and Liang document a negative effect of broad-band penetration, as measured by ratio of residential connections to the number of households,
on the local Gini coefficient over the 2009-2013 period (Houngbonon and Liang,2017) and a
posi-tive effect on service employment (Houngbonon and Liang,2018). We instead focus on the period
of expansion of broadband availability that is driven by the gradual upgrading of the copper wire infrastructure over the 1999 to 2007 period.
vide). In the ADSL technology, bandwidth and bit rate are said to be asymmetric, meaning greater towards the customer premises (downstream) than the reverse (upstream). Eligibility for ADSL depends on the distance between the final cus-tomer (e.g. home or office) and the Local Exchange (LEs), since the intensity and the quality of the analog signal decreases as it is routed over the copper lines. Local Exchanges are the telephone exchanges owned by the incumbent operator France T´el´ecom (later renamed Orange) into which subscribers’ telephone lines end. As of 2008, there were about 17 000 LEs spread throughout the country. Initially dedicated to the telephone network, LEs are essential for Internet users who subscribe to ADSL. LEs aggregate local traffic and then direct it via the so-called backbone (i.e. higher levels of the network) towards the world wide web. A key feature of the ADSL technology is that one can supply high-speed Internet by upgrading the LE while relying on the existing (copper) local loop to connect the premises of the final customers. The upgrading involves the installation of an equipment inside the LE called a DSLAM (Digital subscriber line access mul-tiplexer) that is required in order to recover the data transmitted via ADSL on the local copper loop and adapt it so it can be transmitted to the higher levels of the network (which are typically relying on optical fiber). The upgrading of local LEs is the key source of variation we will use in our empirical analysis (see section
3.2.1for more details on the data).
The ADSL roll-out in France.The ADSL technology became popular during the 1990s, as many OECD countries were planning the expansion of services related to information and communications technology. In the early 2000s in France, the deployment of the technology beyond France’s largest cities was slow. The causes for this staggered deployment are multiple. First, France Telecom (FT), the monopolistic telecom supplier at the time and still the main supplier today, was unsure as to whether it was going to be able to make the upgraded infrastructure available to new competitors with a positive markup or not. The uncertainty regarding the wholesale price FT was going to be able to charge made the firm reluctant to upgrade LEs beyond the largest cities (see S´enat, 2002, p.232). This uncertainty was lifted after a series of decisions by the regulatory agency set the conditions of that wholesale market (Arcep,2002).
Moreover, at the same time France Telecom had to invest massively in up-grading its LEs to ADSL, it went through an debt crisis which ended with what was essentially a government bailout in 2002. One can find anecdotal evidence of the impatience of the French government in accounts of Parliamentary debate (at
the Senate) regarding the excessively slow expansion of broadband internet (Tre-gouet, 2001) and the difficult cooperation between the French government (the Ministry in charge of the Industry) and France T´el´ecom.
Under the impulse of the government – which increased its stake in the firm during the 2002 bailout of the firm – France Telecom pledged in 2003 to cover 90% of the French (metropolitan) population by the end of 2005, i.e. all local exchanges (LEs) with more than 1000 lines, for a total investment of 600 M euros (750 M euros in 2018 prices) (Telecom,2003).
Between 2004 and 2007, local governments (called d´epartements9) started to
play a role in subsidizing deployment and favoring competition among providers. Most relevant for broadband expansion is the creation of a contract between local governments the “Plan D´epartement Innovant”. It is a contract whereby France Telecom pledged to equip all LEs with more than 100 connections within a year in that d´epartement. The proclaimed target of the plan was to raise the French popu-lation coverage up to 96% by the end of 2005 and activate all the remaining LE by the end of 2006 (Telecom, 2003). About 50 departments signed the chart in 2004 even though many experienced delays. This commercial initiative was widely perceived as a way for FT to counter the direct involvement of d´epartements in broadband provision that was made possible by a law voted in 2004.10 We
ac-count for the role of d´epartements in our empirical analysis by carrying a within-d´epartement analysis (we include within-d´epartement-year fixed effects throughout). FT claimed to have reached the full coverage of all relevant LEs in July 2007 (Le Gall, 2007), covering 98% of the French metropolitan population.
Overall, the account of the broadband expansion in France over the period suggests that it was gradual due to uncertainty regarding the capacity of France Telecom to undergo the investment until 2002. After 2002, with the strong im-pulse of the government, France Telecom started covering more secondary areas with a focus on the overall number of lines per LE with only limited attention paid to local economic potential. While accelerated, the coverage remained grad-ual due to operational limits on the part of FT and took about 2 more years than anticipated in 2003.
Our main effects of interest are identified out of the gradual diffusion of the new technology in different LEs over space and time. The question of what were the criteria for deciding to “treat” one LE before another is of course central for our paper. It is the topic of a whole section immediately preceding the results
9There 95 d´epartements in mainland France.
(section4.2), where we present evidence that the main determinant was the city-level population density, with no role for city-levels or trends in the trade patterns of the city.
Finally, it is worth noting that several sources show that the ADSL technology, while progressively replaced by other technologies – notably direct access to the optic fiber or FTTO (fiber to the office) –, is still the main way firms access the internet. In particular, based on a recent survey, it appears that 73 % of SMEs use ADSL technology only as of 2016 (Arcep,2016). Moreover it constituted not only a massive improvement in terms of speed (from 56 to 512kbit/s for a transition from a classical to first generation ADSL connection) but also in terms of cost and time of connection.11
3.2
Data
In this paper, we combine three main sources of information: a unique city-level dataset on broadband internet availability, firm-level trade and employment, and firm-level balance sheet information. We provide a detailed description of our data in the following subsections. More details on the datasets used is provided in AppendixB.1.
3.2.1 Broadband internet data
The most novel aspect of our data is the (manually collected) date of upgrade to ADSL in mainland France for each Local Exchange (LE)’s.12 The historical operator was compelled by law to make this data available to other operators as well as websites allowing consumers to gauge the quality of their line. The data was collected through one such website.13 We additionally obtained data from
the regulatory agency (ARCEP) regarding the geographical coverage of each LE. The data documents the area of each census block (IRIS) that is covered by a given LE. Each city in France is partitioned into census-blocks.
Combining both datasets, we construct a continuous measure of broadband ac-cess of city i at year t . This measure, which we denote eZit, is a time-weighted
11FT was providing services at 128kbits at a much higher cost (Badr´e,2007).
12Throughout the paper, broadband or ADSL refers to first generation ADSL that is associated
with speed of 512 kbit/s.
13We were able to check with economists at Orange that our dates matched exactly their data
percentage of area covered in city i. It is formally defined as: e
Zit=
X
b∈i
# days with access in b since Jan 1st of t #days in year t | {z } =Dbt ×Pareabt b∈iareabt | {z } Abt (1)
where b ∈ i denotes the census tracks included in city i.
Discretizing the variable. We see that eZit is in principle continuous between 0
and 1. eZitwill be equal to one if all of its areas have had access for the entire year.
It will be equal to 1/2 if the entire city has had access to broadband over half the year t.
While the continuous measure is useful, as it allows to gauge the state of broad-band penetration, we do not use it directly in our empirical estimations. Indeed, regressing trade outcomes on this measures would assume that the effect of an increase eZitby, say 0.5, will be the same whether it stems from an coverage of the
whole city over half the year or an increase in half the city area of the entire year. As we do not have strong theoretical reason to think that would be the case, but we still believe that the two sources of information are valuable, we discretize the treatment status by setting treatment status to 1 after the city experienced its highest increase in eZit. Formally, we define the year of treatment as ti0 =
argmaxt∆ eZitand discretized treatment status as Zit =1{t ≥ ti0}.
As seen from Figure1in practice the empirical distribution of eZitis heavily
con-centrated on 0 and 1 and accordingly Zit and eZit are strongly related (ρ = 0.90).
Another way to assess the relationship between the continuous and discrete vari-ables is to trace the evolution of eZit around ti0. Figure A1 plots the coefficients
of a regression of eZit on a set of dummies for each time with respect to ti0. The
results show a sharp increase between −1 and 0 from 0 to 0.4 and to 0.9 at +1. The coefficients are estimated with a very high degree of precision which reflects the fact that eZitwhile continuous in theory has most of its support in 0 or 1.
We therefore discretize the variable since it does not result in much informa-tion loss and it allows us to use the more transparent event-study approach that will be described in Section4.
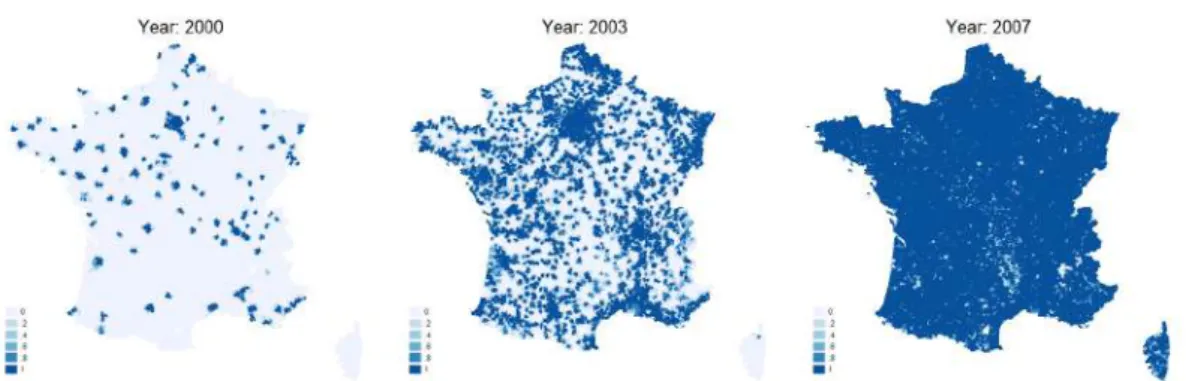
Geographical description of broadband expansion. Figure2shows the roll-out for all of France. FigureOA.2 in the Online Appendix focuses on a specific re-gion (Occitanie) in order to provide a sense of the large variation in treatment
Figure 1: Distribution of eZit: 1999-2007 0 .1 .2 .3 .4 .5 Fraction 0 .2 .4 .6 .8 1
% of city area with DSL coverage [0,1] (weighted by fraction of year covered)
NOTES: This figure plots the distribution of the continuous measure of local broadband availability (variable eZ) as de-fined in Equation (1). We see that while the measure is continuous and contained between 0 and 1 but presents point of accumulation on 0 and 1.
status over time at very fine-grained geographical level. The dark areas represent a large degree of coverage (a high eZit). In 2000, those are confined to the few
major cities of France, surrounded by a large majority of no-ADSL territories. By 2003, the treatment has largely spread to lower scale-municipalities, although large parts of France remain dependent on the old technology. The national terri-tory is essentially “hole-free” in 2007, when almost all LEs have been dealt with. Our empirical approach will take account of the fact that all cities are eventually treated in our setup.
Figure 2: The progressive roll-out of the DSL technology in France – eZ
NOTES: This figure presents the geographical distribution of the continuous measure of local broadband availability (variable eZ) as defined in Equation (1).
3.2.2 Trade and employment data
(i) Firm-level trade data. The data on firm-level trade is produced by the cus-toms office, and compiles the exported values and quantities for each firm-destination-product combination over the period considered (1997-2007).
(ii) Firm-level employment and location data.The administrative dataset DADS (D´eclarations Annuelles de Donn´ees Sociales) comes from firms’ social se-curity records. For the period 1997-2007 and for every establishment with at least one employee, it provides the number of workers, the overall wage bill and the city of location. This is an establishment-level dataset where a firm can have several establishments.
(iii) City-level covariates.Several covariates (population, share of college-educated workers, labor force) come from the 1999 census files aggregated at the city level and directly provided by the French statistical institute (INSEE) on its website. Additional covariates (number of households and overall tax in-come) come from tax authorities’ files aggregated at the city level (Fichier communal de l’imp ˆot sur le revenu).
3.2.3 Balance-sheet data
We use a firm-level balance sheet dataset from France. The firm-level account-ing information is obtained from the BRN (“B´en´efices R´eels Normaux”) dataset which contains the balance sheet and income statement of all firms operating un-der the standard corporate income tax regime. The BRN dataset gathers informa-tion on about than 600,000 French firms every year. This dataset has been used in several trade-related papers dealing with French data (e.g. Eaton et al., 2011; Mayer et al.,2014). We use this dataset to compute firm-level performance mea-sures (sales, value-added) as well as the relative importance of imports (imports-over-sales ratio). These measures will be particularly useful when linking our empirical results to the conceptual framework.
3.2.4 Construction of the estimating sample
We assemble those different data sources to construct a final city-level estimating sample. We start with the administrative dataset DADS to keep in our working sample only mono-city and mono-establishment firms. This is done in order to precisely identify the impact of broadband internet availability on trade outcomes (we want our treatment and outcomes to be at the same micro level). Indeed,
while broadband internet expansion may occur at different moment for a same firm which owns several establishments in several cities, we only observe aggre-gate trade at the firm-level (the firm headquarter) and not at the establishment-level. Keeping only mono-establishment or mono-city firms addresses this poten-tial measurement issue. Table1presents descriptive statistics at the city-level for our estimating sample. The average city hosts about 65 firms, 20% of which on average belong to the manufacturing sector. Imports are positive for about 50% of observations. The ratio of imports to overall sales (weighted by sales) is equal to 5% on average. Its distribution is highly skewed. Individual cities represent on average a small percentage of sales of overall sales (0.42%). This provides indirect support to the notion that broadband expansion of any given city is unlikely on average to have a major competitive impact on firms located in other cities.
Table 1: Descriptive statistics at the city-level: 1997-2007
Mean p25 p50 p75 p95
Nb. firm (by city) 65 7 14 37 194
Sh. of mfg. firms 0.2 0.0 0.1 0.4 0,8 Import share (wrt. sales) 0,05 0.0 0.0 0.04 0.22 Sales as % of departement sales 0.42% 0.01% 0.04% 0.17% 1.62%
NOTES: This table presents some descriptive statistics at the city-level on our estimating
sample for 26,372 cities over the 1997-2007 period (245,511 obs.). The share of import-ing cities is the mean of a dummy equal to one if at least one firm was an importer on year t in city i, and zero otherwise. The import share is the city-level ratio of the value of imports over sales
We compute the value of imports, the quantity of imports, the number of im-porting flows and the number of different products imported for mono-city firms aggregated at the city-level and for several geographic areas and products cat-egories (as defined by the BEC). We merge this trade database with broadband internet data. We then aggregate firm-level balance sheet data from the BRN at the city-level and merge this additional information with our main database – we restrict the BRN sample to single-city firms present in the DADS. Finally, we use firm-level employment and location data, data on population, share of college educated workers, labor force from the 1999 census files as well as number of fiscal households and overall fiscal income from fiscal files aggregated at the city level to construct a large fiscal and demographic control database that we merge with our trade working sample. We keep cities that do not undergo a change in geography over the period.
4
Empirical approach
As mentioned earlier, our empirical setting does not fit the standard difference-in-differences setting because all units are ultimately treated, i.e. connected to broadband internet over the period we consider. We therefore exploit variation in the timing of treatment which was staggered over time.
4.1
Baseline specification
In light of the issues associated with the static two way fixed-effects in the stag-gered treatment setting (Goodman-Bacon,2018;Borusyak and Jaravel, 2017), we estimate a dynamic specification where we allow the effect on a city i / year t, to vary with time-from-treatment. The year of treatment for each city is denoted ti0. We index time-to-treatment with d (negative before treatment, negative after).
Our sample covers the years 1997 to 2007, and we restrict the set of observations to the ones where d ∈ {−6, +5}. The main estimating equation is as follows:
Yit = d=5 X d=−5 d6=−1 βd×1{t = d + t0i} + x0itδ + αi+ ψr(i),t+ εit, (2)
where αi and ψr(i),t are fixed effects for the city and for the d´epartement (of the
city)-year, and x0
itis a vector of time-dependent city-level covariates. We drop two
indicator variables for d = −6 and d = −1. That restriction is necessary to avoid multi-collinearity and to identify the fully-dynamic underlying data generating process in the staggered design (Gross et al., 2018; Borusyak and Jaravel, 2017). To ensure that this restriction is not driving our results, we display results with alternative normalizations in the robustness section.14
The specification presented in equation (2) includes leads and lags. The inclu-sion of leads allows us to assess the presence of pre-trends. However, in order to maximize efficiency, we also include a semi-dynamic specification where only the lags of the treatment are included, as presented in equation (3):
Yit = d=5
X
d=0
βd×1{t = d + t0i} + x0itδ + αi+ ψr(i),t+ εit. (3)
14We assess the sensitivity of our results to binning the coefficients associated with period 6 to
-4 together, meaning to constraint them to be equal as in (Schmidheiny and Siegloch,2019). Finally,
This empirical model enables us to assess the dynamics of the treatment effect in the short and medium run (up to five periods after the expansion).
Interpretation. The event-study coefficients bβdin equation (2) can be interpreted
causally under the identifying assumption that, conditional on receiving broad-band over the period considered and conditional on city fixed-effects, the timing of broadband roll-out is unrelated to the outcome. The specification in equa-tion (2) allows us to examine patterns in outcomes in the years leading up to the broadband expansion.
The identifying assumption that there is no systematic local factor driving both broadband and the trade outcome variables is extensively investigated by includ-ing flexible controls for shocks at the city level and assess the sensitivity of the coefficients.
4.2
Validation of the research design
Explaining broadband expansion. Our identification strategy hinges on the as-sumption that the coverage of cities is mostly determined by city population den-sity – which is mostly fixed over time – and did not take into account underlying trends in trading / importing activities. As a result, conditional on city and year fixed-effects, we consider the variation in broadband access to be as good as ran-dom. In order to assess the validity of this assumption, we explore the extent to which broadband coverage over time is predicted by different types of lagged city-level covariates. We group explanatory variables into several groups:
1. Density: population in 1999 per square km (log), interacted with a full set of year dummy variables.
2. Industry dynamics: shares of employment in 10 economic sector at t − 1 as well as changes in shares between t − 1 and t − 2.
3. Trade: asinh(number of transactions), asinh(value of imports) in t−1, changes in these two variables between t − 1 and t − 2.15
We estimate the following specification: ˜ Zit =dens 0 itρ1+indyn 0 itρ2+trade 0 itρ3+FEi+FEr(i),t + εit, (4)
15The asinh function is close to the logarithm function and allows us to include city with 0 trade
where ˜Zit is the time-weighed share of city i that is covered by broadband
inter-net as described in Equation (1). As we are mostly interested in the explanatory power of these different groups of observable variables we only report the R-square of different sets of regressions. Individual coefficients are presented in the appendix.
Regression results. We start by regressing broadband internet coverage on all three sets of observable covariates without including any time or city fixed-effect. As indicated in Column (1) of Table 2, we obtain a R-square of 56% indicating that these variables capture a substantial share of the variation in treatment sta-tus. Column (2) presents the R-square of two-way fixed-effect model including city and province × year fixed effects. This model absorbs 78.6% of the variance in treatment intensity. Column (3) presents the same model to which is added the 1999 measure of density interacted with year dummies. The fit of the model increase by 2.6 pp. Interestingly, the set of industry dynamic or trade variables barely increase the fit of the model (columns 4 and 5), indicating that conditional on city and province-year fixed effect, they are roughly unrelated to the timing of internet coverage. We consider the low predictive power of observable variables as supporting our identification strategy, as a large share of the variation in tim-ing of the broadband expansion seems to be idiosyncratic in nature.16
Table 2: Explaining city broadband coverage: panel analysis
(1) (2) (3) (4) (5) (6)
Covariates Twoway FE (2)+density (2)+indus. (2)+trade. (2)+ all cova.
R2 0.563 0.786 0.812 0.786 0.786 0.812
NOTES: This table presents the R-square of panel regressions following equation (4). Twoway FE (Column 2) refers to a twoway fixed-effect model with city fixed effect and d´epartement × year FEs. Density (Column 3) includes 1999 population density at the city level defined as #. of inhabi-tant divided by city area interacted with year indicators. Industrial structure controls (Column 4) include the lagged share and their changes of sectoral shares (nine sectors). Trade controls include the lagged log of trade value and number of flows (levels and changes). Column (1) includes all of the controls without fixed effects. Individual coefficients are reported in TableA5of the Appendix.
Our baseline specification will allow for differential (linear and quadratic) trends in outcomes based on initial density. We will further assess the sensitivity of coefficients to the inclusion of observables and show that results are little af-fected by their inclusion. Naturally, this test does not imply that unobservables are not biasing our estimated coefficients. However for this to be the case, these
16Full regression results are displayed in Table A5. Trade and industry lagged level and
unobservables should be time-varying, correlated with the timing of broadband expansion and yet uncorrelated to the rich set of observable variables included whose inclusion we show does not affect our estimated coefficients. While this remains a possibility we cannot completely rule out, given the battery of robust-ness tests we provide, we view it as very unlikely.
5
Baseline Results
The main variable we consider is the value of imports (in logs) by a given city. We show the results for different specifications and assess the robustness of the results. We then turn to different margins of trade (extensive and sub-extensive margins).
5.1
Value of imports
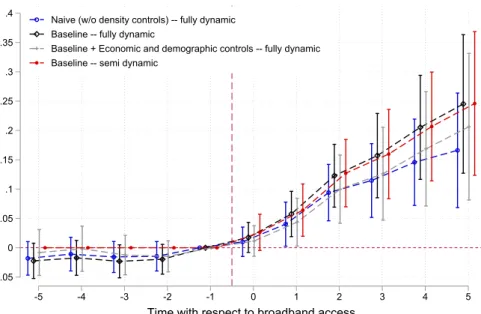
Figure 3: Main specification: Log of the value of imports
-.05 0 .05 .1 .15 .2 .25 .3 .35 .4 -5 -4 -3 -2 -1 0 1 2 3 4 5
Time with respect to broadband access
Naive (w/o density controls) -- fully dynamic Baseline -- fully dynamic
Baseline + Economic and demographic controls -- fully dynamic Baseline -- semi dynamic
NOTES: This figure plots estimates for specification in equation (2– fully dynamic) and (3– semi dynamic). The sample in-clude all cities with a positive trade flow (import).Density inin-clude 1999 population density at the city level defined as # of inhabitant divided by city area interacted with quadratic and linear trends. Other controls include: (i) 1999 share of college educated workers interacted with year-dummies, (ii) the lagged share and their lagged changes of sectoral shares (nine sectors), (iii) lagged (log of) number of fiscal households and the average fiscal income (iv) 1999 education level interacted with year dummies (Share of dropouts). 95 % confidence interval are presented. Standard errors clustered at the province (d´epartement) level. Full estimation results are reported in TableA1.
Figure3displays the main results of our paper, plotting estimated coefficients from Equation (2) (full results are presented in Appendix Table A1). The blue
dashed line (with hollow circles) report results from a “naive” specification omit-ting controls except for the city and d´epartement-year fixed-effects. Estimates exhibit a flat trend before the event (i.e. the normalizing measure of time since access d = −1) and a break in the trend after that. The coefficient for d = 5 in that specification is 0.162 suggesting that the expansion of access to broadband inter-net increased the overall value of city-level import by about 16%, 5 years after the period of largest expansion (see column 2 of TableA1).
Given the relevance of density in the decision-making process leading to broad-band expansion, our baseline specification adds linear and quadratic population density trends to the regression. The black line (with diamonds) shows our esti-mates. Here again, we see no sign of a pre-trend prior to broadband expansion opposed to a steady growth afterwards. The estimated effect after five years is substantially larger than in the naive case, with a coefficient of 0.25.
The coefficients displayed with a light gray dashed line come from a third regression where controls for dynamics in sectoral composition, population and income (levels and dynamics) as well as initial educational level (share of college-educated) interacted with times dummies are included. Results are remarkably stable to this inclusion and are very close to the specification including only den-sity controls. The estimated lead coefficients appear equally supportive of the absence of pre-trends. Finally, the last set of coefficients plotted in red represent a semi-dynamic version of the baseline specification. The regression should in theory more efficiently estimated –as the number of parameters to be estimated is lower–, however the standard errors turn out to be very close to the fully dy-namic specification in practice.
We see that the estimated effects (independently of the chosen specification) are growing with time since broadband internet expansion in a roughly linear fashion. The effects grow in magnitude as time passes which suggests that they are structural and might affect the path of Note that the time period included in our analysis ends in 2007. This choice is dictated by the advent of the financial cri-sis which has a major negative impact on global trade (Baldwin,2009) and would add noise to the estimation.17 Unfortunately it limits our ability to investigate the
longer run effect of broadband expansion and whether it levels-off after a given
17It is standard for studies of empirical studies of international trade to exclude the great
re-cession from their time window, see for instanceAutor et al.(2013)’s seminal study of the China
period of exposure.18
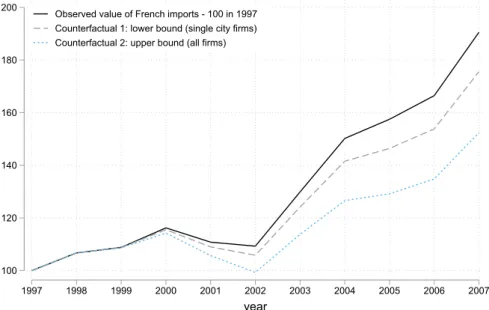
Magnitude of the effect. In order to give insights about the quantitative im-plications of our findings, we construct counterfactual aggregate imports absent broadband expansion. The counterfactual outcome is measured as the actual out-come minus the predicted effect of broadband availability on the outout-come, taking into account the dynamics of the effects as captured by our semi-dynamic speci-fication.
More specifically, we compute an average effect of broadband internet expan-sion for each year effect as bt =
P2007 t0=1999w y t0,t0βbt−t0 where w y t0,t0 represents the
national trade share for outcome y measured in t0for firms located in cities where broadband became available at year t0. Let us denote the vector of total French
imports over time as yt. We postulate that the observed trade flow is given by a
baseline level yt(0)that would have occurred in the absence of broadband
diffu-sion multiplied by the predicted effect: yt = exp(bt)yt(0). We obtain the
counter-factual series by inverting this relationship: yt(0) = exp(−bt)yt.
We present two sets of counterfactual time-series in imports which corre-sponds to two different sets of weights w. The first is obtained by computing the weight for our estimating sample, which contains single-city firm only. The weights therefore do not sum to 1 for any given year but instead sum to the share of single-city firms in national imports.
The second approach normalizes the shares just mentioned so that they sum to 1.19 Applying the first set of weights implicitly assumes that multi-city firms were not affected by broadband expansion in their importing behavior, while ap-plying the second set is equivalent to assuming that they reacted in the same way as single-city firms. Therefore we see the first counterfactual as a lower bound while the second is more likely to be an upper bound. Indeed, to the extent that multi-city firms are larger and might be able to invest in technology and commer-cial networks that decrease their reliance on broadband technology to engage in international trade, the impact of broadband internet on their importing behavior is probably lower than the same effect for smaller, single-city firms.
The results are displayed in Figure4. The lower bound result suggests that the increase in the real value of French imports, which was 91% over the 1997-2007
18Note however that documenting an effect at a 5-year horizon in a event-study setting is rather
on the upper bound of what is found in the literature. For instance, the seminal study by (Autor,
2003) bins effects 4 years or more after treatment.
19Formally, we define this second set of weights as :
e wt0,t= ( P t0w y t0,t) −1× w t0,t.
period, would have been 15 p.p. lower without broadband expansion. The upper bound results suggests they would have been 37 p.p. lower.
Figure 4: Counterfactual aggregate trends in overall import
100 120 140 160 180 200 1997 1998 1999 2000 2001 2002 2003 2004 2005 2006 2007 year
Observed value of French imports - 100 in 1997 Counterfactual 1: lower bound (single city firms) Counterfactual 2: upper bound (all firms)
NOTES: The actual trade flows (black line) is the value of imports of goods in France in 2000 dollar normalized to 100 in 1997. Counterfactual 1 is obtained by subtracting the predicted effect of broadband internet where the average predicted effect is computed by using a weighted average of the estimated βd, for d ≥ 0 where the weights correspond to the share in
na-tional imports of each cohort of single-city firm (i.e. all single-city firms for which broadband expansion occurs the same year) measured the year of broadband expansion. The weights therefore do not sum to one and reflect the empirical impor-tance of the estimating sample. Counterfactual 2 is obtained by doing the same calculation, but normalizing the previous weights so that they sum to one, thereby extrapolating the estimated effects outside of estimating sample onto all potential importer. See Magnitude of the effect: for more details.
Accounting for zero-flows.Our results so far do not include observations where the log of imports are not defined because imports are null. As such, there might be an extensive margin at the city-level that we are missing. A simple way to accommodate observations where city-level imports are null is to resort to the asinh(import) on a balanced sample of cities.20 Ashin() is defined as :
asinh(z) = ln(z +√1 + z2).21 The results are displayed in Table A2 of the
Ap-pendix. Coefficients are larger (0.38 for d = 5 instead of 0.25 for the baseline specification), suggesting a role for an extensive margin at the city-level. We will therefore investigate in more details the margisn of adjustment underpinning the overall positive effect of broadband expansion on imports in a dedicated section.
20For instanceHjort and Poulsen(2018) use this transformation when studying how individual
hours worked are affected by the arrival of fast Internet.
5.2
Further Robustness checks
Local labor market dynamics. We saw above that including controls on sectoral employment dynamics leaves the results virtually unaffected. It could be how-ever that our proxies do not fully capture local labor market shocks. In order to gauge the sensitivity of our results to the type of controls included, we control non-parametrically for any development at the local labor market level by includ-ing commutinclud-ing-zone × year fixed effects. Commutinclud-ing zone are defined based on a criterion of self-contained commuting and are the usual unit to study local labor markets in France. The estimated effects are displayed in Column 5 of TableA1
and are extremely close to the previous ones.
Alternative normalization. In the main analysis we normalize β−6 and β−1 to
0. Here, we experiment with a different normalization: instead of assuming β−6 = 0, we bin the coefficients associated with d ≤ −4 together, that is we
assume β−6 = β−5 = β−4. Results are displayed in TableA3. Again, focusing
on column 3 (density controls only), the estimated effect is very close to the one obtained previously (0.28 versus 0.25). Overall, results do not appear sensitive to the choice of normalization.
Placebo inference. Bertrand et al. (2004) show that serial correlation can bias inference in difference-in-differences studies leading to serious over-rejection of the null hypothesis. We take this issue into account in our main analysis by con-structing standard error that are clustered at the level of the d´epartement. These standard errors should lead to unbiased inference even in the presence of serial correlation within cities as well as cross-sectional dependence in the error term across cities within d´epartement.
In order to validate the inference provided by our clustered standard errors (which are only valid asymptotically) we implement Chetty et al. (2009)’s non-parametric permutation test of βd = 0 for d = 1, 2, 3, 4, 5. To do so, we
ran-domly reallocate the date of broadband expansion across cities, within the same d´epartement, and proceed to estimate equation (2). We repeat this process 2000 times and build an empirical CDF for bβd which we denote bF (). If broadband
expansion has a truly significant positive effect on the dependent variable, here log of import values, one would expect the estimated coefficient to be in the very upper tail of the estimated empirical CDF based on permutations.
Denoting bβ5M the point estimate obtained in Figure 3 based on the log value of imports, we get 1 − bF ( bβ5M) = .0005. Results are presented in Figure5. This
p-Figure 5: Distribution of Placebo Estimates: Log Imports, β5 0 .2 .4 .6 .8 1 Empirical CDF of β5 -0.19 -0.14 -0.09 -0.04 0.01 0.06 0.11 0.16 0.21 0.250.26 0.31
Value of estimated placebo β5
NOTES: This figure plots the empirical cumulative distribution function of placebo estimated effects broadband on log im-ports, where date of broadband expansion is randomly reallocated across cities within the same d´epartement (unit of clus-ter). Draws are with replacement and may include the correct date of treatment. The CDF is constructed from 2000 esti-mates of β5using the specification in equation (2) without observable controls. The solid line (in red) corresponds to the
actual estimate of the matching specification. It lies outside of the 95% confidence interval that is delineated by the dashed lines (in blue).
value is smaller than the one using the t-statistics based on asymptotically-valid clustered standard errors (0.001) and confirm that the broadband internet led to an abnormally large increase in the value of imports.22
Restricting the sample period in order to obtain a proper control group. We check that using the continuous treatment measure in a simple fixed effect model over the period 1997-2004 leads to qualitatively comparable results. The restric-tion of this subsample period allows to consider cities that were never treated and therefore implement a classical difference-in-differences estimation. As expected, point estimates are smaller since they measure a shorter-run effect but they are positive and significant at conventional levels of confidence (see TableA4in the appendix).
22The same holds for β
5.3
Intensive, extensive and sub-extensive margins
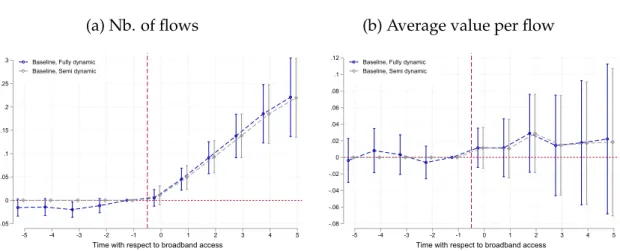
We have at this stage established a strong effect of broadband internet on the value of imports at the city level. This pattern could be consistent with an increase in the number of importing flows, defined as a firm-origin country-product com-bination, an increase in the average value per flow or any combination of both.
Figure6show the results on both outcomes for the baseline specification. It is clear from those results that the average value per flow is virtually unaffected and that the effect on overall value is entirely driven by the increase in the number of flows.
Figure 6: Number of flows and average value per flow
(a) Nb. of flows -.05 0 .05 .1 .15 .2 .25 .3 -5 -4 -3 -2 -1 0 1 2 3 4 5
Time with respect to broadband access Baseline, Fully dynamic
Baseline, Semi dynamic
(b) Average value per flow
-.08 -.06 -.04 -.02 0 .02 .04 .06 .08 .1 .12 -5 -4 -3 -2 -1 0 1 2 3 4 5
Time with respect to broadband access Baseline, Fully dynamic
Baseline, Semi dynamic
NOTES: This figure plots estimates for specification in equation (2– fully dynamic) and (3– semi dynamic). Baseline include 1999 population density at the city level defined as # of inhabitant divided by city area interacted with quadratic and linear trends. 95 % confidence interval are presented. Standard errors clustered at the d´epartement level. The sample include all cities with a positive trade flow (import).
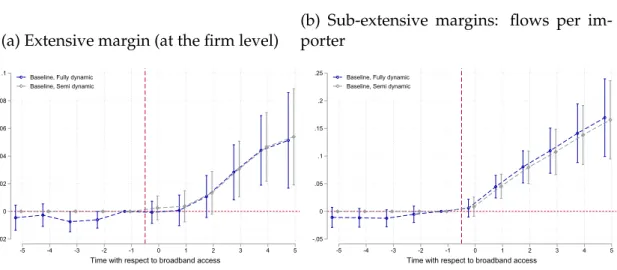
The increase in the number of flows could in turn reflect either an increase in the number of importing firms or a rise in the number of importing flows per firm. We show that the first impact (extensive margin at the firm-level) is small in magnitude (about 6%) albeit significant (see Figure7). This implies that the sec-ond effect dominates: the “sub-extensive margin” (Gopinath and Neiman, 2014) explains most of the causal impact of broadband internet on the value of imports. Our findings therefore support the notion that broadband internet caused an increase in import value, mostly by leading firms that were already importing to import more goods and from a wider array of origin countries while keep-ing the amount per flow roughly unaffected. This findkeep-ing suggests that fixed costs play an important role in sourcing strategies (as inAntras et al., 2017) and also that broadband internet help to decrease such costs. The value per flow
be-Figure 7: Extensive and sub-extensive margins
(a) Extensive margin (at the firm level)
-.02 0 .02 .04 .06 .08 .1 -5 -4 -3 -2 -1 0 1 2 3 4 5
Time with respect to broadband access Baseline, Fully dynamic
Baseline, Semi dynamic
(b) Sub-extensive margins: flows per im-porter -.05 0 .05 .1 .15 .2 .25 -5 -4 -3 -2 -1 0 1 2 3 4 5
Time with respect to broadband access Baseline, Fully dynamic
Baseline, Semi dynamic
NOTES: This figure plots estimates for specification in equation (2– fully dynamic) and (3– semi dynamic). Baseline include 1999 population density at the city level defined as # of inhabitant divided by city area interacted with quadratic and linear trends. 95 % confidence interval are presented. Standard errors clustered at the d´epartement level. The sample include all cities with a positive trade flow (import).
ing unaffected, the increase in the amount spent on imports is roughly equal to the increase in the number of varieties imported – if one defines a variety as the unique combination of a product and a sourcing country as generally done in the literature (Broda and Weinstein,2006).
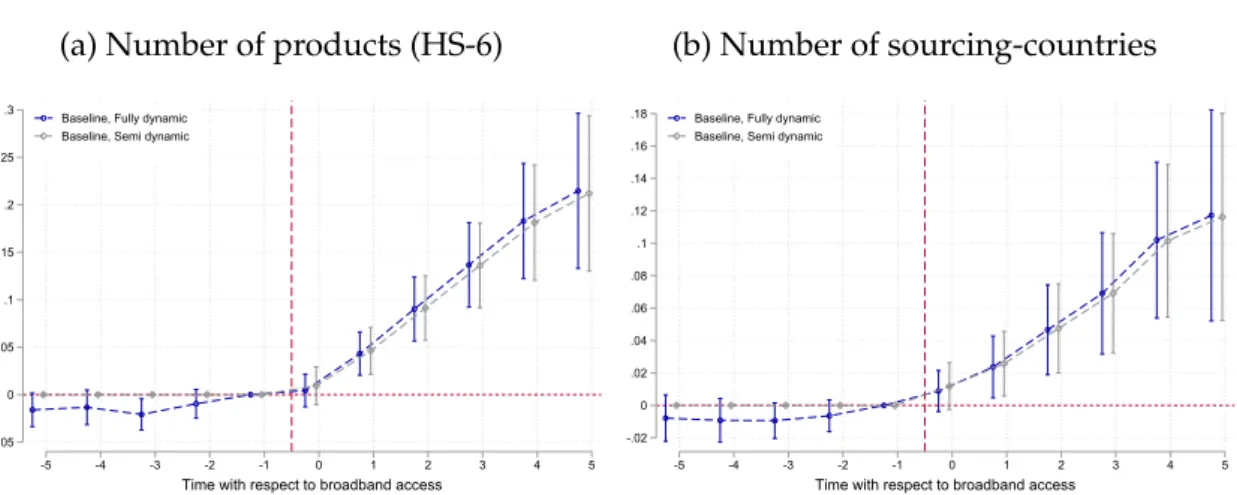
Disentangling the rise in the number of products from the increase in the num-ber of origin countries in the change in the total numnum-ber of flows, Figure8shows that both margins appear relevant.
Figure 8: Number of products (HS-6) and sourcing countries
(a) Number of products (HS-6)
-.05 0 .05 .1 .15 .2 .25 .3 -5 -4 -3 -2 -1 0 1 2 3 4 5
Time with respect to broadband access Baseline, Fully dynamic
Baseline, Semi dynamic
(b) Number of sourcing-countries -.02 0 .02 .04 .06 .08 .1 .12 .14 .16 .18 -5 -4 -3 -2 -1 0 1 2 3 4 5
Time with respect to broadband access Baseline, Fully dynamic
Baseline, Semi dynamic
NOTES: This figure plots estimates for specification in equation (2– fully dynamic) and (3– semi dynamic). Baseline include 1999 population density at the city level defined as # of inhabitant divided by city area interacted with quadratic and linear trends. 95 % confidence interval are presented. Standard errors clustered at the d´epartement level. The sample include all cities with a positive trade flow (import).
6
Heterogeneity and further results
In this section, we present further results regarding the heterogeneity of the ef-fects by origin country (subsection6.1) and type of goods (subsection6.2). We then present results on overall firm-level outcomes, namely sales and value-added (subsection 6.3). The latter results will be key inputs in our assessment of the impact of broadband on consumer welfare and the contribution of the import channel in the conceptual framework presented in Section7.
6.1
Origin-country
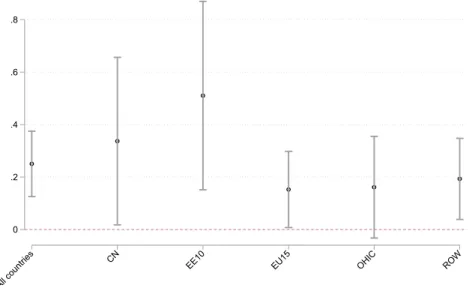
Figure 9 recalls the overall effect on the value of imports after five years and then shows the results for different groups of origin countries. Overall, we fail to detect statistically significant heterogeneity, although point estimates appear larger for imports sourced from China and from Eastern European countries and somewhat smaller for EU-15 as well as other high-income countries and the rest of the world.
Figure 9: bβ5 for different groups of origin-countries 0 .2 .4 .6 .8 All countries CN
EE10 EU15 OHIC ROW
NOTES: This figure plots estimates bβ5from the specification in equation (3– semi dynamic) for different groups of countries.
Density controls. The sample include all cities with a positive trade flow (import).. CN = China, EE10 = Eastern European countries that joined the EU in 2004. OHIC other high income countries. ROW = rest of the world.
6.2
Type of goods: capital, intermediary and consumption
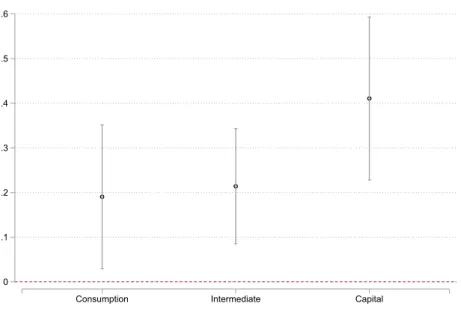
Figure10shows the overall effect on the value of imports classified in three differ-ent types of goods based on the BEC classification: capital goods, consumption goods and intermediary inputs. Those results display some heterogeneity be-tween types of goods: the value of imports of capital goods are strongly impacted while we find a smaller effect, albeit still positive and significant, for intermediary inputs and consumption goods.
The literature on endogenous growth provides theoretical grounds for the role of foreign technology in enhancing domestic performance, notably through the import of capital goods (Eaton and Kortum,2001). Our results imply that broad-band internet might have boosted firm performance through that channel. To the extent that this channel is at work, one would expect firms sales and value-added to be boosted by broadband internet. We now turn to such measures of firm performance.
Figure 10: Value of imports by type of goods 0 .1 .2 .3 .4 .5 .6
Consumption Intermediate Capital
NOTES: This figure plots estimates (t ≥ 0) for specification in equation (3– semi dynamic) and for goods grouped. Density controls. The sample include all cities with a positive trade flow (import).
6.3
Impact on firm performance and import-intensity
While trade is an important outcome in its own right, it is also interesting to see whether the increased imports of firms is associated with an expansion of overall activity as captured in their sales or value-added. The results, displayed in Figure
11, show increases by 5% in sales and 6% in value-added.
Beyond the scale of economic activity, access to a broader range of inputs have been documented to increase productivity (Amiti and Konings, 2007; Topalova and Khandelwal, 2011). As most of the evidence focuses on the manufacturing sector (e.g.Halpern et al.,2015;Blaum et al.,2018) we split the analysis of produc-tivity (value added per worker here) between the manufacturing and the non-manufacturing sectors. Results in Figure12shows a positive effect of broadband expansion on the productivity of the manufacturing sector, but essentially no im-pact outside of the manufacturing sector where value-added and employment grew in the same proportions. The positive impact on firms’ scale with no effect on the apparent productivity of labor in the non-manufacturing sector is con-sistent with previous work for the UK provided byDeStefano et al. (2018) who find a positive average treatment effect of ICT instrumented by local broadband
Figure 11: Sales and value-added (a) Sales -.02 0 .02 .04 .06 .08 .1 -5 -4 -3 -2 -1 0 1 2 3 4 5
Time with respect to broadband access Baseline, Fully dynamic
Baseline, Semi dynamic
(b) Value-added -.02 0 .02 .04 .06 .08 .1 .12 -5 -4 -3 -2 -1 0 1 2 3 4 5
Time with respect to broadband access Baseline, Fully dynamic
Baseline, Semi dynamic
NOTES: This figure plots estimates for specification in equation (2– fully dynamic) and (3– semi dynamic). Baseline include 1999 population density at the city level defined as # of inhabitant divided by city area interacted with quadratic and linear trends. 95 % confidence interval are presented. Standard errors clustered at the d´epartement level. The sample include all cities with a positive trade flow (import).
availability on firm’s revenue and employment but not on different measures of productivity.23
Figure 12: Value-added per worker
(a) Manufacturing sector
-.02 -.01 0 .01 .02 .03 .04 .05 .06 .07 .08 -5 -4 -3 -2 -1 0 1 2 3 4 5
Time with respect to broadband access
Baseline, Fully dynamic Baseline, Semi dynamic
(b) Non manufacturing sector
-.025 -.02 -.015 -.01 -.005 0 .005 .01 .015 .02 -5 -4 -3 -2 -1 0 1 2 3 4 5
Time with respect to broadband access
Baseline, Fully dynamic Baseline, Semi dynamic
NOTES: This figure plots estimates for specification in equation (2– fully dynamic) and (3– semi dynamic). Baseline include 1999 population density at the city level defined as # of inhabitant divided by city area interacted with quadratic and linear trends. 95 % confidence interval are presented. Standard errors clustered at the d´epartement level. The sample include all cities with a positive trade flow (import).
In the next section, we develop a conceptual framework where we can use our estimates to quantify (1) the overall effect of broadband internet on consumer
welfare and (2) isolate the contribution of the import channel to this overall effect. In doing so, we will need to know the effect of broadband internet on the imports over sales ratio. The results are presented in panel (a) of Figure 13 below. We obtain a point estimate of 0.15 after five years. In panel (b), we display results for the domestic share of inputs.24
From an empirical standpoint, measuring capital goods in the accounting data is delicate because they are likely to be accounted for as investment rather than as intermediate consumption and there is no distinction between domestic and foreign goods in the accounting data. Excluding capital goods allows us to make sure that the imports as documented in custom data contain goods comparable to intermediate consumption as documented in the accounting data.
We see a negative impact of about -1.25% after five years. This result will play an important role in our welfare assessment below.
Figure 13: Measures of import intensity
(a) Imports over sales
-.05 0 .05 .1 .15 .2 .25 -5 -4 -3 -2 -1 0 1 2 3 4 5
Time with respect to broadband access
Baseline, Fully dynamic Baseline, Semi dynamic
(b) Imports over intermediate consumption
-.025 -.02 -.015 -.01 -.005 0 .005 -5 -4 -3 -2 -1 0 1 2 3 4 5
Time with respect to broadband access
Baseline, Fully dynamic Baseline, Semi dynamic
NOTES: This figure plots estimates for specification in equation (2– fully dynamic) and (3– semi dynamic). Baseline include 1999 population density at the city level defined as # of inhabitant divided by city area interacted with quadratic and linear trends. 95 % confidence interval are presented. Standard errors clustered at the d´epartement level. The sample include all cities with a positive trade flow (import).
24This share is computed as follow: sd
it=
ICit−Mitn
ICit where ICitis the value of overall
interme-diate consumption as reported in the income statement from the corporate tax return data and
Mn
itis the value of imports as reported in the custom data where capital goods are excluded. We
exclude capital goods from the custom data in order to make measurement from the two data sources comparable. Indeed, measuring capital goods in the accounting data is delicate because they are likely to be accounted for as investment rather than as intermediate consumption and there is no distinction between domestic and foreign goods in the accounting data. Excluding capital goods allows us to make sure that the imports as documented in custom data contain goods comparable to intermediate consumption as documented in the accounting data. More-over, our conceptual framework below is static and abstracts away from capital goods.