HAL Id: hal-03054570
https://hal-enpc.archives-ouvertes.fr/hal-03054570
Submitted on 11 Dec 2020
HAL is a multi-disciplinary open access
archive for the deposit and dissemination of
sci-entific research documents, whether they are
pub-lished or not. The documents may come from
teaching and research institutions in France or
abroad, or from public or private research centers.
L’archive ouverte pluridisciplinaire HAL, est
destinée au dépôt et à la diffusion de documents
scientifiques de niveau recherche, publiés ou non,
émanant des établissements d’enseignement et de
recherche français ou étrangers, des laboratoires
publics ou privés.
Waste swelling due to water uptake: Experimental and
model comparisons
G Melot, Patrick Dangla, Sylvie Granet, Sofia M’Jahad, Jean-Baptiste
Champenois, Arnaud Poulesquen
To cite this version:
G Melot, Patrick Dangla, Sylvie Granet, Sofia M’Jahad, Jean-Baptiste Champenois, et al..
Chemo-Hydro-Mechanical analysis of Bituminized Waste swelling due to water uptake:
Experi-mental and model comparisons.
Journal of Nuclear Materials, Elsevier, 2020, 536, pp.152165.
�10.1016/j.jnucmat.2020.152165�. �hal-03054570�
~ 1 ~
Chemo-Hydro-Mechanical analysis of Bituminized Waste swelling due to
water uptake: Experimental and model comparisons.
G. MELOT1,2, P. DANGLA2, S. GRANET1, S. M’JAHAD1, JB. CHAMPENOIS3, A. POULESQUEN3
1: IMSIA, UMR9219, EDF-CNRS-CEA-ENSTA Paris Tech, France
2: Univ Paris-Est Laboratoire Navier (UMR 8205) CNRS, Ecole des Ponts Paris Tech, IFSTTAR, France 3: CEA, DEN, DTCD, SEAD, LCBC, F-30207, Bagnols sur Cèze, France
________________________________________________________________________________________________________________
Highlights
● The water uptake by French Bituminized Waste Product (BWP) is studied to strengthen the demonstration of their acceptability within geological or sub-surface waste disposal.
● Main indicators studied during the leaching are the amount of salt leached, the amount of water absorbed, the swelling and the evolution of the porosity profile.
● The trends in indicators are reproduced by a Chemo-Hydro-Mechanical numerical model.
________________________________________________________________________________________________________________
Abstract
This paper presents a numerical model developed to reproduce the behaviour of French simplified Bituminized Waste Products (BWP) during a leaching test. The model is calibrated on experimental data sets. BWP were mainly produced during industrial reprocessing of nuclear spent fuel and are classified as low or intermediate activity long lived radioactive waste. Geological disposal is the reference solution for intermediate level long-lived BWP. Under geological disposal facility conditions, and after a long period of time, BWP will undergo water re-saturation from the host rock. A chemo-hydro-mechanical numerical model has been implemented with a finite element scheme to model BWP behaviour under such conditions. The constitutive model takes into account the impact of dissolution, permeation, diffusion and osmosis. Original evolution laws of diffusion coefficient and permeability as a function of the porosity are proposed. Specific mechanical model is proposed including Mori-Tanaka homogenisation law. To simulate the hydration of the material, an original and simple method is proposed, avoiding costly two-phase flow resolution and complex calibration of the related parameters. This model was mainly used to reproduce the evolution of the amount of both water absorbed and salt leached by the sample during unconfined water up-taking tests. The calibration is based on experimental data obtained on French simplified BWP containing one highly soluble salt. Water uptake could generate swelling mainly due to osmosis.
Key words: Bituminized Waste Products (BWP) / Chemo-Hydro-Mechanical analysis / Swelling / Diffusion / Osmosis
1 Introduction
Bituminized Waste Products (BWP) have been mainly produced by industrial reprocessing of nuclear spent fuel radioactive waste, and are classified as low or intermediate level and long-lived waste (LLW-LL and ILW-LL). BWP are composed of salt crystals immobilised in a bitumen matrix. These salts are present in co-precipitation sludges produced during the chemical reprocessing of spent nuclear
fuel. They can have normal solubility (e.g. NaNO3) or low
solubility (e.g. BaSO4) in water. BWP used to be produced
in different facilities and in different countries including France, Belgium and Japan. France still produces approximately 10 barrels of BWP per year. The mechanical properties of the bitumen differ from one another. Furthermore, there are various natures and proportions of crystal salts for these different BWP: Belgian BWP contain mainly NaNO3, while French BWP contain more poorly
~ 2 ~ soluble salts [1]. There are two different types of French BWP. One type of French BWP, produced in La Hague in the Effluent Treatments Station n°3, is called STE3. The second type, produced in Marcoule, is called STEL for Liquid Effluent Treatments Station.
According to the French concept, geological disposal is the reference solution for BWP classified as ILW-LL [2]. Under geological disposal conditions, and after a period in the order of magnitude of a hundred thousand years, disposal facility will undergo water re-saturation from the host rock. First, water uptake by the BWP will induce free swelling, leading to the filling of all different types of void existing in the disposal facility (voids within primary canisters, concrete containers and rock vaults). Then water uptake will potentially lead to a swelling pressure under such conditions. While the above phenomena take place, the integrity of the host rock must be guaranteed until the radioactivity of the waste has completely decreased.
Various models have already been developed for water uptake by bituminized waste.
The COLONBO model [1] [2] was developed by the French Alternative Energies and Atomic Energy Commission (CEA). This operational model describes the evolution of the pore structure, the water uptake and the salt and radionuclides release of leached bituminized waste. This model is based on diffusive mechanisms.
A Chemo-Hydro-Mechanical (CHM) model was developed by the UPC (University Polytechnic of Catalunya) [3] [4] [5] [6] [7]. The modelled BWP are called “Eurobitum”, produced in Belgium with a different bitumen and different salt composition than French BWP. This model is based on a classical poromechanical approach considering the mass balance equations for water, dissolved salts, crystallized salts and bituminized solid phase. These equations include osmosis and coupled transport phenomena: diffusion and permeation. The dissolution/precipitation of salts is modelled by an additional equation. Moreover, the mechanical behaviour law takes creep deformations into account. The calibration and the validation of this model were performed using water uptake test results under “semi-confined” (constant stress) and confined conditions (constant volume) [6], [7], [8] and [9]. ‘Eurobitum’ has been experimentally tested.
In the first part of this paper, a simplified model is proposed, considering one single soluble salt. Constitutive equations of this model were derived from the CHM model of UPC. Original evolution laws of diffusion coefficient and permeability as a function of the porosity are proposed. A specific mechanical model is proposed including Mori-Tanaka homogenisation law. To simulate the hydration of the material, a novel and simple method is proposed, avoiding costly two-phase flow resolution and complex calibration of the related parameters. This “simplified” model was first developed to evaluate the influence of each mechanism and coupling. It was implemented in code BIL [10] with a finite element scheme. In this paper we applied
this model to reproduce and understand the behaviour of simplified French BWP containing one soluble salt under unconfined conditions. However, the model is intended to be applicable for hydrating BWP under both confined and unconfined conditions.
The calibration and validation of the numerical model is presented in the second part of this paper. Experimental results were obtained from the current experimental program of CEA research laboratories on water uptake by French BWP [11]. Numerical simulations of free swelling tests due to water uptake have been provided.
2 Governing equations
Bituminized waste can be considered as a very low-permeability material containing one or several different salt crystals. In the present model, it has been chosen to focus only on one kind of soluble salt. A coupled model is required in order to describe consequences of water uptake on such a material. Swelling is one of these consequences and it is governed by two main mechanisms. The first mechanism consists in the solvent (water) transport leading to the dissolution of salt crystals. During dissolution, volume increases, leading to global swelling of the bitumen matrix. The second mechanism is the osmotic flow which leads directly to a water overpressure in the pore due to the chemical gradient (the salt concentration gradient). The bitumen matrix acts as a semi-permeable membrane allowing for an increase of the pore water pressure in the bituminized waste (osmotic overpressure). When the water uptake takes place in unconfined conditions then the osmotic mechanism does not lead to an increase in pressure but to a swelling of the sample. The chemical part of this model deals with the precipitation/dissolution of salt crystals present in the bitumen matrix. It is the main driving force for the water uptake, leading to salt saturation in the pore water and to an increase of the porosity. The porosity then allows advective and diffusive transport of water and salt through the bitumen matrix. The semi-permeable membrane effect, the permeability and the diffusion are linked to the porosity increase. Finally, the mechanical behaviour is strongly dominated by creep-deformation.
The following assumptions were made:
● One soluble salt is considered (NaNO3)
● Gravity is neglected
● The medium is water saturated
Only one salt is considered in the theoretical model. In order to be conservative, the soluble salt with the highest solubility is considered and insoluble salts are associated with the bituminous matrix.
The hydration phase is taken into account by an independent calculation (cf. section 4).
The medium is composed of four species as proposed in the CHM model ([3] to [7]). Corresponding subscripts are indicated below:
~ 3 ~ ● Water (w)
● Salt as solute in liquid phase (s) ● Salt as crystal (c)
● Bitumen porous matrix
2.1 Notion of Eulerian and Lagrangian porosity
In the context of water uptake by BWP, the swelling of the material goes beyond the framework of small deformations. Lagrangian or Eulerian porosity must therefore be used adequately.
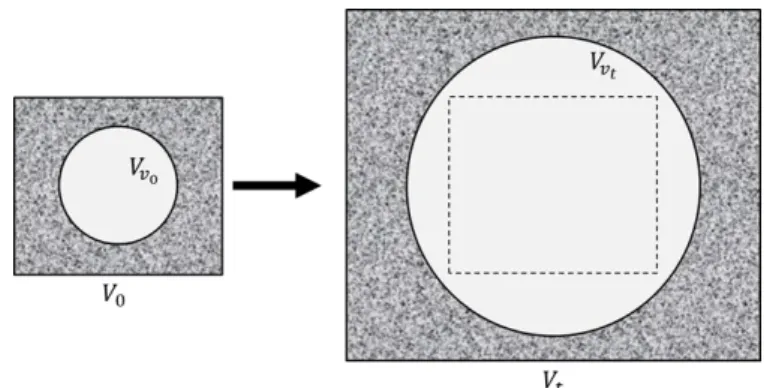
The following definition is based on the classical definition of Eulerian and Lagrangian porosities in poromechanics [12]. Considering an amount of material that occupies a reference volume denoted 𝑉0, and called initial volume, let us note 𝑉𝑡 the volume occupied by this quantity of matter at time t after deformations and 𝑉𝑣𝑡 the volume of pores at time t (cf. Figure 1).
The Lagrangian porosity refers to an initial state of the material and characterizes the change in pore volume due to the process of deformation. The Eulerian porosity does not refer to an initial state of the material and characterizes the pore volume fraction of the material in its current state. In the following, the Lagrangian porosity is denote𝑑 𝜙𝑙 and the Eulerian porosity is denoted𝑑 𝑛𝑙.
We define: 𝑛𝑙= 𝑉𝑣 𝑉𝑡 ; 𝜙𝑙= 𝑉𝑣 𝑉0 ; 𝜙𝑙𝑉0= 𝑛𝑙𝑉𝑡; 𝜙𝑙= 𝐽𝑛𝑙 (1)
With 𝑉𝑣 the pores volume and 𝐽 = 𝑑𝑒𝑡 𝐹 the Jacobian of the deformation between the current and the initial state.
Figure 1 - Illustration schematically showing the volume of a material and the pore volume contained in the material in an initial condition (index 0) and in a deformed state (index t).
As long as the deformations are sufficiently small, the difference between the two definitions of the porosity is negligible. However, differences becomes significant for large deformations.
The mass balance equations require the actual amount of materials, and the Lagrangian porosity 𝜙𝑙 linked to initial volume must therefore be used. However, some quantities are linked to the ratio between the volume of the voids and
the total volume of the material at the same instant. In this case, it is necessary to use the Eulerian definition of the porosity, noted 𝑛𝑙. This occurs typically in the evolution laws of the transport parameters.
2.2 Constitutive model
The model is based on the mass balance equations for the water and for the salt:
𝜕
𝜕𝑡((1 − 𝜔𝑠) 𝜌𝑙 𝜙𝑙) + 𝛻. 𝑊𝑤= 0 (2) 𝜕
𝜕𝑡(𝜔𝑠 𝜌𝑙 𝜙𝑙+ 𝜌𝑐𝜙𝑐) + 𝛻. 𝑊𝑠= 0 (3) Where 𝜔𝑠 is the mass fraction of solute in the liquid phase, 𝜌𝑙 denotes the liquid density, 𝜙𝑙 the Lagrangian porosity, 𝑊𝑤 the mass flux of water, 𝜌𝑐 the crystal density, 𝜙𝑐 the volume fraction of salt crystal and 𝑊𝑠 the mass flux of solute. In order to simplify equation (2), the mass balance equation for the water and the salt was used instead of the mass balance equation for the water only:
𝜕
𝜕𝑡( 𝜌𝑙 𝜙𝑙+ 𝜌𝑐𝜙𝑐) + 𝛻. 𝑊𝑙= 0 (4) Where 𝑊𝑙 is the mass flux of the liquid phase.
During leaching, the solute concentration of the solution in contact with the salt crystals will vary. The dissolution/precipitation law used in the numerical model [4] is presented below: 𝑑𝜙𝑐 𝑑𝑡 𝜌𝑐= 𝑑𝑚 𝑑𝑡 = 𝜙𝑐𝜎𝑐 𝛽 [( 𝜔𝑠 (𝜔𝑠)𝑠𝑎𝑡 ) − 1] (5)
Where 𝑚 is the mass of salt crystals per unit volume, 𝜎𝑐 the specific surface, 𝛽 the dissolution rate constant and (𝜔𝑠)𝑠𝑎𝑡 the mass fraction of solute in the liquid phase at saturation. The porosity in the BWP varies during the water uptake due to two mechanisms: the dissolution of the salt crystals and the swelling due to overpressure in the pore space, notably due to osmosis. The evolution of the porosity is ruled by the following expression:
𝜙𝑙= 𝜙𝑙𝑖+ 𝑏 𝑇𝑟(𝜀) − (𝜙𝑐− 𝜙𝑐𝑖) (6) Where 𝑏 is the Biot coefficient and 𝜀 the strain tensor. Water and solute fluxes are built from permeation, osmosis and diffusion mechanisms. Each of these three flows are described in the following section.
The Darcy law is used to describe liquid flux through the porous bitumen matrix due to pressure gradient.
𝑊𝑑𝑎𝑟𝑐𝑦= −𝜌𝑙 𝑘
𝜇𝛻𝑝 (7)
Where 𝑊𝑑𝑎𝑟𝑐𝑦 is the Darcean mass flux, k the permeability, 𝜇 the dynamic viscosity of the water and p the pore pressure.
~ 4 ~ The bitumen matrix plays the role of a semi-permeable membrane. A chemical gradient in such material induces an osmotic gradient of pressure:
𝛻 (𝑅𝑇 𝑀𝑠
𝜌𝑙𝜔𝑠) (8)
To describe the membrane’s properties, the osmosis efficiency coefficient 𝜏 (-) defined below was used:
𝜏 = ( 𝛻𝑝 𝛻 (𝑅𝑇𝑀 𝑠𝜌𝑙𝜔𝑠) ) 𝑊𝑙=0 (9)
Where 𝑅 denotes the ideal gas constant, 𝑇 the temperature and 𝑀𝑠 the molar mass of the solute.
When 𝜏 = 1, the semi-permeable membrane is perfect and the impact of the osmotic pressure is maximum. When 𝜏 = 0 the membrane has no effect.
The part of liquid flux due to this osmotic pressure gradient is derived from the Darcy law previously introduced. It can be written as: 𝑊𝑂𝑠𝑚= 𝜌𝑙 𝑘 𝜇 𝑅𝑇𝜌𝑙 𝑀𝑠 𝜏 𝛻𝜔𝑠 (10)
Where 𝑊𝑂𝑠𝑚 denotes the osmotic mass flux. The diffusive flux is defined by the Fick’s law:
𝑊𝐹𝑖𝑐𝑘= −𝐷𝑒𝑓𝑓𝜌𝑙𝛻𝜔𝑠 (11)
Where 𝑊𝐹𝑖𝑐𝑘 is the diffusive mass flux. The effective diffusion coefficient 𝐷𝑒𝑓𝑓 refers here to the diffusion of the solute in the porous BWP. This coefficient depends on the porosity. The liquid total mass flux 𝑊𝑙 is the addition of the Darcean and osmotic fluxes:
𝑊𝑙= 𝑊𝐷𝑎𝑟𝑐𝑦+ 𝑊𝑂𝑠𝑚 (12)
The solute total mass flux 𝑊𝑠 is a combination of the diffusive flux and the liquid flux, to take into account the advection by the liquid flux. When 𝜏 = 1, the semi-permeable membrane is perfect, there is no advection. When 𝜏 = 0, the membrane has no effect and the advection is maximum.
𝑊𝑠= 𝑊𝐹𝑖𝑐𝑘+ (1 − 𝜏)𝜔𝑠𝑊𝑙 (13) The mechanical responses of the BWP during water uptake have to be managed in combination with transport and chemical responses. From a mechanical point of view, the BWP are considered as a homogenized mixture. For a material with no body force (gravity is neglected), the total stress equilibrium can be written as:
𝛻. 𝜎 = 0 (14)
Where 𝜎 denotes the total stress tensor. The total stress can be decomposed referring to the Terzaghi principle:
𝜎 = 𝜎′− 𝑝𝐼 (15)
Where 𝜎′ is the effective stress and 𝑝 is the bitumen pore solution pressure.
The mechanical behaviour of BWP is complex to model. In the present analysis the strains are the addition of elastic strains and creep strains. The model used for creep strains is the Maxwell model of viscoelasticity. It is based on two parameters: the volumetric viscosity (𝜂𝑣) and the deviatoric viscosity (𝜂𝑑). It leads to the following expressions:
𝜀𝑣̇ (𝑡) = 1 𝜂𝑣 𝜎𝑚′(𝑡) + 1 𝐾𝜎𝑚 ′̇ (𝑡) (16) 𝑒𝑖𝑗̇ (𝑡) = 1 2𝜂𝑑 𝑠𝑖𝑗(𝑡) + 1 2𝐺𝑠𝑖𝑗̇ (𝑡) (17) Where 𝜀𝑣 is the volumetric strain (𝜀𝑣= 𝑡𝑟(𝜀)), 𝜎𝑚′ the main stress (𝜎𝑚′ =
1
3𝑡𝑟(𝜎′)), K the bulk modulus (𝐾 = 𝐸 3(1−2𝜈)), 𝐸 the Young modulus, 𝜈 the Poisson ratio, 𝑒𝑖𝑗 the coefficients of the deviatoric strain tensor (𝑒𝑖𝑗 = 𝜀𝑖𝑗− 1
3𝜀𝑣𝛿𝑖𝑗), 𝑠𝑖𝑗 the coefficients of the deviatoric stress tensor (𝑠𝑖𝑗 = 𝜎𝑖𝑗− 𝜎𝑚𝛿𝑖𝑗), G the stiffness modulus (𝐺 =
𝐸 2(1+𝜈)). The theoretical CHM model takes into account the compressibility of water, as well as the influence of the solute concentration on the evolution of the density of the liquid phase. The compressibility of the water results in the variation of the density of the water as a function of the pressure.
The laws of thermodynamics lead to the following expression for the density of a compressible aqueous phase:
𝑑𝑣 = −𝑣 𝐶𝑤𝑑𝑝 + 𝑣𝑟𝑑𝜔𝑠 (18)
With 𝑣 as the specific volume of the aqueous phase, 𝐶𝑤 the compressibility of the water, 𝑝 the pore solution pressure, 𝜔𝑠 the mass fraction of dissolved salt.
We also have 𝑣𝑟= 𝑣 𝑤− 𝑣𝑠(= 𝑉𝑤 𝑀𝑤− 𝑉𝑠 𝑀𝑠). Where 𝑣𝑤 and
𝑣𝑠 , 𝑉𝑤 and 𝑉𝑠 and 𝑀𝑤 and 𝑀𝑠 are respectively the mass volumes, the molar volumes and the molar masses of water and dissolved salt. The previous equation can be written according to the density of the liquid phase that we note 𝜌𝑙. We have 𝜌𝑙= 1 𝑣 . 𝑑𝜌𝑙 𝜌𝑙 = 𝐶𝑤𝑑𝑝 − 𝜌𝑙𝑣𝑟𝑑𝜔𝑠 (19)
This leads to the following expression: 𝜌𝑙
𝜌𝑤
~ 5 ~ With 𝜌𝑤 the density of the aqueous phase in the reference state, i.e. at the atmospheric pressure and at zero solute concentration.
2.3 Variation laws for transfer parameters
One of the greatest difficulties to establish an efficient numerical model for bitumen water uptake is the description of the evolution of the material properties. Porosity will potentially vary from 1% to 60% [13], through the combined action of salt dissolution and swelling. Recent experimental measurements carried out by the CEA have shown a significant initial porosity in the BWP: from 6% to 10% for the French simplified BWP, containing 40 wt% of sodium nitrate (noted M40_NaNO3 for Mono-salt containing 40 wt% of sodium nitrate hereafter). It is called “French simplified BWP” because it contains only one soluble salt and the bitumen used is the one used for the industrial French STEL BWP.
It is essential to establish evolution laws linking material parameters and Eulerian porosity. The parameters concerned are permeability, diffusion coefficient and the osmosis efficiency coefficient.
2.3.1
Diffusion coefficient
The subject is discussed in the literature, notably by B. Gwinner [14] and [15]. Bitumen waste is considered as a material with a certain proportion of unconnected pores. The presence of these pores filled with aqueous solution will facilitate the diffusion of species in the material. This is because diffusion in an aqueous solution is faster than in the bitumen matrix.
The so-called Maxwell homogenization law [16] [17] is proposed to provide a homogenized diffusion coefficient. This law is applied to a continuous medium in which there is a "small amount" of unconnected spherical pores distant enough from each other. When applied to the case of BWP leaching, it allows the effective diffusion coefficient in the leached BWP to be expressed as a function of porosity, pore diffusion coefficient and diffusion coefficient in non-porous BWP. Regarding porosity, the quantity of interest is the ratio between pore volume and total volume at the current time. Therefore, Eulerian porosity was used, noted 𝑛𝑙:
𝐷𝑒𝑓𝑓 𝐷𝑛𝑜𝑛 𝑝𝑜𝑟𝑜𝑢𝑠 𝐵𝑊𝑃 = 1 + 3𝑛𝑙( 𝐷𝑝𝑜𝑟𝑒𝑠 𝐷𝑛𝑜𝑛 𝑝𝑜𝑟𝑜𝑢𝑠 𝐵𝑊𝑃 + 2 𝐷𝑝𝑜𝑟𝑒𝑠 𝐷𝑛𝑜𝑛 𝑝𝑜𝑟𝑜𝑢𝑠 𝐵𝑊𝑃 − 1 − 𝑛𝑙) −1 (21)
With 𝐷𝑒𝑓𝑓 as the effective diffusion coefficient in the leached BWP, 𝐷𝑛𝑜𝑛 𝑝𝑜𝑟𝑜𝑢𝑠 𝐵𝑊𝑃 the effective diffusion coefficient in the non porous BWP, 𝐷𝑝𝑜𝑟𝑒𝑠 the effective diffusion coefficient in the pores, i.e. in the aqueous solution
that occupies the pores and 𝑛𝑙 the Eulerian porosity in the leached BWP.
The ratio 𝐷𝑝𝑜𝑟𝑒𝑠
𝐷𝑛𝑜𝑛 𝑝𝑜𝑟𝑜𝑢𝑠 𝐵𝑊𝑃 being greater than 10
6, the previous equation is simplified: 𝐷𝑒𝑓𝑓 𝐷𝑛𝑜𝑛 𝑝𝑜𝑟𝑜𝑢𝑠 𝐵𝑊𝑃 = 1 + 3𝑛𝑙 1 − 𝑛𝑙 (22) The diffusion coefficient in the non-porous BWP will be assimilated to the diffusion coefficient in the non-leached BWP: 𝐷𝑖. Following this simplification, Maxwell's law of homogenization provides the following expression for the diffusion coefficient in the leached BWP:
𝐷𝑒𝑓𝑓 = 𝐷𝑖(1 + 3𝑛𝑙 1 − 𝑛𝑙
) (23)
In Figure 2, experimental measurements for effective diffusion of tritiated water are compared with theoretical results from different homogenization laws [13]. These tests are carried out on non-radioactive BWP specially produced in laboratories following the industrial processes of BWP produced at La Hague (STE2 and STE3). Porosity measurements are based on Environmental Scanning Electron Microscopy (ESEM) views. Effective diffusion coefficients are available for water and other elements (salts). Measurements are made at 25°C using radioactive tracers. These experimental measurements of porosity and effective diffusion coefficient were carried out on a non-leached sample (activity equal to 0.74 corresponds to a saturated sodium nitrate solution) and on three samples completely leached by solutions of different activities (0.89, 0.96 and 1). These different chemical leaching solution activities lead to four different final states.
Figure 2 - Illustration of different diffusion models in heterogeneous media containing spherical porosities and adapted to the case of BWP leaching, compared to experimental data (Source: [13] )
According to these results, the Maxwell's homogenization law is the best option to reproduce the evolution of the effective diffusion coefficient of a species in the BWP when porosity increases. However, it is important to note the limited experimental results available. The choice of the law of evolution remains questionable.
~ 6 ~
2.3.2
Permeability
Direct permeability measurements for such a material and for such low permeability levels are, as things stand, technically impossible. It is therefore necessary to rely on a theoretical law of evolution of this parameter and to calibrate the initial value from the available experimental measurements.
Several approaches based on homogenizations methods could be used to provide permeability variation laws. The UPC model uses a power law to model the permeability in Eurobitum (cf. [5]). Regarding experimental measurements on French BWP performed by the CEA another approach was selected. The Maxwell homogenization law is also proposed for the permeability (25) as for diffusion (cf. 24):
𝑘 = 𝑘𝑖(1 + 3𝑛𝑙 1 − 𝑛𝑙
) (25)
Where the initial permeability of the BWP 𝑘𝑖 is a fitting parameter in the present model.
The choice of the variation law and the initial value that results from it remains debatable. Further studies on the evolution of BWP permeability could be the subject of future work, with the aim of deepening our knowledge in relation to this topic.
2.3.3
Osmosis efficiency coefficient
The osmosis efficiency coefficient is considered as variable with the porosity of the material. The chosen evolution law is the one introduced in the modelling work done by the UPC [4], [5], [6]:
𝜏(𝑛𝑙) = 𝜏𝑖 𝑛𝑙𝑖
𝑛𝑙
(26) With 𝜏𝑖 the initial value for the osmosis efficiency coefficient. The reference value used by the UPC [6] is 𝜏(𝑛𝑙= 0,01) = 0,95.
2.4 Variation law for mechanical parameters
During the leaching, the porosity of the BWP will increase. The mechanical behaviour of a porous material is greatly linked to this intrinsic property. Homogenization laws could allow us to determine the mechanical properties of a porous material from both the initial mechanical properties of the skeleton and the porosity.
The Mori-Tanaka approach allows to describe the mechanical behaviour of a composite material in which one phase can be clearly identified as a matrix [18]. This method reproduces the interaction between pores by changing the uniform strain boundary condition at infinity in the framework of the Eshelby’s inhomogeneity problem.
This problem is already solved for poroelastic materials. When considering the case of a single family of spherical pores embedded in an isotropic solid phase, it is possible to formulate the elasto-mechanical properties of the homogenised material: 𝐾𝑚𝑡= 𝐾𝑠(4𝐺 𝑠(1 − 𝑛 𝑙)) 3𝑛𝑙𝐾𝑠+ 4𝐺𝑠 (27) 𝐺𝑚𝑡= 𝐺𝑠 (1 − 𝑛𝑙)(9𝐾 𝑠+ 8𝐺𝑠) 9𝐾𝑠(1 +2 3𝑛𝑙) + 8𝐺𝑠(1 +23𝑛𝑙) (28)
With the homogenised parameters: 𝐾𝑚𝑡 and 𝐺𝑚𝑡, respectively the bulk and the stiffness modulus of the BWP, and with 𝐾𝑠 as the bulk modulus of the skeleton, 𝐺𝑠 the stiffness modulus of the skeleton.
The mechanical constitutive law is linear (cf. (16) and (17)). It is then possible to apply the same reasoning to the viscous part. The mathematical demonstration can be done for the derivate strain tensor in place of the strain tensor. It leads to the following results:
𝜂𝑣𝑚𝑡 = 𝜂𝑣𝑠 (4𝜂𝑑𝑠(1 − 𝑛𝑙)) 3𝑛𝑙𝜂𝑣𝑠+ 4𝜂𝑑𝑠 (29) 𝜂𝑑𝑚𝑡= 𝜂𝑑𝑠 (1 − 𝑛𝑙)(9𝜂𝑣𝑠+ 8𝜂𝑑𝑠) 9𝜂𝑣𝑠(1 + 2 3𝑛𝑙) + 8𝜂𝑑𝑠(1 + 2 3𝑛𝑙) (30)
With the homogenised parameters: 𝜂𝑣𝑚𝑡 and 𝜂𝑑𝑚𝑡, respectively the volumetric and the deviatoric viscosity parameters of the BWP, and with 𝜂𝑣𝑠 as the volumetric viscosity parameters of the skeleton, 𝜂𝑑𝑠 the deviatoric viscosity parameter of the skeleton.
3 Numerical implementation
The chosen method for the numerical implementation of the theoretical model is the Finite Element Method (FEM). The model is implemented in the code BIL, developed by P. Dangla [10]. The temporal discretization follows the implicit Euler scheme. The time step is adaptively managed by the code. In the general case, because of the strong couplings, the problem is nonlinear in displacement, pressure and mass fraction of dissolved salt. After discretization, the matrix system obtained is nonlinear. The Newton-Raphson method is used to solve it.
4 Description of unconfined test
Experimental results on French BWP leaching are available and described for unconfined tests in [11]. In the present paper, we are focused on a set of French simplified BWP, elaborated by incorporating one highly soluble salt such as sodium nitrate in bitumen Viatotal 70/100 [21]. Leaching
~ 7 ~ experiments were performed at 25°C by casting 20 g of BWP in 50 mm-diameter polyethylene flasks. Each flask was then filled up with 40 mL of demineralized water and sealed from the atmosphere. Resulting leachates were renewed after a fixed period (1, 7, 14, 28, 59, 126, 237, 384, 475 and 680 days). For each renewal, BWP samples were weighted once leachates were removed, in order to determine the amount of water taken up. Leachates were collected and analysed by using ion chromatography (Metrohm 940 Professional IC Vario) to measure the amount of nitrate and sodium ions that have been leached. In the present paper, we use results obtained from samples containing 18 wt%, 28 wt% and 40 wt% of sodium nitrate (M18_NaNO3, M28_NaNO3 and M40_NaNO3). The available measures for these samples are summarized in Table 1.
Table 1 - Experimental measurements available
Initial mass fraction of
𝑁𝑎𝑁𝑂3
M18_NaNO3. M28_NaNO3. M40_NaNO3
Mass of salt leached X Mass of water absorbed X X X Modelling description:
The bituminized waste initially contains sodium nitrate crystals represents 40 wt%, that corresponds to 23.8% of the total volume i.e. 𝜙𝑐= 0.238. Due to this ratio, the theoretical bulk density of the sample is 1350 𝑘𝑔. 𝑚−3. Each sample is prepared with 20 g of material. According to the value retained for the density, the height of the sample is ℎ = 7,5.10−3 𝑚. The chosen geometry is one-dimension plane modelling. On the one side of the sample, we have the free surface in contact with leaching solution: pressure is the atmospheric pressure, the solute mass fraction is equal to zero (pure water), and the effective stress is also null. On the other side, we have the bottom of the sample where the displacement is blocked.
The geometry and the boundary conditions are detailed in the Figure 5.
Figure 5 - Schematic representation of the modelled domain
The porosity is defined as the volume fraction accessible by the liquid phase. We assume an initial value for the porosity between 6 and 10%, as indicated in section 2.3. The hydration of the initial porosity will occur first and impact the evolution of both the amounts of water uptake and of salt leached. As previously mentioned, this mechanism will be considered by a simplified uncoupled method described in section 5. During the water uptake test, once the pores are water saturated the following assumptions regarding pore water pressure and sodium nitrate concentrations are made: pore water pressure is equal to 1 atm, and solution is saturated with 𝑁𝑎𝑁𝑂3 (mass fraction of solute in water at “initial” state: (𝜔𝑠)𝑡=0 = (𝜔𝑠)𝑠𝑎𝑡= 0.47).
5 Assumption on the hydration phase
The theoretical model developed during this work is a monophasic “saturated” model. In the calibration presented in this paper, a simplified uncoupled consideration is proposed of the quantities of water and salt related to the hydration of the sample, independently of the rest of the numerical model. This method is introduced in the following section.
According to experimental findings by [19] on 38 mm diameter and 10 mm high cylindrical Eurobitumen samples, the hydration of a bituminous mix under free inflation conditions is carried out in three distinct phases. The first relates to the porosity near the free edge, which is connected with the outside. This first phase, which lasts about 50 days, is characterized by a significant amount of leach salt, rapid progress of the hydrated area and negligible swelling. The second phase is remarkable in the sense that a significant
-
h
Bituminized waste
Free water
Displacement blocked: No flux of salt No flux of liquid-
0
Atmospheric pressure: Pure water: Free swelling:~ 8 ~ slowdown takes place in the progression of the hydrated area and of the release of salt. During this phase, the progression of the hydration front is linear as a function of the square root of time, which is characteristic of a diffuse phenomenon. This second phase is quite long: about 800 days for a "Eurobitume" [19]. During this phase, the water uptake comes with a significant swelling of more than 30% at 900 days. The thickness of the hydrated zone at 900 days is about 5 mm. The third phase identified is a phase of acceleration of the different mechanisms, which is explained by an increase in porosity above a certain threshold.
First of all, we are interested in the second phase of the hydration of BWP. This is a phase during which, according to experimental measurements [19], the hydration regime is mostly diffusive. We will therefore consider that the mass of absorbed water necessary for the hydration of the material evolves linearly as a function of the square root of time. The work presented in [19] is also used to estimate the time it takes for the hydration front to reach a depth of 7.5 mm in a BWP sample. The composition of the BWP studied in [19] differs from French simplified BWP. The aim of the approach is to provide an order of magnitude of the hydration duration of a 7.5 mm high sample. As a first approximation, we will consider that the hydration of the 7.5 mm high sample is carried out in 𝑡𝑓= 1000 days. The volume of hydration water is determined from the initial porosity and dimensions of the sample: 50 mm in diameter and 7.5 mm high. For an initial porosity of 7%, we therefore find a volume of hydration water of 1.03 𝑐𝑚3. To avoid dependency on the diameter of the sample, surface fluxes are usually used. We thus obtain a mass of hydration water of 𝑚ℎ𝑦𝑑𝑟𝑎𝑡𝑖𝑜𝑛 𝑤𝑎𝑡𝑒𝑟 7%= 52.5 𝑚𝑔. 𝑐𝑚−2. For the hydration law, we choose a square root evolution of time, in relation to the observations of [19], which reaches 𝑚ℎ𝑦𝑑𝑟𝑎𝑡𝑖𝑜𝑛 𝑤𝑎𝑡𝑒𝑟 7% at 1000 days. This leads to the following expression:
𝑚ℎ𝑦𝑑𝑟𝑎𝑡𝑖𝑜𝑛 𝑤𝑎𝑡𝑒𝑟 (𝑡) = 𝑚ℎ𝑦𝑑𝑟𝑎𝑡𝑖𝑜𝑛 𝑤𝑎𝑡𝑒𝑟 7%√ 𝑡 𝑡𝑓
(31)
The corresponding curve is shown in Figure 3. For the following calibration work, this evolution law will be used to take into account the impact of the hydration of the media on the evolution of the amount of absorbed water during the simulated test. At each moment the theoretical hydration water mass will be added to the absorbed water mass provided by the numerical model, and then compared to the experimental measurement of the water mass absorbed by the sample (cf. Figure 7). This assumes that the hydration of the initial porosity and the swelling of the material are uncoupled.
Figure 3 – Theoretical evolution of the absorbed water mass used by the hydration of the material as a function of time.
In the Figure 3 we applied this law to a M40_NaNO3 sample with an initial porosity equal to 7%.
The Sodium Nitrate is a highly soluble salt in water, therefore the hydration water leads to the total dissolution of the salt crystals it encounters, starting with those near the free edge. The amount of dissolved salt required to saturate the hydration water is calculated from the theoretical evolution of the hydration water (see Figure 3) and the solubility of sodium nitrate in water at 20°C: 0.876 𝑘𝑔. 𝑘𝑔−1. We therefore obtain the following expression:
𝑚𝑠𝑎𝑡𝑢𝑟𝑎𝑡𝑖𝑜𝑛 𝑠𝑎𝑙𝑡 (𝑡) = 0,876 × 𝑚ℎ𝑦𝑑𝑟𝑎𝑡𝑖𝑜𝑛 𝑤𝑎𝑡𝑒𝑟(𝑡) (32)
The corresponding curve is shown in Figure 4.
Figure 4 - Theoretical evolution of the mass of salt used for the saturation of the hydration water of the media as a function of time.
6 Experimental calibration
In this part, we explore the model’s ability to reproduce swelling of the BWP during the water uptake.
The material parameters of the model can be categorized into two different groups according to how their numerical values
~ 9 ~ are determined. In the first group, we find the parameters for which a direct experimental measurement can be performed. In the second one, we find the calibration parameters.
6.1 Measured parameters
The model is first fitted to the free swelling tests’ data, for a French simplified BWP, containing 40 wt% of sodium nitrate (M40_NaNO3).
Below are provided the main material parameter values for the studied BWP.
Experimental measurements of the effective diffusive coefficient of HTO water in French BWP named STEL are available in B. Gwinner’s work [14]. This value was here used for the simplified French BWP as the initial value of diffusion coefficient of water. The Young modulus is derived from experimental measurements of consolidation tests performed by the CEA with STEL. The value of the Poisson ratio for pure bitumen is drawn from literature [20], [21], it corresponds to a quasi-incompressible behaviour. All other numerical values used in this model are commonly used in other models, notably in [6] and [14].
All of these material parameters values are listed in Table 2.
Table 2 - Material parameters
Parameter Notation Value
Deviatoric viscosity 𝜂
𝑑 1,6.107 𝑃𝑎. 𝑠
Young modulus 𝐸 2,4.107 𝑃𝑎
Poisson ratio 𝜈 0,47
Initial liquid density 𝜌
𝑙 1000 𝑘𝑔. 𝑚−3
Crystal salt density 𝜌
𝑐 2260 𝑘𝑔. 𝑚−3
Dissolution rate 𝛽 10−5 𝑘𝑔. 𝑠−1. 𝑚−3
Crystal specific surface 𝜎
𝑐 148 𝑚−1
Solute molar mass 𝑀
𝑠 85.10−3 𝑘𝑔. 𝑚𝑜𝑙−1 Dynamic viscosity of
water 𝜇 10−3 𝑃𝑎. 𝑠
6.2 Calibration parameters
Three fitting parameters are used to calibrate the numerical model: the initial permeability 𝑘𝑖, the initial diffusion coefficient of sodium ions 𝑑𝑖 and the initial porosity 𝑛𝑙𝑖. The two quantities used to adjust the numerical model are the evolution of the mass of water absorbed and the evolution of the mass of salt leached (see Table 1). The measurements used are those carried out by the CEA on two samples of identical compositions in 2007 and 2013 (M40_NaNO3_2007 and M40_NaNO3_2013) [11]. The water uptakes were respectively studied over a period of 651 and 1094 days.
Previously published studied have shown the role of several parameters on the leaching of salt during the water uptake [22]: the initial diffusion coefficient of Sodium ions has a direct influence on the mass of salt leached, when the initial permeability has a negligible impact on salt release. For the third calibration parameter, as previously said, recent experimental measurements, realized by the CEA, have carried out an interval for this parameter: from 6% to 10% for the M40_NaNO3 sample.
The obtained values of calibrated material parameters are given in the Table 3.
Table 3 – Calibrated material properties.
Parameter Notation Value
Initial permeability 𝑘 𝑖 5.10−25 𝑚2 Initial diffusion coefficient of Sodium ions 𝑑𝑖 2.10 −15 𝑚2. 𝑠−1 Initial porosity 𝑛 𝑙𝑖 0.07
Figure 6 - Numerical and experimental results of cumulative amount of 𝑁𝑎𝑁𝑂3 that has leached out of the modelled domain.
Figure 7 - Numerical and experimental results of cumulative amount of water that has been absorbed in the modelled domain.
~ 10 ~ The numerical and experimental results are presented in Figure 6 and Figure 7. In both figures, the numerical results with and without considering the hydration phase of initial porosity (cf. section 4.) can be observed.
The present model, considering initial hydration, shows a good ability to reproduce the evolution of both amounts of leached salt and of absorbed water. Hereinafter, the focus will remain on numerical results considering the initial hydration phase. However, some uncertainty remains regarding the long-term evolution of the salt leaching. Additional experimental values are needed to validate the model on the long term.
In addition to the evolution of the amount of salt leached, the study of the evolution of porosity profiles during the test is relevant since the porosity plays a main role in the transport mechanisms. The diffusive coefficient and the permeability are directly linked to the porosity evolution through the evolution law (cf. section 2). The mechanical parameters are also connected to the porosity by Mori-Tanaka’s homogenization law.
The porosity profiles corresponding to this simulation are given initially and after 1, 10, 100 and 1000 days of water uptake (see Figure 8). There is a gradual increase in porosity near the free edge of the sample. At 1000 days, the maximum porosity in the sample is about 48%. This stands well below the maximum porosity threshold at which porosity becomes connected (around 55% according to [13]). The increase in porosity is limited to the area near the free edge, the porosity in the rest of the sample remains close to the initial value of 7%.
Figure 8 - Eulerian porosity profiles in the sample at 0, 1, 10, 100 and 1000 days.
As a reminder, the increase in porosity is due to two different but closely related mechanisms: the dissolution of salt crystals and swelling. For this sample, salt crystals initially represent 24.3% of the volume. During the water uptake, their dissolution will therefore contribute significantly to the increase in porosity. The evolution of the profile of the salt crystal volume fraction in the sample is shown in Figure 9. The dissolution of the crystals is consistent with the
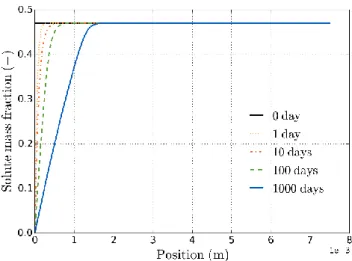
evolution of the solute mass fraction in the porous aqueous solution (see Figure 10). The interstitial solution remains locally saturated until the salt crystals have completely dissolved.
Figure 9 - Salt crystal volumetric fraction profiles in the sample at 0, 1, 10, 100 and 1000 days.
Figure 10 - Profiles of solute mass fraction in the sample pore water at 0, 1, 10, 100 and 1000 days.
The evolution of the swelling of the sample during the uptake, given by the numerical model including hydration, is presented in Figure 11. At 1000 days, the swelling is about 3,6.10−4 𝑚 (corresponding to 5%). The swelling is not homogeneous throughout the sample. This is clearly visible in Figure 12. Deformations are located near the free edge, and, locally, the discretized volumetric deformations exceed 33%.
~ 11 ~
Figure 11 - Swelling of the sample function of time during the water uptake.
Figure 12 - Profiles of volumetric deformations of the sample at 0, 1, 10, 100 and 1000 days.
7 Validation
The aim of this part is the validation of the numerical model associated with previous parameters. In the previous part, the model was calibrated on an experimental data set, using a M40_NaNO3 sample. In this section, simulations are performed for the three different samples with the same calibration parameters (cf. Table 3). The other two samples used to compare the numerical results with the experimental results are simplified French BWP containing respectively 18 wt%. and 28 wt%. of sodium nitrate (M18_NaNO3 and M28_NaNO3). The amount of initial salt crystals differs from one sample to another, the numerical values are provided in Table 4.
Table 4 – Volume fraction of salt crystals for the three different type of BWP studied.
Type of sample Volume fraction of salt crystals 𝜙𝑐𝑖
M18_NaNO3 0.093
M28_NaNO3 0.16
M40_NaNO3 0.238
The comparison between numerical and experimental results is presented in Figure 13. This graph shows an excellent reproduction by the numerical model, after considering the impact of hydration, of the experimental results for samples M18_NaNO3_2007 and M28_NaNO3_2007.
It can be observed that the water uptake kinetics of the samples increase with the quantity of salt crystals initially present. On this graph it can be noticed that the kinetics, beyond 600 days, of the water uptake of the sample M40_NaNO3_2007 is different from the others. This difference raises questions about the existence of any event that would have disrupted the experimental measurements for this sample. Nevertheless, the study of this graph confirms the relevance of the calibration proposed in this work.
Figure 13 - Absorbed water amount function of time for simplified French BWP, containing 18%, 28% and 40 wt% of sodium nitrate.
8 Conclusions and further works
In this paper, a numerical poromechanical model was proposed including Darcy’s Flow, diffusion and osmotic mechanisms. The dissolution precipitation of the salt was taken into account. Original evolution laws of diffusion coefficient and permeability as a function of the porosity were proposed. The distinction between lagrangian and eulerian porosity was made. A novel mechanical model was proposed, based on the viscoelastic model of Maxwell 5%
2007
~ 12 ~ including Mori-Tanaka homogenisation law. The formulation was implemented in a finite element software (BIL). The behaviour of simplified French BWP, containing one highly soluble salt, sodium nitrate, was studied. Water uptake could generate swelling mainly due to osmosis. To simulate the hydration of the material, an original and simple method was proposed, avoiding costly two-phase resolution and complex calibration of the related parameters.
The numerical model calibration with experimental results was presented. Swelling laboratory tests were conducted on non-radioactive samples of a simplified BWP containing only one highly soluble salt, sodium nitrate, at different salt concentrations. The calibration of the model was undertaken for one of this sample containing initially 40 wt% of sodium nitrate (M40_NaNO3). Numerical values for the three fitting parameters were determined to get a good agreement between experimental and numerical results. Experimental results on two other samples containing respectively 18 wt% and 28 wt% of sodium nitrate were used to validate the numerical results. The comparisons show also a good agreement between numerical results and experiments for these samples and contribute to the model validation. The method used to take into account the hydration of the material allows the model to correctly reproduce the actual behaviour of the material in the presence of water. This is consistent with our hypothesis of uncoupling between the hydration mechanisms and the other mechanisms considered in the model.
During the leaching, the sample swells significantly: at 1000 days the swelling reaches about 5%, and the porosity reaches locally about 48%. At this level of porosity several laws used in the model are close to the limits of their validity domains, in particular the Mori-Tanaka homogenization law used for the mechanical parameters, and the Maxwell homogenization law used for the transport parameters. The model should be validated further for swelling and for higher amount of test cases. Although the model is promising, the latter is certainly necessary due to the variability of the experimentally observed absorbed water (see Figure 13).
Extending the model to two-phase flow behaviour seems an interesting perspective, to confirm the relevance of the current hypotheses, as well as carrying out experimental measurements similar to those [19] on French industrial and monosalt BWP. The difficulty will then lie in adjusting the parameters specifically to the two-phase flow behaviour. In particular, we can question the probably of very weak capillary properties of the material.
Another future proposition is to validate the numerical model with results concerning water uptake at constant volume. Moreover, it would be interesting to study the model’s ability to reproduce the behaviour of industrial BWP.
Finally, this model will be implemented in Finite Element software Code_Aster (www.code-aster.org).
Data availability:
The raw/processed data required to reproduce these findings could not be shared at this time as the data also forms part of an ongoing study.
9 References
[1] B. Gwinner, J. Sercombe, C. Tiffreau, B. Simondi-Teisseire, I. Felines and F. Adenot, “Modelling of bituminized radioactive waste leaching. Part II: Experimental validation.,” Journal of Nuclear
Materials, vol. 349(1), pp. 107-118, 2006.
[2] J. Sercombe, B. Gwinner, C. Tiffreau, B. Simondi-Teisseire and F. Adenot, “Modelling of bituminized radioactive waste leaching. Part I: Constitutive equations.,” Journal of Nuclear Materials, vol. 349(1), pp. 96-106, 2006.
[3] N. Mokni, S. Olivella and E. Alonso, “Swelling in clayey soils induced by the presence of salt crystals,”
Applied Clay Science, vol. 47(1), pp. 105-112, 2010.
[4] N. Mokni, S. Olivella, X. Li, S. Smets, E. Valcke and A. Mariën, “Deformation of bitumen based porous material: Experimental and numerical analysis,” Journal
of Nuclear Materials, vol. 404(2), pp. 144-153, 2010.
[5] N. Mokni, Deformation and flow driven by osmotic processes in porous materials, Universitat Politècnica de Catalunya, 2011.
[6] N. Mokni, S. Olivella, E. Valcke, A. Mariën, S. Smets and X. Li, “Deformation and flow driven by osmotic processes in porous materials: Application to Bituminised Waste Materials,” Transport in porous
media, vol. 86(2), pp. 635-662, 2011.
[7] A. Mariën, N. Mokni, E. Valcke, S. olivella, S. Smets and X. Li, “Osmosis-induced water uptake by Eurobitum bituminized radioactive waste and pressure development in constant volume conditions,” Journal of
Nuclear Materials, no. 432, pp. 348-365, 2013.
[8] A. Mariën, S. Smets, X. Li and E. Valcke, “¨Processes related to the water uptake by Eurobitum bituminised radioactive waste: theoretical considerations and first experimental results.,” MRS Online Proceedings
Library Archive, no. 1107, pp. 151-159, 2008.
[9] A. Mariën, S. Smets and E. & Valcke, “Study of the processes related to the water uptake of Eurobitum bituminized radioactive waste: Effect of salt
~ 13 ~ concentration,” MRO Online Proceedings Library
Archive, vol. 1193, pp. 24-29, 2009.
[10] P. Dangla, “Bil-2.6 A modeling platform based on finite volume/element methods (Version v2.6),” 2018.
[Online]. Available:
http://doi.org/10.5281/zenodo.1419841.
[11] J. Champenois, R. Blinder, A. Guillermo, M. Bardet and A. Poulesquen, “Influence of Mineral Salts Content on Bituminous Waste Products Water Uptake,”
Poromechanics , vol. VI, pp. 634-639, 2017.
[12] O. Coussy, Poromechanics, John Wiley & Sons Ltd, 2004.
[13] B. Gwinner, “Comportement sous eau des déchets radioactifs bitumés : validation expérimentale du modèle de dégradation COLONBO,” Thèse de doctorat,
Institut National polytechnique de Lorraine, 2004.
[14] B. Gwinner, J. Sercombe, B. Simondi-Teisseire, I. Felines, C. Tiffreau, F. Adenot and E. Favre, “Stockage en profondeur des déchets nucléaire bitumés: Problématique et recherches,” Revue francophone
d'écologie industrielle , no. 36, pp. 13-18, 2004.
[15] B. Gwinner, J. Sercombe, C. Tiffreau, B. Simondi-Teisseire, F. Adenot, I. Felines and E. Favre, “Experimental and theorical study of the pore structure and diffusion propertiesof an evolving heterogenous material: application to radioactive bituminized waste,”
Chemical Engineering Communications, no. 194 (2), pp.
234-247, 2007.
[16] J. C. Maxwell, A treatise on Electricity and Magnetism unabridged, 3rd ed., vol. I and II, Dover, New-York, 1954.
[17] R. M. Barrer, “Diffusion and permeation in heterogeneous media,” Diffusion in polymers, pp. 165-217, 1968.
[18] L. Dormieux, D. Kondo and F. J. Ulm, Microporomechanics, John Wiley & Sons, 2006. [19] N. Bleyen, S. Smets, W. Verwimp, K. Hendrix, X. Sillen
and E. Valcke, “Hydration of Eurobitum bituminized waste under free swelling conditions: osmosis-induced swelling and NaNO3 leaching,” MRS Advances, vol. 1, no. 62, pp. 4103-4108, 2016.
[20] S. Maillard, C. de La Roche, F. Hammoum, C. Such and J. M. & Piau, “Bitumen healing investigation using a specific fracture test,” Road Materials and Pavement
Design, no. 5(sup1), pp. 45-63, 2004.
[21] H. N. Nguyen, F. Hamomoun, A. Ehrlacher and E. Chailleux, “Analyse de la rupture d'un film de bitume par la méthode des éléments finis,” 18ème Congrès
Français de Mécanique (Grenoble 2007), 2007.
[22] G. Mélot, P. Dangla, S. Granet, S. M'jahad, J. B. Champenois and A. Poulesquen, “Coupled Chemo-Hydro-Mechanical analysis of Bituminized Waste swelling due to water up-taking,” S26-Couplages
thermo-hydromécanique et chimiques des milieux poreux., 2017.
[23] E. L. Cussler, Diffusion: Mass transfer in fluid systemes, New York: Cambridge University Press, 1997.
![Figure 2 - Illustration of different diffusion models in heterogeneous media containing spherical porosities and adapted to the case of BWP leaching, compared to experimental data (Source: [13] )](https://thumb-eu.123doks.com/thumbv2/123doknet/12931364.374132/6.892.462.829.457.963/illustration-different-diffusion-heterogeneous-containing-spherical-porosities-experimental.webp)