HAL Id: cea-01119056
https://hal-cea.archives-ouvertes.fr/cea-01119056
Submitted on 20 Feb 2015
HAL is a multi-disciplinary open access
archive for the deposit and dissemination of
sci-entific research documents, whether they are
pub-lished or not. The documents may come from
teaching and research institutions in France or
abroad, or from public or private research centers.
L’archive ouverte pluridisciplinaire HAL, est
destinée au dépôt et à la diffusion de documents
scientifiques de niveau recherche, publiés ou non,
émanant des établissements d’enseignement et de
recherche français ou étrangers, des laboratoires
publics ou privés.
Scaling: lost in the smog
Rémi Louf, Marc Barthelemy
To cite this version:
Rémi Louf, Marc Barthelemy. Scaling: lost in the smog. Environment and Planning B: Planning and
Design, SAGE Publications, 2014, 41, pp.767 - 769. �10.1068/b4105c�. �cea-01119056�
Scaling:
Lost in the smog
R´emi Louf∗
Institut de Physique Th´eorique, CEA, CNRS-URA 2306, F-91191, Gif-sur-Yvette, France
Marc Barthelemy†
Institut de Physique Th´eorique, CEA, CNRS-URA 2306, F-91191, Gif-sur-Yvette, France and Centre d’Analyse et de Math´ematique Sociales, EHESS-CNRS (UMR 8557),
190-198 avenue de France, FR-75013 Paris, France
The success of natural sciences lies in their great emphasis on the role of quantifiable data and their interplay with models. Data and models are both necessary for the progress of our understanding: data generate stylized facts and put constraints on models. Models on the other hand are essential to comprehend the processes at play and how the system works. If either is missing, our understanding and explanation of a phenomenon are questionable. This issue is very general, and affects all scientific domains, including the study of cities.
Until recently, the field of urban economics essentially consisted in untested laws and theories, unjustified con-cepts that supersede empirical evidence [1]. Without em-pirical validation, it is not clear what these models teach us about cities. The tide has turned in recent years, however: the availability of data is increasing in size and specificity, which has led to the discovery of new stylized facts and opened the door to a new science of cities [2]. The recent craze for scaling laws [3–5], for instance, has been an important new step in the study of urban sys-tems.
These laws present themselves as a power-law relation-ship between socioeconomic (GDP, number of patents), structural (length of roads, of cables) quantities Y , and the size of the population P of the city:
Y = Pβ (1)
where the exponent β can be different from 1. This type of scaling relation is a signature of various processes governing the phenomenon under study, especially when the exponent β is not what is naively expected [6]. However, as more and more scaling relationships are being reported in the literature, it becomes less and less clear what we really learn from these empirical findings. Mechanistic insights about these scalings are usually nonexistent, often leading to misguided interpretations.
A striking example of the fallacies which hinder the interpretation and application of scaling is given by dif-ferent studies on CO2emissions due to transportation [7– 10]. The topic is particularly timely: pollution peaks
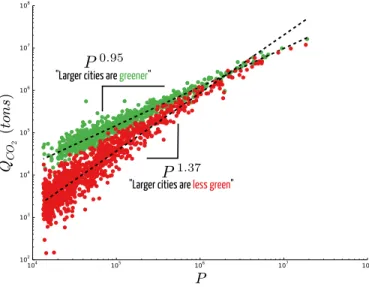
oc-FIG. 1: Are larger cities greener or smoggier? Scal-ing of transport-related CO2 emissions with the population
size for US cities from the same dataset but at different aggregation levels. In red, the aggregation is done at the level of urban areas and in green for combined statistical areas. Depending on the definition of the city, the scal-ing exponents are qualitatively different, leadscal-ing to two op-posite conclusions. Data on CO2 emissions were obtained
from the Vulcan Project (http://vulcan.project.asu.ed) (see [7, 9]). Data on the population of urban areas and metropolitan statistical areas were obtained from the Census Bureau (http://www.census.org).
cur in large cities worldwide with a seemingly increasing frequency, and are suspected to be the source of serious health problems [11]. Glaeser and Kahn [8], Rybski et al [10], Fragkias et al [7], and Oliveira et al [9] are in-terested in how CO2 emissions scale with the population
size of cities. The question they ask is simple: Are larger cities greener—in the sense that there are fewer emis-sions per capita for larger cities—or smoggier? Surpris-ingly, these different studies reach contradictory conclu-sions. We identify here two main sources of error which originate in the lack of understanding of the mechanisms governing the phenomenon.
The first error concerns the estimation of the quantity QCO2 of CO2 emissions due to transportation. In the
absence of direct measures, Glaeser and Kahn [8] have
2 chosen to use estimations of QCO2based on the total
dis-tance traveled by commuters. This is in fact incorrect, and in heavily congested urban areas the relevant quan-tity is the total time spent in traffic [12]. Using distance leads to a serious underestimation of CO2 emissions: the
effects of congestion are indeed strongly nonlinear, and the time spent in traffic jams is not proportional to the traveled distance. As a matter of fact, commuting dis-tance and time scale differently with population size, and the time spent commuting and CO2emissions scale with the same exponent [13].
The second, subtler, issue lies in the definition of the city itself, and over which geographical area the quantities QCO2 and P should be aggregated. There is
currently great confusion in the literature about how cities should be defined, and scientists, let alone the various statistical agencies in the world, have not yet reached a consensus. This is a crucial issue as scaling exponents are very sensitive to the definition of the city [14]. CO2 emissions are no exception: aggregating
over urban areas or metropolitan statistical areas entails radically different behaviours (see figure 1). For the US, using the definition of urban areas provided by the Census Bureau (http://www.census.org), one finds that CO2 emissions per capita sharply increase with population size, implying that larger cities are less green. Using the definition of metropolitan statistical areas, also provided by the Census Bureau, one finds that CO2 emissions per capita decrease slightly with population size, implying that larger cities are greener.
Faced with these two opposite results, what should one conclude? Our point is that, in the absence of a convinc-ing model that accounts for these differences and how they arise, nothing. Scaling relationships, and more gen-erally data analysis, have an important role to play in the rising new science of cities. But, as the previous discussion illustrates, it is dangerous to interpret empiri-cal results without any mechanistic insight. Conclusions cannot safely be drawn from data analysis alone.
From a policy point of view, now, what should one do to curb CO2 emissions? Favour the growth of large urban areas or the repartition of population in less populated cities? Both can be argued by considering data analy-sis alone. It should therefore be obvious that, until they
have a satisfactory understanding of the mechanisms re-sponsible for the observed behaviours, scientists should refrain from giving policy advice that might have unfore-seen, disastrous consequences. If they choose to do so anyway, policy makers should be wary about what is, at best, a shot in the dark
∗ Electronic address: [email protected] † Electronic address: [email protected]
[1] Bouchaud JP (2008) “Economics needs a scientific revo-lution” Nature 455:1181.
[2] Batty M (2013) The New Science of Cities (MIT Press, Cambridge, MA).
[3] Batty M (2008) “The size, scale, and shape of cities”
Science 319:769–771.
[4] Bettencourt LMA, Lobo J, Helbing D, K¨uhnert C, West GB (2007) “Growth, innovation, scaling, and the pace of life in cities” Proceedings of the National Academy of
Science, USA 104:7301–7306.
[5] Pumain D (2004) “Scaling laws and urban systems”,
Working Papers, Santa Fe Institute, 2004-02-002.
[6] Barenblatt GI (2003) Scaling (Cambridge University Press, Cambridge).
[7] Fragkias M, Lobo J, Strumsky D, Seto KC (2013) “Does size matter? Scaling of CO2 emissions and US urban
areas” PloS ONE 8:e64727.
[8] Glaeser EL, Kahn ME (2010) “The greenness of cities: carbon dioxide emissions and urban development”
Jour-nal of Urban Economics 67:404–418.
[9] Oliveira EA, Andrade JS, Makse HA (2014) “Large cities are less green” Scientific Reports 4:4235.
[10] Rybski D, Sterzel T, Reusser DE, Winz AL, Ficht-ner C, Kropp JP (2013) “Cities as nuclei of stability?”
arXiv:1304.4406.
[11] Bernstein JA, Alexis N, Barnes C, Bernstein IL, Nel A, Peden D, Diaz-Sanchez S, Tarlo M, Williams PB (2004) “Health effects of air pollution” Journal of Allergy and
Clinical Immunology 114:1116–1123.
[12] Louf R, Barthelemy M (2013) “Modeling the polycentric transition of cities” Physical Review Letters 111:198702. [13] Louf R, Barthelemy M (2014) “How congestion shapes cities: from mobility patterns to scaling” Scientific
Re-ports 4:5561.
[14] Arcaute E, Hatna E, Ferguson P, Youn H, Johansson A, Batty M (2013) “City boundaries and the universality of scaling laws” arXiv:1301.1674.