HAL Id: hal-03181233
https://hal.archives-ouvertes.fr/hal-03181233
Preprint submitted on 26 Mar 2021
HAL is a multi-disciplinary open access
archive for the deposit and dissemination of
sci-entific research documents, whether they are
pub-lished or not. The documents may come from
teaching and research institutions in France or
abroad, or from public or private research centers.
L’archive ouverte pluridisciplinaire HAL, est
destinée au dépôt et à la diffusion de documents
scientifiques de niveau recherche, publiés ou non,
émanant des établissements d’enseignement et de
recherche français ou étrangers, des laboratoires
publics ou privés.
Exploring, browsing and interacting with multi-scale
structures of knowledge
Quentin Lobbé, Alexandre Delanoë, David Chavalarias
To cite this version:
Quentin Lobbé, Alexandre Delanoë, David Chavalarias. Exploring, browsing and interacting with
multi-scale structures of knowledge. 2021. �hal-03181233�
Exploring, browsing and interacting with multi-scale structures of
knowledge
Quentin
Lobbé,
Alexandre
Delanoë and
David
Chavalarias
CNRS, Complex Systems Institute of Paris Île-de-France (ISC-PIF), Paris, France
A R T I C L E I N F O Keywords: phylomemy reconstruction knowledge visualization multi-scale exploration evolutionary tree science map co-word analysis A B S T R A C T
The ICT revolution has given birth to a world of digital traces. A wide number of knowledge-driven domains like science are daily fueled by unlimited flows of textual contents. In order to navigate across these growing constellations of words, interdisciplinary innovations are emerg-ing at the crossroad between social and computational sciences. In particular, complex systems approaches make it now possible to reconstruct multi-level and multi-scale structures of knowl-edge by means of phylomemies: inheritance networks of elements of knowlknowl-edge.
In this article, we will introduce an endogenous way to visualize the outcomes of the phy-lomemy reconstruction process by combining both synchronic and diachronic approaches. Our aim is to translate high-dimensional phylomemetic networks into graphical projections and in-teractive visualizations. To that end, we will use seabed and kinship views to translate the multi-level and multi-scale properties of complex branches of knowledge. We will then define a generic macro-to-micro methodology of exploration implemented within an open source software called
Memiescapeand validate our approach by browsing through the reconstructed histories of
thou-sands of scientific publications and clinical trials.
1. Introduction
Since the dawn of humanity, writing has been one of the first mnemotechnology: a technique not only designed to fix a thought on a medium but also a dynamic tool for the elaboration of a collective memory [70]. Written texts can thus be considered as vectors of knowledge as well as providers of socio-historical contexts. The accumulation of Mesopotamian clay tablets (4000 BC) or the elaboration of the Vivarium library (535 AD-555 AD) gave early evidence of a growing will to collect and provide access to isolated elements of knowledge. Later on, with the transition from manuscript to book [29], textual contents outgrew erudite communities and started to touch all layers of the population, up to the present day: we are now daily fueled by unlimited flows of articles, novels, messages, tweets, etc. The recent ICT revolution [6] has given birth to an unprecedented world of digital traces and has impacted a wide number of knowledge-driven domains such as education or policy making.
Science, in particular, has been one of the first area to experiment this digital shift. Databases of scientific publi-cations are scaling up and it is now possible to dive into the amazing richness of most of these catalogs. Qualitative sciences are also taking advantage of the ICT revolution by integrating large cultural data sets (digitized historical documents, social networks footprints, archived Web sites, etc.) within their own scopes of analysis [43]. Digital-born fields of research have thus emerged at the crossroad between social and computational sciences. But whether we speak of digital humanities [59] or cultural analytics [49], it seems that all these domains end up facing the same issue: how to navigate across growing constellations of words and texts?
As early as the 18thcentury, while he was completing the first edition of the Encyclopédie [23], d’Alembert
sug-gested the idea of using trees to situate the future reader:
“[...] above this vast labyrinth, whence he can perceive the principal sciences and the arts simultane-ously. From there he can see at a glance the objects of their speculations and the operations which can be made on these objects; he can discern the general branches of human knowledge, the points that separate or unite them; and sometimes he can even glimpse the secrets that relate them to one another [...]”1
1d’Alembert, Jean-Baptiste le Rond. "Preliminary Discourse." The Encyclopedia of Diderot & d’Alembert Collaborative Translation Project.
Translated by Richard N. Schwab and . Ann Arbor: Michigan Publishing, University of Michigan Library, 2009. Web. 2021.http://hdl.hand
le.net/2027/spo.did2222.0001.083. Trans. of "Discours Préliminaire," Encyclopédie ou Dictionnaire raisonné des sciences, des arts et des
Likewise, at the beginning of the 1900s, Paul Otlet planned to use experimental interfaces for the legendary Mun-daneum[48]. The visitors of the library were supposed to have access to the collected documents’ references by means of macro-visualizations2placed on top of mobile pieces of furniture. These few examples are evidence of a historical
need: researchers have always been looking for tools able to capture and visualize overall representations of wide ele-ments of knowledge. In line with D’Alembert’s vision, our article’s purpose is to give researchers the means to interact with large corpora of texts in relevance with their investigations. To that end, we will rely here on the most recent developments in the fields of collective intelligence and reconstruction methods.
Collective shapes of knowledge.
Because there are structures inside knowledge, a given text can always be studied in relation to others or in light of a specific socio-cultural context. By way of textual traces, human beings are calling out to one another: citations, retweets, controversy, etc. We are the architects of a giant web of elements of knowledge whose very structures and shapes convey information of their own [14]. Like ants or bees, through the aggregation of individual contributions, we collectively achieve complex tasks that are out of the reach of individuals. This phe-nomenon is called collective intelligence [5] and relies on a core mechanism called stigmergy; that is, the indirect coordination between an agent and an action through the environment [72]. From scientific archives to Web pages and online ratings, our digital societies are literally embedded in a stigmergic environment. Wikipedia, for instance, is an emblematic example [40]. The global shapes of these traces of collective intelligence constitute a full-fledged source of knowledge.Reconstruction methods.
Nowadays, complex systems approaches enable us to reconstruct the collective shapes and ontogeny of large corpora of texts. We call reconstruction methods all techniques implemented to understand a com-plex object or natural phenomenon by means of both the observation of patterns and the analysis of processes. Such methods are part of the larger family of phenomenological reconstructions, designed to find reasonable approximations of the structure and dynamics of a given phenomenon [7]. Reconstruction methods can be summarized by the generic workflow 𝑂 → 𝑅 → 𝑉 , where 𝑂 represents a complex object associated to a set of properties. Based on a collected data set,𝑂 is next reconstructed as a formal object 𝑅 described in a high-dimensional space on the basis of a collected data set. The process ends with the dimensional reduction of 𝑅, so that it can be projected as a human-readable visual-ization 𝑉 . In this paper, we focus on the phylomemy reconstruction method (see2.2.1) which consists in reconstructing inheritance networks of elements of knowledge on top of timestamped corpora of textual documents [15]. But while the most recent research have investigated the multi-level and multi-scale properties of phylomemies in 𝑅 [16], the question of their visualization in 𝑉 remains an open challenge. How can we explore, browse and interact with wide elements of knowledge through a phylomemy? How can we translate their inner processes in a graphical way?Summary of main contributions.
We’ll first review the state of the art of text analysis and knowledge visualization methods (see2.1). We will then focus on the field of science dynamics (see2.2) before drilling down through the phylomemy reconstruction method (see2.2.1). In doing so, we will highlight the inner properties and components of the phylomemies we aim to visualize. After having investigated the notions of synchrony and diachrony, we will define two complementary axes of visualization: the seabed view and the kinship view (see3.3), and discuss ways to interact with them through micro, mezzo and macro lenses of exploration (see3.4). Using the free software Gargantext, we will then develop our approach thanks to a new open source vizualisation system called Memiescape (see3.6) and validate it by browsing through the historical landscapes of various domains of research (see4). We will end up by introducing a generic methodology for browsing through multi-scale structures of knowledge (see5).2. State of the art and insights
Mapping large corpora of texts is an interdisciplinary domain of research that has recently expended under the influence of the data revolution [37]. In order to position our contribution, we will adopt a co-word analysis ap-proach [12,26,27] to map out the scientific literature of text analysis and knowledge visualization. To that end, let us start by framing the domain with a complex query (seeA) based on generic terms such as science map, information cartography, knowledge map, etc. With it we extract a corpus of meta-data3from 13844 documents (titles and abstracts published between the ’80s and the present days) from the Web of Science (Wos) online database and called 𝑚𝑎𝑝𝑠.
2https://upload.wikimedia.org/wikipedia/commons/2/29/Mondoth%C3%A8que_02.jpg
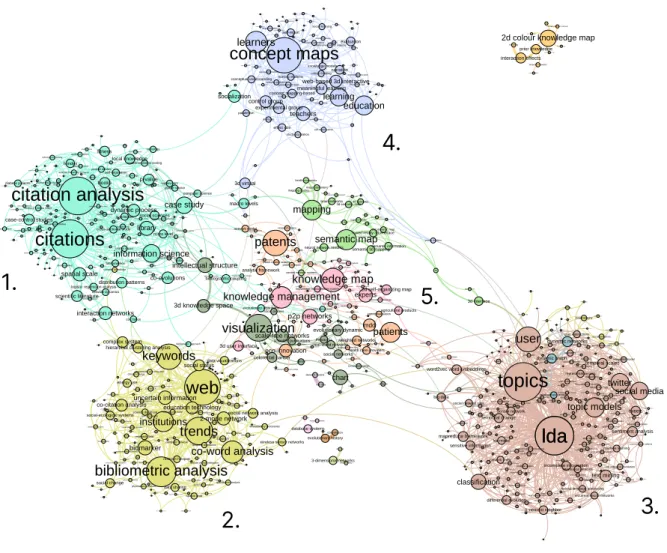
Based on both automatic extraction and human pruning, the free software Gargantext (see3.6) identifies a list of 876 terms constituting the specific vocabulary enclosed in our targeted corpus. The software then generates a semantic landscape appearing as a network of terms (i.e., nodes). In addition, the weighted edges represent any similarities found between terms; they are processed regarding the terms’ co-occurrences in the corpus. We have elected the confidence similarity metric [28], a good proxy to measure direct interactions between elements of vocabulary. A map based on the confidence metric might indeed reveal the topology of the relationships between hypernymies (i.e., superordinate grouping terms) and hyponymies (i.e., terms more specific than others), both in terms of meanings and uses. Such a map is thus able to reconstruct a semantic area made of general concepts linked to more specific notions. In our case, a community detection algorithm also highlights the main research domains [4] as displayed byFigure 1.
risk factors diagnosis control group pca opinions hierarchy patients cognition recommendations european countries chronic diseases lca questionnaire memory psychology study population
central nervous system
case-control studies factor analysis coverage synthesis developed countries physical activity life cycle gene expression general population inclusion criteria cardiovascular disease older adults observational studies trends new information clinical trials research question patterns clinical practice longitudinal study cluster representative sample learning regression analysis
principal component analysis
reduction
history
literature review
logistic regression analysis
young children cluster analysis human body health care indicators colorectal cancer health outcomes systematic reviews climate change primary data
web
scopus database educationsystematic literature review misconceptions young people reference lists health status inclusion classification ethics perceptions
greenhouse gas emissions mental health
literature search
breast cancer
physical environment
young adults
climate change mitigation
environmental impacts human health evaluation scientific literature index cross-sectional study agricultural products international trade health professionals genes
health care providers
higher education diabetic patients food security university students experimental data detection heart diseases social aspects community structure qualitative research usage citizens statistical analyses ecology exploration consistency storage social media clinical studies genetics human rights public health case study medical education data collection social support extant literature controversy sensitivity social issues prediction statistical analysis suggestions correlation coefficients policy makers water resources heterogeneity aggregation food production effect size energy use important area real world co-citation analysis keywords semantics
topics
information managementtime series analysis
bibliometric techniques author cocitation analysis
knowledge map research output quantitative data research communities search engines protocol bibliometric approach research trends information needs cocitation analysis bibliometric maps user profile impact factors
lda
institutions research themes knowledge management co-authorship academic papers web documents cognitive science hybrid method quantitative assessment natural science graphs librarians structural analysis scientific research policymakers hierarchical clustering classification system artificial intelligence network analysis interrelationssupply chain management raw data citation indexes clustering method experts bibliometric data document classification cocitation bibliographic coupling content analysis co-citation taxonomy visualization bibliometrics scientific fields scientific articles web pages social sciences citation index
semantic web scientific publications library information retrieval knowledge structures journal articles bibliometric analysis
lda
conference papers co-word analysis scholarly communication semantic analysis sociology research topics mapping patents data mining representations research areas scientific information research activities main topics informetrics information sciencecitations
scientific knowledge branches landscape intellectual structure relevant documents google scholar similarity measure subject categories multidimensional scaling textual data research literaturescience citation index
international society citation networks digital libraries vosviewer graphical representations software engineering humanities user metrics social sciences research field different levels
author co-citation analysis
new framework patent data biotechnology webometrics co-occurrences
citation analysis
research papers prototype system text mining traditional methods paradigm shift recommendation systems information flow social relationships citation databases conceptualization knowledge integration data source research fronts software web sites social scientists citation impact graph theory citation relationship temporal distribution research interests scientific papers empirical studies qualitative analysis data mining techniquesdomain experts human-computer interaction research domains metadata topology research institutions industry scientific activities self-organizing map medical subject citation contexts computer science learners data analysis mapping science scientific communication academic research research productivity database systems bibliometric methods
social network analysis
spatial information journal papers scientific impact scientific output citation counts social networks co-citation network differentiation complex networks temporal evolution quantitative analysis empirical analysis knowledge organization heterogeneous networks interpretability biomedical literature knowledge discovery books science mapping time series knowledge domains end users teachers core documents dynamic changes real time neural network overlap citation patterns life sciences information visualization paradigm weighted networks citation data co-authors summarization co-citation clustering
journal impact factor
bibliographic data stem specific domain bibliographic databases citation rates dimensionality information systems knowledge network parallelism h-index trend analysis social ties lens distribution patterns ambiguity journal citation report
technology development author keywords semantic similarity decision-making cognitive psychology mathematical model academic journals ranking science database recognition topic distribution information society websites knowledge base qualitative methods direct citations categorization bibliography user interface useful information semantic map spatial distribution theses
natural language processing
classification tasks knowledge sharing
labeling latent semantic analysis international collaboration core journals subgraph cognitive structures semantic relationships visual representations platform conceptual structure viz research project argumentation grammar information sharing thesaurus graphics communication network information sources topic models authorship biodiversity conceptual framework ontology interfaces political science design process annotations knowledge representation betweenness centrality epistemology self-organization information extraction patent documents information services trust wordnet sentiment analysis comparative analysis dynamic networks nlp business intelligence digital technology hot topics performance analysis mental models dynamic nature patent citations knowledge system learning process research collaboration customers semantic information online communities text classification knowledge exchange contextual information international journal hyperlink patent analysis manuscripts classification schemes knowledge creation self-citations domain ontology supervision natural languages open access customer satisfaction citation network analysis
large datasets
heterogeneous data key words
correctness information technology
vector space model visualization techniques statistical methods service quality micro level typology thematic analysis mutual information contextual factors formalization social dynamics temporal networks bayesian networks philosophy molecular biology knowledge acquisition expert knowledge temporal information bioinformatics automatic classification spatial data visualization tool conference proceedings bibliometric studies e-learning information overload intellectual capital organizational learning prototype text documents semantic networks corporate social responsibility conceptual model
personal information scientific collaboration
social interactions key concepts
knowledge management system
scientometric analysis
concept maps
facets fragments classification accuracy text categorization api background knowledge document clustering real data dimensionality reduction entropy real-world dataset social tags systematic approach p-value classifiers propagation twitter data biomarker layer infrastructure twitter collaborative learning cultural heritage streams tweets information literacy tracking social learning public opinion social media data digital age experimental group altmetrics network traffic social environments visual analytics keyword searchsocial network sites
new media user-generated content temporal trends communication technology technological innovation hot spots real-world networks economy big data
innovative approach qualitative data
data sharing
computational methods latent topic software tool
network dynamics
support vector machine unstructured data socialization training data automation temporal dynamics mobile devices embedding
social media platforms
web services knowledge transfer
community detection
text analytics
sensor network
big data research
cloud computing mapreduce
mapreduce framework
data processing public policy
semantic web technologies synergies
research data
artificial neural networks science education dynamic models chart textbooks social work tacit knowledge social development bibliographic records sustainable development conceptual understanding
collaborative concept mapping
citespace data structure cognitive load co-occurrence analysis mapping studies critical thinking research methods self-regulation knowledge flow strategic diagram summaries geographical distribution prior knowledge research hotspots health economics maps statement academic literature fitness environmental sciences
wireless sensor networks
research design open innovation autonomy mind maps information security user experience patent citation network
active learning visualization analysis engineering education web-based 3d interactive synonyms hierarchical structures meaningful learning research gaps semantic relation intelligent system assessment tool knowledge gap 2-mode network co-authorship network unstructured text computer network assessment method online learning computer vision mdd cmaps qualitative studies
data envelopment analysis intellectual property lda model subclasses text analysis evolutionary history evolutionary dynamic evolutionary biology biases 3d map 3d semantic cognitive ability
2d colour knowledge map
semi-structured interviews 3d statistical model social change interaction networks narration text data multiple scales integrated model genomics complex problems network data supervisors software development quantification information processing analogies nursing students nursing education
geographic information system
deep learning n-grams network theory relational database knowledge models topography temporal scales machine learning local context network model storytelling knowledge diffusion meaningful information unsupervised learning self-report decision-making process comparative studies interaction effects
analytic hierarchy process
3-dimensional networks p2p networks analytic framework 3d knowledge space cognitive process social status short texts macro levels information age 3d user interface
association rule mining
neural network models
dynamic behaviors
2d self-organizing map
mixed reality 3d interface
word sense disambiguation scale-free networks
conceptualisation
evolutionary processes spatial patterns temporal resolution
brain networks sparse representation sparsity temporal change classification performance coevolution social process open data social impact
probabilistic topic models
research limitations/implications
hierarchal clustering analysis
geographical locations network topology knowledge graphs user interactions entity recognition uncertain information online reviews real-world data document collection useful knowledge archives information content probabilistic model terminologies sensitive information representativeness incomplete information dynamic process social behaviors biogeography temporal pattern temporal variation classification model k-nearest neighbor spatial scale complex system social-ecological systems eco-innovation local knowledge cyber-physical systems
online social network
pattern recognition high-dimensional data
evolutionary algorithms
recurrent neural networks
user behaviors differential evolution education research user preference education technology text-mining technique data visualizations
deep neural networks convolutional neural network
3d virtual sentiment classification dynamic graph word2vec 4th industrial revolution bibliometric indices word2vec model
word embeddings f measure
3d interface
co-evolutions
word2vec word embeddings concept mapping-based 2d semantic map 3d semantic map semantic 3d mapping
1.
2.
3.
4.
5.
Figure 1: Map of the meta-data of 13844 publications related to text analysis and knowledge visualization, extracted from the Web of Science by using a confidence similarity metric. Generated with Gargantext and spatialized with Gephi. Interactive version available athttp://maps.gargantext.org/maps/sciencemaps/.
2.1. The scientific landscape of text analysis and knowledge visualization
Let us now examine map1where five main communities of research (the numbered dense areas of terms) appear. We here make the assumption that a scientific community can be represented by the use of specific and shared elements of vocabulary. We review these communities by considering their most representative publications:
1. Citation analysis. It was the core of scientometrics in the 1970s [31] and was used as a method to assess scientific impact. Although focusing on knowledge domains, it never really dealt with vizualisation and left it to the bibliometrics community.
2. Bibliometrics analysis. In addition to pure citation analysis, the field of bibliometrics analysis developed in the early 1970s, in keeping with bibliographic coupling and co-citation techniques [34,67]. Later on, following the creation of the Web, bibliometrics approaches enjoyed a surge of interest with the emergence of hyperlinked data[38]. Visualization analysis became central since it offered tools to describe conceptual structures of science such as research fronts, hot topics and trends, etc. [78,11,18] – which might also be studied together as socio-semantic networks [63].
Co-word analysisis a bottom-up approach. First developed by sociologists in the 1980s [13] to reconstruct the dynamics of research themes out of words’ co-occurrence, it quickly paved the way to hybrid research [9,8]. All these methods have primarily borrowed concepts from graphs and social networks analysis. The sub-field of science mapping aims to explore the social structures and temporal evolution of academic research [69] with the help of computer science techniques [32].
Nowadays, science maps are interdisciplinary objects of research resulting from both quali-quantitative and socio-technical processes [20]. The growth of scientific databases has finally stimulated the visualization of wide citation landscapes [68] or complex atlases of sciences [10].
3. Topic modeling. This field emerged in the early 2000s at the instigation of a community of statisticians who first used the Latent Dirichlet Allocation method [3] to characterize collections of documents. Although focusing primarily on document classification [77], recommendation [75] or sentiment analysis [41], parts of their most recent works have started to investigate science mapping [51,79].
4. Concept and semantic maps. In the 1990s, both mapping techniques gained entry to the broader field of science of education[54] as means to support knowledge integration [33]. Concept mapping has been deeply influenced by psychology and cognition. A concept map can be defined as a graphical representation designed to highlight the relationships between ideas or key concepts [36]. Its purpose is to clarify a given topic as well as its underlying cognitive structure [60,1] by means of ontologies, mind maps, mental models, etc. Unlike co-word approaches, concept maps were initially supposed to translate elements of knowledge issued by learners and teachers in a top-down way. But the recent influence of data mining methods has reversed this trend by increasing the use of bottom-up recommendation systems or topic detection, along with the introduction of visualization tools[53,61,66].
5. Domains with peripheral concerns. Unlike clusters no.1 to no.3, the communities represented by cluster no.5 are not focusing on a single method, but rather borrow existing techniques from the latter to study their own objects of research. Among these peripheral domains, the fields of knowledge management [42], business intelligence[56] and patent analysis [73] stand out.
Yet the scope of cluster no.5 remains unclear. It gathers methodologies popularized by mathematicians and computer scientists (community detection, scale free networks, small world networks, etc.) as well as wide and transversal scientific domains (visualization, mapping, data science, etc.) In fact, as text analysis and knowl-edge visualization are not really at the heart of communities no.1 to no.4’s concerns, our initial query (seeA) only captured a slice of their related literature, hence the sparse and fragmented aspect of the cluster no.5 in comparison.
2.2. Revealing the dynamics of science
For our part, we choose co-word approaches (Figure 1, cluster no.2) underlied by phylomemy reconstruction (see
2.2.1). Let us now focus on how phylomemies deal with and effectively translate the temporal aspect of the evolution
of knowledge.
Over the last decade, science has become a fertile field of investigation for the study of time-related dynamics. Being able to access countless digitized academic archives has acted as an incentive for researchers [19,80]. Each of the communities appearing onFigure 1has developed its own set of temporally-aware techniques, from citations dynamics [57,18, 19,62] to topic modeling over time [76, 74,79,22,52] and co-word evolution in the case of
phylomemies [15,64]. The latest developments on phylomemy reconstruction [16] have indeed enriched these seminal approaches: by means of innovative multi-level properties articulated with an intuitive parameter of resolution (see
2.2.1), the resulting high dimensional object in 𝑅 encompasses several scales of aggregation, paving the way to a new
generation of visualizations in 𝑉 .
But regardless of the field of application, taking both the multi-level structure and the inner dynamics of scientific domains into account in an interactive visualization system remains an open challenge; and none of the aforementioned research has actually succeeded in representing the two aspects at the same time in an effective way. For example: while stream graphs successfully convey the evolution of topics, they fail to translate at the same time the structural relationships between these topics [64,79]. Alluvial diagrams and variants likewise hit a brick wall when it comes to revealing the connection between branches of knowledge when these are too complex to be interpreted clearly [62,15,
22,65].
Underway processes.
It is our assumption that multi-views approaches [21,35,81] might be the missing key to visualizing high-dimensional objects. But the originality and richness of a phylomemy might also be impoverished by the use of classical representations. The reconstruction process of a given phylomemy phylomemy in and of itself indeed provides information as valuable as the very dynamics and structures it aims to reveal. With this in mind, we can therefore draw inspiration from any research that focuses on the visualization of processes under way. For instance, recent breakthroughs in terms of writing processes have enabled researchers to design ad hoc representations which endogenously translate the making of a text as well as its inner content [55]. Similarly, in what follows, we plan to build a pair of dedicated views organically deriving from the phylomemy reconstruction process and, by doing so, to translate the phylomemy’s multi-level and multi-scale properties.2.2.1. The phylomemy reconstruction process
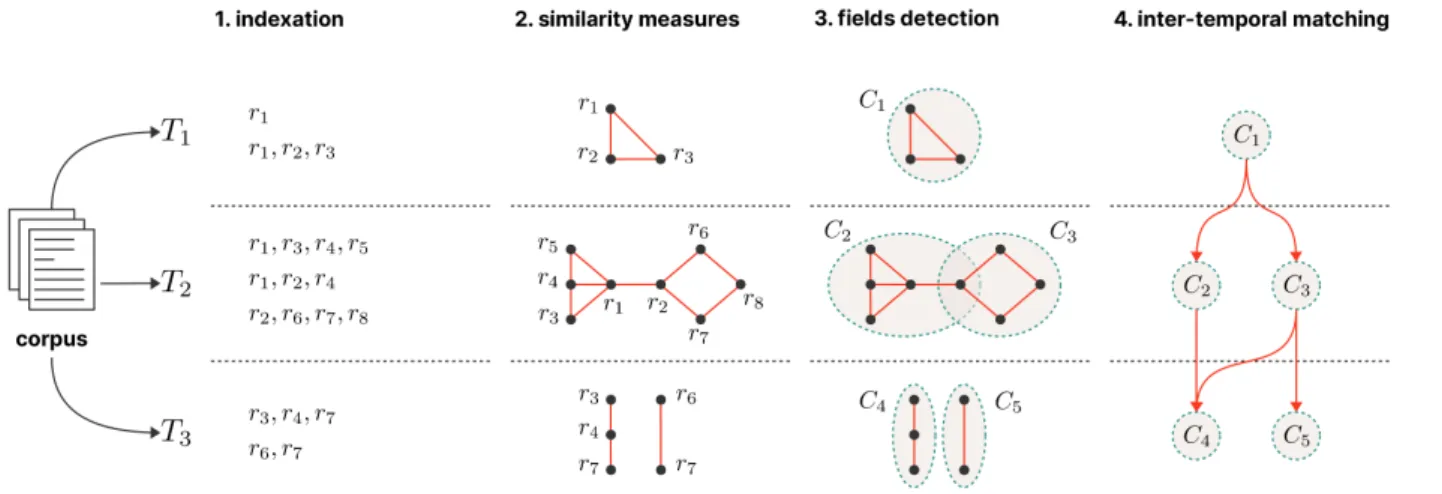
The phylomemy reconstruction process [15] is part of the larger family of reconstruction methods (see1) and is based on co-word analysis approach (see2.1). Within the scope of the generic chain 𝑂 → 𝑅 → 𝑉 , a phylomemy is a formal object 𝑅 designed to reveal conceptual lineages out of any kind of unstructured but timestamped corpora of texts 𝑂. Here, the transition Φ from 𝑂 to 𝑅 can be described as a combination of four successive operators of reconstruction Φ =4Φ◦3Φ◦2Φ◦1Φ[16], where:
Figure 2: The four operators of reconstruction
1Φ. Indexation. We start by framing a corpus of textual documents from a given database (see4) before extracting
its core vocabulary as a list = {𝑟𝑖 |𝑖 ∈ } of root terms 𝑟𝑖. We then choose a temporal resolution (e.g., 3 years) that discretizes our corpus into an ordered set of periods ∗ = {𝑇
𝑖}1≤𝑖≤𝐾, 𝑇𝑖 ⊂ . For each period, we finally compute the co-occurrence of terms in the documents.
2Φ. Similarity measures. We build upon the matrix of co-occurrences to compute a similarity measure (e.g., the
3Φ. Fields detection and clustering. Within each period, the completion of2Φ◦1Φresults in a graph of similarity
potentially containing meaningful sub-units of terms 𝐶𝑇 called fields. We then use of specific clustering algo-rithms (like frequent item set or maximal clique [16]) to identify these fields as sets of groups of terms over the periods, such as ∗= {𝑇|𝑇 ∈ ∗}with 𝑇 = {𝐶
𝑗|𝑗 ∈ 𝐽𝑇}and 𝐶𝑗 = {𝑟𝑖|𝑟𝑖∈, 𝑖 ∈ 𝑗 ⊂}.
4Φ. Inter-temporal matching. Finally, an inter-temporal matching mechanism reconstructs any kinship connections
between groups from one period of time to another. It tries to assign each group a set of parents and children and, by doing so, highlights elements of conceptual and semantic continuity over time called branches. This resulting structure of terms, groups, links and branches determines the overall shape of the phylomemy.
Figure 2summarizes linkages between1Φ,2Φ,3Φand4Φ. But the comprehension of the last mechanism requires
a fine-grained explanation. Indeed,4Φfirst relies on an inter-temporal matching function that derives from a similarity
measure Δ ∶ × () → [0, 1] (such as a Jaccard coefficient [28]). This function aims to create upstream/downstream kinship connections between a given group 𝐶𝑇 at period 𝑇 and any single/pairs of candidates {𝐶
𝑗}𝑗 ⊂() belonging to a strictly anterior/superior period 𝑇′. The resulting lineages are then validated if and only if their corresponding
values of Δ satisfy a fixed threshold 𝛿 ≥ 0.
Sea level rise.
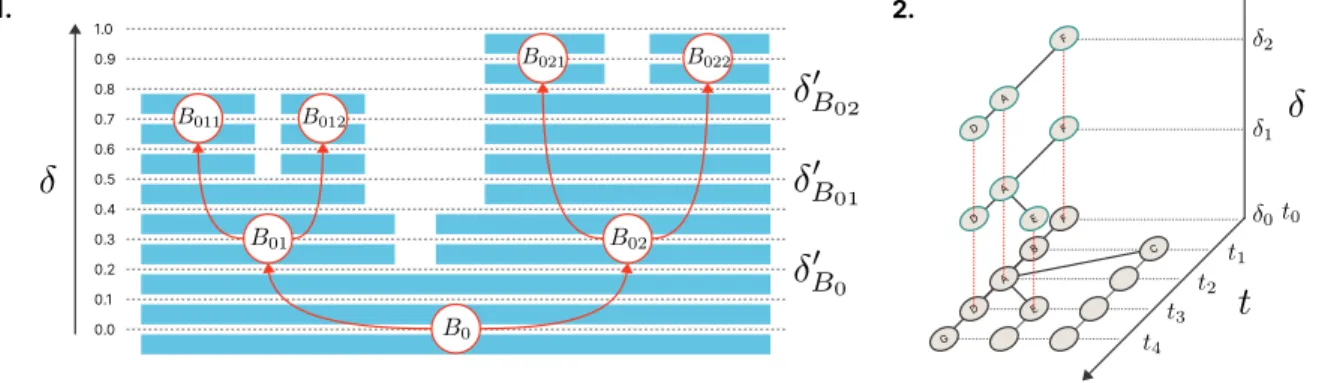
Threshold 𝛿 follows the completion of a sea level rise algorithm [16] which makes it gradually evolve, as explained byFigure 3.1. At a low level of similarity 𝛿 = 0, all groups are connected as part of a wide continent 𝜑0.Later on, the gradual rise of 𝛿 splits this land into smaller islands 𝜑𝛿 by cutting some of the weakest inter-temporal links. Some branches become siblings while others split up earlier and then evolve separately. The newly-formed branches eventually drift away from each other, giving shape to the whole phylomemy: in other words a foliation on a temporal series of clustering(seeFigure 3.2). In addition, the elevation of 𝛿 is locally and recursively scheduled within each of the resulting branches by a global function of quality 𝐹𝜆. This function is based on notions pertaining to information retrieval called accuracy and recall4. 𝐹
𝜆determines whether a given branch should continue to be divided or not at the current value of 𝛿. To that end, the quality score is set up by a parameter 𝜆 to predetermine the desired shape of the phylomemy: a continent (i.e., one large branch) or an archipelago of elements of knowledge (i.e., many small branches). The estimation of 𝜆 is left to the researcher’s discretion in light of her own expertise and research questions, which makes any phylomemy an artifact of the researcher’s perception.
0.1 0.2 0.3 0.4 0.5 0.6 0.7 0.8 0.9 1.0 0.0 G F E C B A D A A F F E D D 1. 2.
Figure 3: 1. The sea level rise algorithm (the initial branch 𝐵0 breaks into smaller branches 𝐵011, 𝐵012, 𝐵021, 𝐵022) and 2. the resulting foliation (a temporal serie of clusters [𝐴...𝐺] is associated to each value of 𝛿)
Level and scale.
The phylomemy reconstruction process deals with the notions5of both level and scale. In complex systems approaches, levels are generally higher descriptors than scales. Here, the choice of 𝜆 first establishes a level of observation, namely the range of intrinsic complexity determining the structural and dynamical properties of the phylomemy. Within each level of observation, a phylomemetic network 𝜑𝛿 following the last and local elevations of4Accuracyis the proportion of relevant elements among all the elements retrieved and recall is the proportion of relevant elements actually retrieved among all the relevant ones.
𝛿can be extracted (e.g, the set of branches 𝐵011, 𝐵012, 𝐵021, 𝐵022in the figureFigure 3.1). This foliation slice has its own scales of description, i.e the range of resolution adopted to describe the structural organization of 𝜑𝛿 (e.g, the various relations between terms, groups, branches, etc).
3. Materials and methods
We will now focus on the last step of the reconstruction process 𝑂 → 𝑅 → 𝑉 : our visualization system. Once we have reconstructed a phylomemy for a specific level of 𝜆, we must reduce the dimensional complexity of the phylomemetic network 𝜑𝛿before projecting its multi-scale properties onto a graphical space. To that end, we articulate four operators of projection: framing the graphical scope (see 3.1), choosing the corresponding axis of navigation (see3.2), designing their related views (see3.3) and building the lenses of exploration (see3.4).
To illustrate our methodology, we’ll use a set of screenshots taken from Memiescape (a working demonstrator, see3.6) showing the phylomemy of a heterogeneous corpus of meta-data in scientific publications called 𝑐𝑛𝑟𝑠(see
Figure 4). This corpus gathers 6000 top cited papers extracted from the Web of Science (WoS). Written between the
1980s and the present day, at least one of each publication’s authors is affiliated to the french CNRS6.
3.1. Graphical scope
In order to translate our object of study into graphical terms, we first need to review the various elements we plan to visualize. Once we have identified the interconnections between these elements as well as any mutual constraints, we can build an actually endogenous representation.
The main elements of a phylomemy are terms, groups and branches. They are subject to the structural constraint: terms ∈ groups ∈ branches. In addition, terms and branches evolve through time, from one period to another (forward and backward), by means of kinship lines that connect pairs of groups together. These weighted connections result from the inter-temporal matching mechanism and thus convey a similarity score.
But some of the kinship lines might have been cut off by the sea level rise algorithm (see2.2.1). We call these cut-off lines ghost lines of the branches’ drift. These artifacts are vectors of information: they convey the similarity gap between two consecutive branches and more specifically between their respective semantic contents. In addition, we are able to access the local range of elevation of each branch to deduce their highest level of 𝛿. By using ghost lines and elevation ranges, we can reconstruct the whole drifting history of the phylomemy’s branches as a naturally hierarchical process.
Unlike terms, which might appear over and over again, groups are strictly timestamped within specific branches. But their corresponding dates give us the possibility to enrich each term with dynamical properties that spread along kinship lines or across distant branches. By doing so, we can determine the terms’ frequency of appearance per period or ask whether one of them is emerging or decreasing:
• Emerging. A term is emerging if it appears at a specific period for the first time in the whole phylomemy. • Decreasing. A term is decreasing if it is used at a specific period for the last time in the whole phylomemy.
3.2. Axis of navigation
We now have to make sense of all these elements from a graphical perspective, bearing in mind that fitting too many dimensions into a single representation can decrease the quality of information displayed [2]. We therefore propose to introduce complementary axes of navigation (foreshadowed in2.2) by using Saussure’s linguistic concepts of synchrony and diachrony [25]:
• Synchrony. Analyzing a language at a particular moment of its history. • Diachrony. Analyzing the historical and temporal evolution of a language.
Applied to the exploration of a phylomemy, a synchronic axis of navigation might highlight the timeless relations of similarity between branches while a diachronic axis may offer insight on the temporal evolution of the vocabulary. The above-mentioned elements can then be distributed along both axes as summarized byTable 1.
Table 1
Distribution of the elements, connections and properties by axis of navigation
Synchrony Diachrony
elements branches terms, groups, branches
connections ghost lines kinship lines
properties branches elevation, branches drift groups dates, terms dynamics, terms frequency
Based on this table, we can now translate all the phylomemetic elements graphically. The foundations of our graphical language (i.e. symbols, colors, sizes, etc.) has been inspired by the general principles of graphic stated by Bertin [2], but its global organization and interactive mechanisms comes from our own understanding of the phy-lomemy reconstruction process.
3.3. Complementary views
We call views a set of dedicated visualizations designed to address different issues but which can still be articulated together as part of a whole phylomemy. We here use two complementary views that respectively build upon the synchronic and diachronic axes of navigation.Figure 4.1 shows how we display these views on top of the other.
3.3.1. The seabed view
The first view (Figure 4.1, top part) follows a synchronic axis of navigation and aims to visualize the relations of similarity between branches7. We call this view the seabed view as it extends the metaphor of the sea level rise
algorithm. The goal here is to project the branches in a two-dimensional topographic space.
We only display the upper parts of the branches and use black triangles to symbolize their peaks (Figure 4.2). In our system of coordinates, the ordinate goes from 0 to 1 (from top to bottom) and maps the last 𝛿 elevation of each branch. The abscissa translates the smallest gap of similarity between two consecutive branches. The seabed view thus helps us to understand a posteriori the outcomes of the sea level rise algorithm and its hierarchical drift: two branches displayed on opposite sides are certain to share no terms. In theFigure 4for instance, branches related to space exploration, dark matter and galaxies lie on the far left, while branches linked to genome, DNA fragmentation and human cells stay on the far right. In the same way, a branch that ends up at the bottom of the seabed view can be identified as a very specialized branch of knowledge (i.e., it results from a high level of 𝛿).
Finally, we draw a set of isolines around the branches’ peaks (Figure 4.2, blue curves) by using their new spacial density8. The more branches we find side by side, the more isolines we draw. This method is an endogenous way to
quickly highlight archipelagos of closely related branches like those focusing on alzheimer and hippocampus in the
Figure 4.2. It gives us a hint about the way the same phylomemy could be shaped under different levels of observation
by foreshadowing what mergers could occur between branches for lower values of 𝜆.
3.3.2. The kinship view
In the Origin of Species [24], Darwin used a single illustration9 to suggest that evolution extends along lines
throughout time. What he drew was evolutionary tree where kinship connections were supposed to leave genetic information from ancestors to future generations. We now propose to use similar trees to represent the full body of our phylomemy’s branches and explore the dynamics of knowledge at work. Tree-like visualizations already have a long-established legitimacy, from biology to anthropology [58] as vectors of comparative studies and topographic analysis. Our second view (Figure 4.1, bottom part) is therefore called the kinship view and follows the diachronic axis of navigation.
We have chosen to use the same abscissa coordinates as in the seabed view to sort branches from left to right. We try to maintain their horizontal drifting gap as much as possible (according to scalability constraints, seesection 5). Groups (gray green full circles) are then arranged under their respective branches’ ticks hanks to the Graphviz spatialization algorithm [39]. This algorithm tries to minimize overlapping between groups and intercrossing between links. We next appoint the groups’ ordinates according to their timestamps: parent groups appear at the top of the kinship view
7Note that regarding the whole reconstruction process (see2.2.1) branches are temporally dense elements of knowledge with relations of
similarity inherited from dynamical mechanisms, but here we choose to represent them without any explicit notion of time.
8We use the libraryhttps://github.com/d3/d3-contourthat relies on a marching squares algorithm [50]
1.
2.
3.
5.
4.
6.
Figure 4: Screenshots taken from Memiescape to visualize the phylomemy of the corpus 𝑐𝑛𝑟𝑠
while children groups are at the bottom. Finally, we draw inheritance lines (solid dark lines) between the groups but without arrow: we think that researchers should be free to follow the natural flow of time or go back, up towards the origins of the branches.
Still, a synchronic interpretation remains conceivable by looking horizontally at the groups. For a given year, one can observe a set of contemporary fields distributed among branches whose similarity relationships can be deduced thanks to the seabed view.
3.4. Interacting with the views
Since the late 1960’s, the science of graphics has evolved thanks to computer sciences tools to improve data visu-alization. Nowadays, it is common practice to add interactive mechanisms as a way to enrich the analysis of a given graphical representation [30]. We will now describe three lenses of exploration through which to look at the views and interact with them from macro to micro scales.
3.4.1. The macro lens
The macro lens is the default lens to explore a phylomemy as illustrated byFigure 4.1. Its first aim is to give an overview of the branches’ evolution and relations of similarity. The kinship view includes zoom and drag mechanisms. By zooming in, one can focus on a given group and reveal the full name of its branch (Figure 4.5). If the user’s cursor moves over a branch’s tick, its corresponding groups and peak are highlighted by a yellow thread (Figure 4.1 and
as a fixed map above the branches to prevent researchers from getting lost in the midst of the phylomemy. When one clicks on a peak, the kinship view is automatically readjusted around the coordinates of the corresponding branch.
3.4.2. The mezzo lens
While the macro lens outlines the global shape of the phylomemy, mezzo lens focuses on its constitutive elements, namely on the emerging terms: these have been extracted beforehand (see3.5) and are displayed in ordinate according to their date of appearance. As for the abscissa, if a term emerges in a single group we obviously reuse that group’s coordinates, but if it appears twice or more at the same time, we place it at the barycenter of its emergence groups. An emerging term might also appear written in black or red according to whether it is shared by multiple branches or not. The size of the terms depends on the number of groups they are part of in the phylomemy. We also display the full list of terms one might find within a given branch when clicking on its corresponding peak (see Figure 4.1, right). The size of the terms appearing on the lists maps their frequency of appearance in the original corpus during the most recent period 𝑇𝑙𝑎𝑠𝑡. This enables us first to highlight the semantic innovations in each branch (or sets of branches) and therefore the contributions each has made to the whole landscape; and then to show the user the vocabulary still employed at the last stage of the phylomemy. We here make the assumption that the point of view of the user is situated in time, as one usually tries to understand the current state of a given element of knowledge at 𝑇𝑙𝑎𝑠𝑡regarding its historical evolution since 𝑇𝑓 𝑖𝑟𝑠𝑡(e.g., while creating a bibliography). Figure 4.3 here illustrates the use of the mezzo lens to reveal major breakthroughs in the researcch conducted by the CNRS on immune response and vaccination between 1987 and 2004. By clicking on one of these terms, the user can switch to the micro lens.
3.4.3. The micro lens
The micro lens is designed to dive fully into the textual content of the phylomemy. It first displays terms within their respective groups (Figure 4.5) before outlining the decreasing and emerging ones with a color code: blue for decreasing terms (e.g., polymerase chain reaction inFigure 4.6) and red for emerging terms (e.g., antibodies inFigure 4.6). When the user clicks on a term, our phylomemy reveals the way this term among and across the branches (Figure 4.4). We put all the kinship lines linking together groups containing the targeted term in red and draw additional light red lines between any distant branches that might have been using it beforehand. InFigure 4.4, we thus highlight the shared use of the term carbon from the branch land-cover change (2000’s - 2010’s) to the branch supercapacitors (2000’s). We also bring the related branches to the front of the seabed view and add a find more link to the Wikipedia’s page of the targeted term if it exists. The micro lens thus makes it possible to follow the internal dynamics of the phylomemy and to understand trans-disciplinary influences through semantic dissemination between branches.
3.5. Upstream extraction of a phylomemetic projection
Views and lenses build on a set of elements that have been extracted beforehand from the high-dimensional foliation 𝜑𝛿. We now want to detail the way we ‘slice’ into a phylomemy reconstructed in 𝑅 by extracting the elements reviewed in3.1, sorting them, filtering them and finally labeling them. To that end, we start by diving into the branches, so to speak, and extracting their last level of elevation with regard to the local evolution of 𝛿. The resulting network is made of branches sorted according to their drifting history (seeFigure 3.1). We then filter this network to remove minor branches, i.e. branches covering less than a minimal number of periods of time. This pruning aims to clarify the future reading of the visualization. Finally, we name the remaining branches by means of a two-terms label. We elect the most frequently emerging term in the targeted branch as the first component of the label. The second one is based on a classical tf–idf measure computed within the branch’s scope. If a given branch does not contain any emerging term, its label results from the union of the two terms with the highest tf–idf score. By doing so, the branch’s label should be a reasonable compromise between the specificity and the representativeness of its constitutive vocabulary. InFigure 4.2 for instance, the targeted branch is named after the union of alzheimer and disease and gathers research focusing on the genetical aspects of this neurodegenerative disease.
3.6. Implementation
In terms of technical support, the free software Gargantext provides us with a set of fully implemented functions for the reconstruction of phylomemies. We include the most recent research developments [16] on phylomemetic projections extraction10 (see3.5) and export them as pre-spatialized Json files by means of Graphviz. We then load
those files within Memiescape, our dedicated demonstrator for the visualization of phylomemies.
Gargantext.
It is a free text-mining software11developed in Haskell. Gargantext makes it possible to turn knowledge structures into tangible artifacts [27]. Gargantext addresses, by design, the user’s role in knowledge-mining tasks and therefore incorporates collaborative, cumulative and collective features. Semantic maps are created thanks to real-time peer collaboration through visualizations, easy reuse of former materials and machine learning on individual and collective past usages. The revealed shapes are consequently the outcomes of a series of reflexive choices and cumulative expertise. By using Gargantext, we aim to guarantee the easy reproducibility of our results and shorten ‘time-to-innovation’ cycles.Memiescape.
It is a standalone Web demonstrator usable in a wide number of scenarios without online dependency12. Because of scalability concerns, almost all text-mining aspects are done upstream within Gargantext. The remaining tasks are processed in the browser with JavaScript and React elements of codes to manage the views in real time. Graphics and interactive mechanisms are made in pure d3js. Memiescape is published under Gargantext licences: aGPLV3 and CECILL variant Affero compliant13.4. Results
We are now able to review the reconstructed histories of thousands of scientific publications thanks to our visu-alization system. We rely for this on manually annotated screenshots taken from Memiescape and summarizing live explorations14.
4.1. An interdisciplinary corpus of academic publications
1. 2. 4. 3. 5. 6. 7. 8. 9.
Figure 5: Manually annotated (red rectangles and arrows) phylomemy of the corpus 𝑐𝑛𝑟𝑠. Interactive version available at
http://maps.gargantext.org/phylo/cnrs_top_cited/memiescape/. Phylomemy downloadable in [47].
In section3, we illustrated our technical choices through the visualization of the corpus 𝑐𝑛𝑟𝑠. Interdisciplinary by nature, this corpus gathers some of the most internationally influential publications (extracted from the WoS) recently carried out by researchers affiliated to the french CNRS. Such a collection could be used as a means to understand the
11Seehttps://gargantext.org,https://www.haskell.org/,https://reactjs.org/&https://d3js.org/
12Code is available athttps://gitlab.iscpif.fr/qlobbe/memiescape/tree/v2
13Seehttps://gitlab.iscpif.fr/humanities/gargantext/blob/stable/LICENSE
dynamics of research and innovation at a national scale. The collective landscape shaped by this corpus may be of interest for historians, sociologists or philosophers who investigate the underlying mechanisms of Science: academic collaboration networks, national policy effects, funding trends, etc. Let us then go through a more detailed exploration of this corpus, using both its phylomemy (seeFigure 5) and the original publications.
The reconstructed phylomemy of 𝑐𝑛𝑟𝑠shows modern science’s global tendency to focus on the microscopic world as a mean to understand larger natural phenomenons – from human health to biosphere changes and universe expan-sion. In the late 1980’s for instance, neuroscience paved the way to the comprehension of brain illness (branches no.1) by first diving into the nervous system of rats before investigating the role of the hippocampus in memory consolida-tionprocesses and alzheimer’s disease (branches no.2). Later on, biologists built on 1990’s genomics improvements (branches no.3) to grasp how mitochondria influenced nuclear apoptosis mechanisms, i.e. cells death and cancers (branches no.4). During the 2000’s ans 2010’s, genetics has led to the decoding of full genome sequences (branches no.5) which were then used in the characterization of species (plants, bacteria, etc.) or for treating genetic human diseases. At the same time, medicine and pathology started to make use of genomics as well in an attempt to improve our adaptive immune system against viruses (branches no.6). Cloning techniques like monoclonal antibody have here been applied to prevent autoimmune diseases or induce immune responses against targeted cancer cells. As for en-vironmental researchers (branches no.7), they started to push global warming to the fore of ecology concerns at the turn of the 2000’s. They pointed out the degradation of carbon exchanges between oceans, tropical forests and the whole biosphere as well as an increasing loss of biodiversity. Beyond Earth and its atmospheric concentrations of C02, astrophysicists then tracked molecular gas (like carbon monoxide) and cosmic dust (branches no.8) to discover galaxiesinside the Hubble deep field or to follow their evolution from star-forming galaxies to mergers. Nowadays, some of the most influential CNRS publications come from the use of the large hadron collider (branches no.9), a particle acceleratorinvolved in the discovery of the Higgs boson and designed to test theoretical predictions in the fields of particle physics.
4.2. The historical evolution of text analysis and knowledge visualization
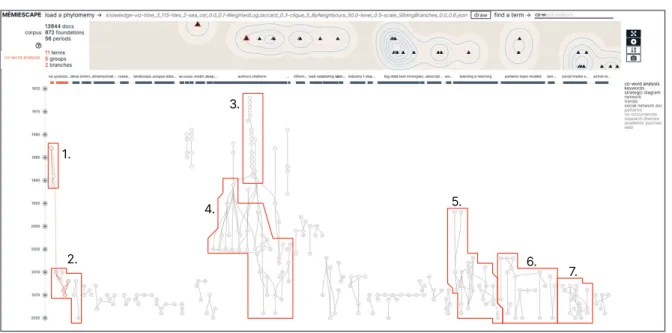
co-word analysis 1. 2. 3. 4. 5. 6. 7.
Figure 6: Manually annotated (red rectangles) phylomemy of the 𝑚𝑎𝑝𝑠corpus at level 0.5, red curves highlight the spread of co-word approaches across the branches. Interactive version available athttp://maps.gargantext.org/phylo/know ledge_visualization/memiescape/.
In section2.1, we used a semantic map generated by Gargantext (seeFigure 1) to position our approach. We will now go over the reconstruction of its corresponding phylomemy15and validate it in light of the state of the art detailed
15The phylomemy
in section2.1. We will also add a few temporal observations.
Figure 6first outlines the evolution of co-occurrence and co-word analyses [71,12]. These were applied in the
late 1980’s (branch no.1) to study paired data within a given collection of documents and, more specifically, pairs of terms for co-word approaches. Both paradigms then enjoyed a revival of interest in the mid-2000’s (branches no.2) as a result of the ICT revolution. They aimed to reveal the structural and dynamical evolution of elements of knowledge by focusing on temporal trends as well as paradigm shifts in science and research fronts [15,26,16]. Our phylomemies are, in a way, heirs to these paradigms.Figure 6also shows that the classical field of citation analysis was predominant during the 1970’s (branches no.3) before passing the baton to what would become the core of bibliometry and scientometry in the early 1990’s (branches no.4); who in turn took advantage of the emergence of large scientific databasesand new web resources to investigate the fields of co-citation analysis and bibliometric indices. In the 2000’s, information retrieval techniques started to be actively used and, at the same time, the long-established field of concept mappingfound concrete applications in the domains of education and learning process (branches no.5). A few years later, topic modeling rose and quickly disseminated accross various scientific fields (branches no.6), from patentsanalysis to recommendations systems and exploration of social media footprints (branches no.5).
4.3. A collection of timestamped clinical trials
Mar Apr May Jun Jul Aug Sep
Figure 7: Phylomemy of the 𝑐𝑡 corpus, with hydroxychloroquine and placebo branches highlighted in red and yellow. Interactive version available athttp://maps.gargantext.org/phylo/clinical_trials/memiescape/.
As a last casework, we will now look at the reconstruction and evolution 4303 timestamped descriptions of clinical trials related to the Covid-19 pandemic. By doing so, we aim to point out that the visualization of phylomemies can apply to a wide range of both contexts and granularities of time. Here, medical descriptions have been dated according to their week of deposit within the Covid-19 WHO database16(from March 2020 to September 2020) and
later compiled into a textual corpus named 𝑐𝑡17. The phylomemy reconstruction summarized byFigure 7displays all the different research paths, discoveries and trials connected to the Covid-19 outbreak. We can see for example that the placebo (yellow branch) has been used as a neutral element for testing the effect of different medications throughout the year 2020. More generally,Figure 7bears witness of a worldwide effort to find an effective cure. What is revealed here is the very making of science as an ongoing process. For instance, the branch highlighted in red
16The original database can be downloaded herehttps://www.who.int/emergencies/diseases/novel-coronavirus-2019/global
-research-on-novel-coronavirus-2019-ncov
translates the complex and bushy paths of chloroquine and hydroxychloroquine clinical trials subsequently associated to tocilizumab, oseltamivir or ritonavir. It is our belief that the visualization of phylomemies could be a powerful tool to foster collective coordination between researchers.
5. Discussion
5.1. A multi-scale methodology of exploration
We have to admit that screenshots taken fromFigure 5, 6 and7fail to translate the way we actually navigate through a phylomemy. Future improvements should therefore address the question of how to effectively translate the outcomes of an exploration in a static illustration. Yet, we think that what interactions between our views (see3.3) and lenses (see3.4) already exist are worthwhile foundations for a convincing methodology of exploration. Users in particular have emphasized in their feedback how phylomemies’ multi-scale properties stimulated their curiosity and made them want to dive deeper. Latest additions are a search engine to locate specific terms within the phylomemy and a contextual list highlighting all the terms connected to the one selected, sorted by frequency of use.
We have been inspired by the science of complex systems, in which the researcher can switch between micro, mezzo, and macro scales. Here, the macro lens (seeFigure 4.1) gives an overview of the temporal evolution, the mezzo lens
(seeFigure 4.3) helps to characterize the branches and the micro lens (seeFigure 4.4) reveals the underlying semantic
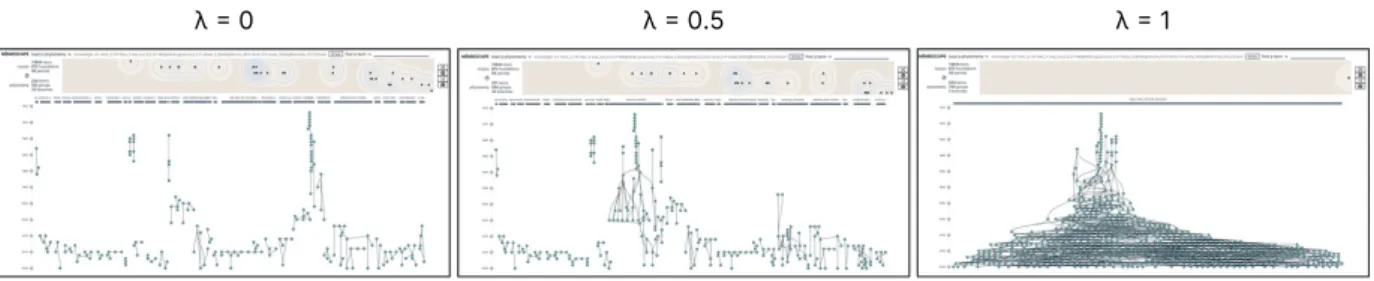
structure. Natural systems and phenomenons are indeed often composed of elements interacting from one scale to another. Different elements might be relevant for different scales and, for instance, micro relationships (e.g. terms used in the same document) might induce the emergence of macro shapes (e.g. branches of knowledge). Multiple scales must therefore be taken into consideration by anyone wishing to explore a phylomemy for both qualitative and quantitative analysis. Last but not least, distinct phylomemies reconstructed at different levels of observation 𝜆
(see2.2.1) can be jointly explored in Memiescape to reveal the whole spectrum of specialization covered by a research
domain [16], as illustrated by theFigure 8.
λ = 0 λ = 0.5 λ = 1
Figure 8: The phylomemy of the corpus 𝑚𝑎𝑝𝑠 reconstructed and visualized for three different levels of observation such as 𝜆 = 0, 0.5, 1
5.2. Scalability issues
Sections3and4focused on the scalability of our visualization system. Two sub-issues arise:
Firstly, the computational scalability is first related to algorithmic issues. Latest work in phylomemy analysis [16] has indeed led researchers to use a reconstruction workflow that follows an 𝑂(𝑛2)complexity. While the size of the
original corpus does not seem to be a limitation, the number of terms present in the root list (see2.2.1) might cause a lengthening of computation time. As for our visualization concerns, we haven’t identified any complexity issue so far. But we have to notice some limitations in our current implementation: when Memiescape tries to visualize a phylomemy greater than 1000 groups, the Firefox browser slows down and struggles to display all the graphical elements. On that particular point, we are confident that future technical developments might improve the capacity of Memiescape.
Secondly, the graphical scalability, related to design issues. InFigure 5or Figure 6, we’ve noticed that large branches’ names sometime overlapped in the kinship view. But the name-shortening mechanism already implemented does not totally solve this issue. As a possible answer, we might later propose a zoom technique based on the importance of the branches or try to develop a non overlapping spatialization method for names and texts.
6. Conclusion
Multi-level and multi-scale by nature, a phylomemy is a complex object that winds up in a high dimensional space called 𝑅 [16]. The originality of our contribution has been to propose a visualization method to endogenously project a given phylomemy from 𝑅 to 𝑉 by means of graphical views and interactive mechanisms (see3). The resulting system of visualization and its implementation have then been successfully applied to a wide range of elements of knowledge to browse their inner dynamics and structure (see4). But the continuity between the original corpus of documents and its final representation can yet be improved. We should in time be able to create a flowing link connecting any term of the kinship view with its corresponding timestamped publication and, by doing so, to complete our multi-scale methodology of exploration (see5).
With that in mind, we think that merging our visualization approach with the reflexive and collaborative features of a software like Gargantext [27] will make the exploration become an active process and one that allows researchers to experience the tangible nature of textual data. Since we consider phylomemies as artifacts of the researcher’s perception
(see2.2.1), we want to give him/her even more of a central role, set him/her in motion among the original corpora,
project him/her through the whole reconstruction process. Future works will therefore be dedicated to the investigation of tangible exploratory data analysis: a new ‘doorway’ methodology for the exploration and visualization of the hidden structure and dynamics of knowledge. This notion will question both the current and the upcoming shapes of a phylomemy thanks to a continuum of iterative loops of analysis. What is the nature of the semantic landscape I’m browsing through? What collection of documents could be missing? What is hidden beyond the borders of my corpus? What new branch of knowledge could appear if I enrich this lineage with an other? What innovative concept could emerge in a near future? Embedded within Gargantext, phylomemies will become open playgrounds where researchers are free to experience multiple round trips from the constitution of their corpora to the collaborative annotation of their visualizations.
References
[1] Benevene, P., Kong, E., Barbieri, B., Lucchesi, M., Cortini, M., 2017. Representation of intellectual capital’s components amongst italian social enterprises. Journal of Intellectual Capital .
[2] Bertin, J., pratique des hautes études (France). Laboratoire de cartographie, É., 1973. Le Traitement graphique de l’information. Laboratoire
de Cartographie. École Pratique des Hautes Études. URL:https://books.google.fr/books?id=dX7IzAEACAAJ.
[3] Blei, D.M., Ng, A.Y., Jordan, M.I., 2003. Latent dirichlet allocation. Journal of machine Learning research 3, 993–1022.
[4] Blondel, V.D., Guillaume, J.L., Lambiotte, R., Lefebvre, E., 2008. Fast unfolding of communities in large networks. Journal of Statistical
Mechanics: Theory and Experiment 2008, P10008. URL:https://doi.org/10.1088%2F1742- 5468%2F2008%2F10%2Fp10008,
doi:10.1088/1742-5468/2008/10/P10008. publisher: IOP Publishing.
[5] Bonabeau, E., Theraulaz, G., 1994. Intelligence collective. Hermes Paris, France. Bibtex: bonabeauIntelligence1994.
[6] Borgman, C.L., 2003. From Gutenberg to the global information infrastructure: access to information in the networked world. Mit Press. [7] Bourgine, P., Brodu, N., Deffuant, G., Kapoula, Z., Müller, J.P., Peyreiras, N., 2009. Formal epistemology, experimentation, machine learning,
in: HAL Archives Ouvertes. Chavalarias et al.. https://hal.archives-ouvertes.fr/hal-00392486, pp. 10–14.
[8] Boyack, K.W., Klavans, R., 2010. Co-citation analysis, bibliographic coupling, and direct citation: Which citation approach represents the
research front most accurately? Journal of the American Society for Information Science and Technology 61, 2389–2404. URL:http:
//doi.wiley.com/10.1002/asi.21419, doi:10.1002/asi.21419.
[9] Braam, R.R., Moed, H.F., van Raan, A.F.J., 1991. Mapping of science by combined co-citation and word analysis. I. Structural aspects. Journal
of the American Society for Information Science 42, 233–251. URL:http://doi.wiley.com/10.1002/%28SICI%291097-4571%28
199105%2942%3A4%3C233%3A%3AAID-ASI1%3E3.0.CO%3B2-I, doi:10.1002/(SICI/1097-4571(199105/42:4<233::AID-ASI1> 3.0.CO;2-I. 00352 bibtex: braamMapping1991.
[10] Brner, K., 2010. Atlas of science: Visualizing what we know. The MIT Press.
[11] Börner, K., Chen, C.M., Boyack, K.W., 2003. Visualizing knowledge domains. Annual Review of Information Science and Technology 37,
179–255. doi:10.1002/aris.1440370106. 00868 WOS:000179918000006 bibtex: bornerVisualizing2003.
[12] Callon, M., Courtial, J.P., Laville, F., 1991. Co-word analysis as a tool for describing the network of interactions between basic and techno-logical research: The case of polymer chemsitry. Scientometrics 22, 155–205.
[13] Callon, M., Rip, A., Law, J., 1986. Mapping the dynamics of science and technology: Sociology of science in the real world. Springer. [14] Chavalarias, D., 2019. Formes collectives. Le Genre humain , 145–152.
[15] Chavalarias, D., Cointet, J.P., 2013. Phylomemetic patterns in science evolution—the rise and fall of scientific fields. PloS one 8.
[16] Chavalarias, D., Lobbé, Q., Delanoë, A., forthcoming. Draw me science - multi-level and multi-scale reconstruction of knowledge dynamics with phylomemies .
[17] Chavalarias, D., Quentin, L., Delanoë, A., 2021. Replication Data for: Draw me Science - multi-level and multi-scale reconstruction of
knowledge dynamics with phylomemies. URL:https://doi.org/10.7910/DVN/SBH3EI, doi:10.7910/DVN/SBH3EI.


![Figure 6 first outlines the evolution of co-occurrence and co-word analyses [71, 12]. These were applied in the late 1980’s (branch no.1) to study paired data within a given collection of documents and, more specifically, pairs of terms for co-word approac](https://thumb-eu.123doks.com/thumbv2/123doknet/12954466.376219/14.816.62.759.389.728/figure-outlines-evolution-occurrence-analyses-collection-documents-specifically.webp)