Deborah G. Ancona M.I.T. Sloan School
with
David F. Caldwell Leavev School
2
ABSTRACT
Using 409 individuals from forty-five new product teams in five high-technology companies, this study investigates the impact of group demography on group performance. Results show that functional and tenure diversity influence performance both directly and through their effects on internal process and external communication. Functional diversity influences external communication which, in turn, influences managerial ratings of innovation. Tenure diversity influences internal processes which, in turn, influence team ratings of performance. However, while diversity produces processes that facilitate performance, it also directly impedes performance. The negative and direct effects of diversity on performance outweighed the positive and indirect effects through group process.
sociologists have observed that the size of age and sex cohorts within a population can influence diverse outcomes, including economic well being (Easterlin, 1980), mobility patterns (Reed, 1978; Stewman & Konda, 1983), crime rates (Maxim, 1985), and marriage practices (Guttentag & Secord, 1983). Recently, this same general concept has begun to be applied to organizational phenomena. For example, the demographic composition of organizations or groups has been related to turnover among university faculty (McCain, O'Reilly & Pfeffer, 1983), top managers (Wagner, Pfeffer & O'Reilly, 1984), and nurses (Pfeffer & O'Reilly 1987); to performance ratings of subordinates (Tsui & O'Reilly, 1989); to executive succession (Pfeffer & Moore, 1980); to firm level performance (Wagner, Pfeffer, & O'Reilly, 1984); and to innovation in organizations
(O'Reilly & Flatt, 1989). All of these studies suggest that it is the distribution of people within a group across variables such as age or tenure that influences behavior, rather than simpler
descriptions of the same variables, such as the mean age of the group or the proportion of the group with a particular tenure.
This study integrates group demography with other aspects of group theory to predict the perceived performance of forty-five new product teams. It moves beyond previous research by examining both the direct effect of group demography on group performance and the indirect
effects of demography created by its influence on internal processes and external communication. Product development teams provide an excellent setting in which to test the relationships among group demography, group processes and performance. Such teams are highly interdependent in that team members must work together to complete their assignment, yet must also work
extensively with non-members. In addition, product development teams are created as temporary groups with individuals frequently assigned to the group because they have particular skills or experiences or represent a functional specialty.
Demographic Variables and Product Development Teams
Group demography researchers have examined the impact of the distribution of a number of variables including tenure, age, and education on individual or group outcomes. For product development teams, two variables are likely to be of particular importance: the homogeneity of organization tenure among group members and mix of functional specialties represented on the team.
Zenger and Lawrence (1989) provide a strong argument that individuals who enter an organization at the same time develop similar understandings of organization events and of the technology for accomplishing work. This suggests that individuals having similar tenure should develop a common approach to organization problems and be familiar with the same technologies. This effect has been related to frequency of communication (Zenger & Lawrence, 1989), social integration within a group (O'Reilly, Caldwell, & Barnett, 1989), and some measures of
performance (O'Reilly & Flatt, 1989). Given the nature of the product development process, the effects of homogeneity of tenure are likely to influence the way the product team operates.
For product development teams, however, the most important diversity variable may be the functional mix. Teams may differ in terms of the proportion of individuals from each functional area. At one extreme, a team might be made up entirely of individuals from research and
development. At the other extreme, one-third of a team's members might be from research and development, one-third from marketing, and one-third from manufacturing. The use of cross-functional teams has been proposed as a method of speeding the product development process (c.f. Calantone & Cooper, 1981; Cooper, 1979; Voss, 1985). These teams offer two potential
advantages. First, the team has direct access to expertise and information that would not be available if all team members were from the same area. Second, since the team includes
representatives from the manufacturing and marketing areas, product transfer will be facilitated. Despite these advantages, teams made up of individuals from different functional areas or
"thought-worlds" may find it difficult to develop a shared purpose and an effective group process III
processes and its outcomes. Thus, this study will examine the impact of both variation in organizational tenure and functional diversity on group process and performance.
Processes That Mediate the Demography-Performance Relationship
Although numerous studies have examined the relationship between demography and various outcomes, fewer have examined the processes through which demographic variables have their effect. However, two recent studies suggest how demographic variability influences
behavior. O'Reilly, Caldwell, and Barnett (1989) demonstrate that within a sample of work teams, homogeneity of tenure on the job is positively related to the group's social integration. They further show that the aggregate social integration of the group is related to individual turnover. This suggests that at least one process by which demography influences turnover is through the development of cohesive groups, which, in turn, reduce the likelihood of individual departure. Although this was not part of the model they tested, O'Reilly et. al. speculate that tenure similarity facilitates social integration by increasing both the opportunities for interaction and the
attractiveness of members to one another. They propose that people with similar entrance dates may undergo similar experiences and develop a common perspective.
While the emphasis in the demography literature has been on social integration or
cohesiveness as an intervening variable between demographic characteristics and outcomes, the group's literature suggests task processes as an alternative mediating variable. Task processes are those behaviors aimed at organizing members to get work done as opposed to those that influence affect or the team's ability to maintain itself as a group over time (Philip and Dunphy, 1959; Schein, 1988). For example, the setting of goals and priorities would be considered task
processes. While group cohesiveness may, in fact, mediate the relationship between demographic dispersion and turnover, its link to performance is less clear (Lott & Lott, 1965). Goodman,
6
Ravlin, and Schminke (1987) suggest that there is no significant proof that cohesiveness is related to performance. While cohesiveness is related to conformity and adherence to group norms, those norms may or may not facilitate performance. Instead, Goodman, et. al., suggest that processes related to task accomplishment will be more predictive of performance in work groups. We also
suggest that the demographic variables used in this study are related to task processes.
Demographic diversity has been shown to increase conflict, reduce cohesion, complicate internal communications and hamper coordination within the team (Dougherty, 1987; Kiesler, 1978; Shaw, 1971; Pfeffer, & O'Reilly, 1987). In other words, diversity is negatively related to many internal processes. The conflict literature predicts intensified intragroup conflict when interdependence exists among parties with different goals (Schmidt & Kochan, 1972) while the group literature points to the difficulty of merging different cognitive styles, attitudes and values (Bettenhausen & Murnighan, 1985; Shaw, 1971), such as those found on teams with diverse members. If not managed effectively this diversity can create internal processes that slow decision making and keep members from concentrating on the task.
The demography literature has concentrated on the negative relationship between tenure diversity and cohesiveness (O'Reilly, et. al., 1989). The argument has been that members arriving in an organization at different times do not have many opportunities for interaction, undergo disparate experiences, develop different perspectives and are therefore not as attracted to one
another as members who arrived at the same time. However, these varying perspectives are also predicted to impede a group's ability to set common goals and priorities. In the realm of product
development, for example, an individual who entered the organization at a time of market expansion will have a different scenario for how to meet customer demands than will someone who entered during a period of market contraction. Reconciling divergent scenarios often impedes a group's ability to negotiate roles, goals, andpriorities (Bettenhausen & Murnighan, 1985; Souder, 1987).
In a similar vein teams made up of individuals from different functional areas or "thought-worlds" may find it difficult to develop a shared purpose and an effective group process
(Dougherty, 1987). Representatives from marketing, manufacturing, and engineering often work from different time orientations, and even have different definitions for basic terms such as product and market (Dougherty, 1987; Lawrence & Lorsch, 1967). In the innovation literature it is readily acknowledged that functionally diverse groups have difficulties reaching agreements on integrated programs of action (see Souder, 1987). Our first hypothesis is consistent with these arguments:
Hypothesis 1: Variation in organizational tenure and functional diversity are negatively related to internal task processes.
Zenger and Lawrence (1989) suggest that external communication is a second mediator of the relationship between demography and performance. In a study of research teams they found that technical communications between team members and engineers not assigned to the project was related to similarity in organization tenure. Although they do not test this idea, Zenger and Lawrence suggest that this communication is related to performance. Thus, in addition to task processes, the amount of external communication is another key mediating group process.
While tenure and functional diversity may make it more difficult for group members to get along and set goals and priorities, this same diversity provides the group with a broad set of external networks and a comfort with outsiders. Given the lack of similar others within the group, members often seek similar outsiders with whom to communicate. For example, Ancona and Caldwell, (1990) found that communication with a particular functional area went up dramatically when a representative of that area became a member of the new product team. In fact, one of the reasons for creating a cross-functional or multi-tenured team is to create easier access to the resources and information of multiple functional areas and historical perspectives (Calantone & Cooper, 1981; Voss, 1985). Based on this reasoning, we propose:
Hypothesis 2: Variation in organizational tenure and functional diversity are positively related to communications with outsiders.
Demography, Group Process, and Performance
Although this study is one of the few to actually test the relationship between demographic and group process variables, our major concern is with group performance. While much of the demography literature examines individual turnover as the key outcomes variable, group
researchers have long been interested in trying to find the composition and process variables that account for variation in performance. It is this latter perspective that we take here. This section identifies the key components of performance, and lays out the direct links between demography and performance as well as the links between process and performance.
This study is ultimately interested in predicting performance. Yet, performance is a multi-faceted construct. That is, performance often has multiple dimensions and ratings vary across constituents (Tsui, 1984). For example, several studies of group performance in organizational settings have demonstrated marked differences between team-member ratings of performance and managerial ratings of performance (Ancona, 1990; Gladstein, 1984). It may be that each
constituent group has different interests and different data available to assess performance. Team members may be more interested in creating a productive environment to do their work while managers are more interested in output. Similarly, team members have access to day to day information about team interaction and may use this data to evaluate performance. Managers are more distant and hence rely on more quantitative data such as budgets and schedules. We shall assume this dichotomy between the two sets of ratings and set up alternative models to predict team-member versus managerial ratings of performance. In addition, we shall include multiple dimensions of performance, (e.g. achieving budgets and developing innovative products), to see if performance is viewed as a unified or differentiated construct,
Having argued that demographic variables influence both a group's task processes and external communications, we can go on to suggest that when group performance is somewhat
dependent upon the group's process and upon its interactions with others, demographic variables should be related to group performance through the mediation of these variables.
New product teams are particularly dependent on processes and communication patterns both inside the group and with outsiders. These teams must obtain information and resources from other parts of the organization, interact internally to create a viable product, and transfer their work to other groups who will build and market the product (Ancona & Caldwell, 1987; Burgleman,
1983; Quinn & Mueller, 1963). Their success is thus dependent both on team member's abilities to communicate with outsiders, and to work with one another. A number of studies have tested this general idea and examined the communication patterns of these groups (Allen, 1984; Ebadi & Dilts, 1986; Ebadi & Utterback, 1984; Katz, 1982; Tushman, 1977, 1979). In general, these studies have concluded that the amount and patterns of communication (particularly technical communication) within the team and between the team and outside groups are related to team performance. For example, more communication between team members and others in the
organization occurred in high-performing development teams than in low-performing teams (Allen, 1984). Tushman (1979) found that communication in high-performing development teams
followed a two-step process; communication "stars" first obtained information from outside the group, then transmitted it to the rest of the group.
These innovation studies would suggest that smooth internal task processes and high levels of external communications are positively related to group performance in new product
teams. However, we have now complicated the model of group performance by examining ratings by both team members and managers. Given that team members have greater access to data on internal team processes, and that they tend to have cognitive schema that link internal
processes rather than external communications to performance (Ancona, 1990; Gladstein, 1984) we posit the following hypothesis:
Hypothesis 3: Internal task processes are positively related to team-rated performance but not to managerial-rated performance.
10
In a similar vein, managers have greater access to external communications, some of which are directed at them, than to internal group processes. In fact, their knowledge of internal processes is often a function of what they hear from group representatives (Ancona & Caldwell, 1988; Tushman, 1979). In addition, evidence from several case studies suggests that managers make more of a link between external communications and performance than between internal task processes and performance (Ancona, 1990), suggesting the following hypothesis:
Hypothesis 4: External communications are positively related to managerial-rated performance but not to team-rated performance.
The first four hypotheses posit relationships between demographic variables, tenure diversity and functional diversity, and performance through the mediation of internal task processes and external communications. That is, there is a two-staged path with diversity relating to group behaviors and those behaviors relating to performance. Yet group researchers have long noted that input factors such as group demography can have direct, as well as
indirect, effects on group performance (Gladstein, 1984; Shaw, 1971; Sundstrom & Altman, 1989).
Group demography, like other group composition variables, has its direct eff & Altmanects through the allocation of resources to a team (McGrath, 1964; 1984). Different configurations of individuals provide different sets of skills, abilities, information, contacts, and knowledge that can help a group to be productive, independent of how those resources are
transformed through group processes (Tziner & Eden, 1985). In fact, one of the reasons to set up diverse teams is to increase the resource pool available to the group.
Tenure diversity provides the team with a range of experiences, information bases, biases, and contacts throughout the organization. Members who have entered the organization at different points in time know a different set of individuals throughout the organization, often
have different technical skills, and different perspectives on the role of history on the
organization. It is proposed that this range of skill and perspective improves the probability that a group will be able to generate innovative solutions (Souder, 1987) and therefore have the potential for higher performance.
Hypothesis 5: Tenure diversity is positively related to team-rated and managerially-rated performance.
The use of cross-functional teams has long been proposed as a method for speeding and improving the product development process (c.f. Calantone & Cooper, 1981; Cooper, 1979; Voss, 1985). Functional diversity offers the team direct access to expertise and information that would not be available if all team members were from the same area. Also, since the team includes representatives from the manufacturing and marketing areas, product transfer will be facilitated. It is proposed that access to these resources will be related to both team and managerial perceptions of performance. Thus we propose:
Hypothesis 6: Functional diversity is positively related to team-rated and managerially-rated performance.
Summary
The purpose of this study is to investigate the impact of a new product team's demography on its performance. As previously noted, demography can affect the internal
process of a group and the way its members communicate with outsiders. In addition, both internal and external behaviors can influence team-rated and managerially-rated performance of new product teams (c.f. Allen, 1984). Finally, group researchers have long noted that input factors such as group composition can have both direct and indirect (mediated by group process) effects on group performance (Gladstein, 1984, Shaw, 1971). This study then
III
12
investigates two things: the direct effects of group heterogeneity on new product team
performance, and the indirect effects of heterogeneity attributable to internal group process and to communication with organization members outside the group boundaries.
This study differs from most other research on group demography in a number of important ways. First, it investigates the intervening processes between demographic patterns and outcomes. The O'Reilly, Caldwell, and Barnett (1989) study did so as well but this goes a step further by looking at processes inside the group and also at interactions with outsiders. Second, this research examines the demographic composition of groups in terms of two variables. One of these, the coefficient of variation of tenure among team members, has been widely used as an index of the variability of group members' tenures within an organization. The second variable we use is the group diversity as defined by individual members' functional assignments. This second variable has not been widely used, but it seems important to new product development teams. Third, in contrast to many previous studies that have looked at individual outcomes (e.g., turnover, communication frequency) and in some cases aggregated them to obtain a group outcome, this study looks at a group-level measurement of performance. Finally, this study uses performance measures from both top management and team members and discusses whether they are predicted by the same relationships among demography and process.
Complex Relationships
The link between demography and performance may not be as straight forward as our hypotheses would indicate. We have complicated our analysis by considering two different demographic variables--tenure homogeneity and functional diversity--and two mediating process variables--task processes and external communications--across multiple performance
indicators. We have also included direct and indirect effects. Complications can occur in that a high level of homogeneity within a group is likely to facilitate task processes (hypothesis # 1 ), but this same homogeneity may act to retard external communications (hypothesis # 2 ). If both
internal and external processes are positively related to performance, then homogeneity may be simultaneously improving and dampening performance. Similarly, functional diversity may negatively influence performance through its impact on task processes (hypotheses # 1 and # 3 ) but simultaneously have a positive direct impact (hypothesis # 6 ). Finally, variables that have a large impact on one aspect of performance, such as achieving budget and schedule, may have no impact on other performance measures, such as innovation. The inclusion of these multiple indicators of demography, process, and performance should allow us to gain further insight into the complex mechanisms throughout which demography affects performance.
Although our expanded set of variables adds complexity, many important variables have been left out. For example, ample research has documented the effect of size and resources on group process and outcomes (Gladstein, 1984; Hackman, 1982; Thomas & Fink, 1963). In addition, studies of research and development teams have documented the impact of task and product characteristics on performance (c.f. Chakrabarti & O'Keefe, 1977; Katz & Tushman,
1979). Including all of these variables would make testing of our key relationships too complex, while omitting them runs the risk of mis-specifying our model (James, Mulaik & Brett, 1983). To deal with this dilemma, we run the models with only size as a control variable, and run separate
analyses to determine what impact these other variables would have if they were included.
METHOD
This section describes the research design and analytical procedures used to examine the relationships among group demography, internal group process, communication with outsiders, and ratings of the groups' performance. All analyses were at the group level and conducted using a sample of product development teams. The data consisted of questionnaires from team members and interviews with team leaders and upper-level managers.
14
Sample
This study involved the leaders and members of 47 new product teams in five
high-technology companies in the computer, analytic instrumentation, and photographic industries. All of the teams were actively working on the development of new products as opposed to basic research. Each was responsible for developing a prototype product and transfering it to the groups
responsible for manufacturing and marketing. For example, one team was developing a product to automate the sampling process used in liquid chromatography, and another was developing a new publishing device that combined photographic and computer imaging processes. Thus each team was actively engaged in technological innovation, yet responsible for ensuring the
manufacturability and marketability of the new product.
Each organization was asked to provide access to a set of teams that had the following characteristics. First, all the teams had to be working on new product development (defined as a major extension to an existing product line or the start of a new product line). Second, to ensure some broad consistency in the complexity of the products, all teams had a development cycle of one and one-half to three years. Third, all the teams had to be located within a single division to assure comparable performance evaluations. Finally, organizations were asked to provide teams that ranged from high to low in performance; however, company executives did not reveal how teams were initially classified until all other data had been collected.
Once the sample of teams was identified, a list of team members was obtained from company records and verified with team leaders. However, group boundaries within organizations are never quite as neat as those in the laboratory. Often, team leaders would be unsure as to whether to include part-time members or those people not formally assigned to the team. The rule we used was to include those people who a majority of team members would consider a member. When asked on the questionnaire most group members indicated agreement with the list of members. The average group size was approximately 10 (s.d. 6.2).
Of the 450 questionnaires distributed to team members and leaders, 409 were returned, yielding a response rate of approximately 89 percent. Response rates were approximately equal across companies; total responses per company varied from 39 to 129. Since this study
investigated group characteristics and outcomes, we aggregated individual questionnaire items focusing on team attributes at the group level. To ensure that individuals had a common referent, team members' names were printed on each questionnaire. Because we were analyzing at the group level, teams were included in the final sample only if at least three-fourths of the members responded. This reduced the number of teams in the final sample to 45.
The average age of the individuals in the sample was 38.6; 88 percent were male; and 75 percent possessed at least a four-year college degree. Approximately 77 percent of the sample were engineering or research and development; the remaining 23 percent were primarily from manufacturing or marketing.
Measures of Group Demography
As Pfeffer (1983) has argued, group demography needs to be assessed in ways that capture the compositional and distributional characteristics of the group rather than by using simple descriptors such as the mean tenure of group members or the proportion of engineers in a group. This study uses two measures of the demographic homogeneity of product team groups: the coefficient of variation of team members' tenure in the organization, and the amount of diversity among the functions to which team members are assigned.
Coefficient of variation of tenure. For interval data such as age or tenure, Allison (1978) and Pfeffer and O'Reilly (1987) suggest that the coefficient of variation (the standard deviation divided by the mean) provides the most direct and scale in-variant measure of dispersion. Thus to assess the relative homogeneity of the tenure of each team's members, each group's standard deviation of tenure was divided by the group mean. The mean coefficient of variation of tenure across the
16
Functional diversity. When data are categorical or the utility of values is irrelevant, a different form of diversity index is appropriate. Both Taagepera and Ray (1977) and Teachman
(1980) recommend an entropy-based diversity index. This measure is defined by Teachman (1980) as:
S
(1) H=-i P i (In Pi).
As Pfeffer and O'Reilly (1987) show, if there are N possible states in which system can be Pi is the probability that the system will be found in state i, then this formula can be used to index the heterogeneity in the system. For our purposes, P represents the fractional share of team members assigned to the functional areas of marketing, manufacturing, or engineering. The only exception to this occurs when a particular area is not represented on the team. In that case, the value assigned that particular state is zero. Using this formula, if a team was made up of nine individuals from engineering, one individual from marketing, and no one from manufacturing, the functional diversity index for that group would be .32. If the group consisted of five engineers, three marketing specialists, and two individuals from manufacturing, the functional diversity index
would be 1.02. Thus, the greater the distribution across functional area, the higher the functional diversity score. For the sample of teams, functional diversity scores ranged from 0 to 1.10 (mean -. 40, s.d. = .38).
Group Measures
Two measures of group activities were obtained: internal group process and communication with external groups. Both of these measures were obtained from questionnaires completed by team members.
Group process. Three items were used to measure members' perceptions of the team's work-related group process. These items rated the team's ability to define goals, develop workable
plans, and prioritize work. Although the demography literature most often specifics group cohesiveness or social integration as the mediating group process, for work teams the argument has been made that processes related to task accomplishment may be more important to
performance then those reflecting affect within the team (Goodman, Ravlin & Schminke, 1987). The three process items were assessed with 5-point Likert scales; high scores indicated that groups could could carry out these processes. These items were formed into a single scale (alpha = .86) by averaging them; these scale scores were averaged across the members of the group to arrive at a team score. The scores averaged 3.69 (s.d. = .43) across the sample of teams.
Communication with other groups. Each member of the team was asked how often he or she communicated with non-team individuals in marketing, manufacturing, engineering, and product or division management over a two-week period. The separate 6-point scales were anchored by 1 = Not at all and 6 = Several times per day. Since these functional groups had different names in the companies, the questionnaires were modified to ensure that
company-specific terminology was used. Because these four groups represented every one with whom team members would normally communicate in their work, these responses were averaged. Team scores were computed by averaging the individual scores (mean = 2.54, s.d. = .78).
There has been a debate in the literature as to whether organizational members can accurately assess their communication patterns. Bernard, Killworth, and Sailer (1980) and Bernard,
Killworth, Kronenfeld, Sailer, (1985), claim that asking people who they talk to, how much, produces totally inaccurate results. Individuals forget some communications and over count others. Other researchers have countered this criticism by showing that organization members may not reproduce exactly the communications that have just occurred, but their bias is in the direction of long-term patterns of communication (Freeman, Romney and Freeman, 1987). So respondents are not actually answering the question "Who did I speak to in the last two weeks" but "In a typical two-week period, with whom am I likely to have spoken." Since this more general pattern of communication is what we are interested in, the one-time rating scale rather than communication diary was used.
18
Measures of Team Performance
Top division managers in each company were asked to assess the teams in their company; using 5-point Likert scales, they rated each team's efficiency, quality of technical innovations produced, adherence to schedules, adherence to budgets, ability to resolve conflicts, and overall performance. When more than one manager made these evaluations, their ratings were averaged. Although the sample size was relatively small, the performance measures were subjected to a principal components analysis to identify an underlying pattern. Two factors emerged: ratings of quality of technical innovations, ability to resolve conflict, and efficiency clustered together, as did adherence to schedules and adherence to budgets. Overall performance related to both and was therefore eliminated from the analysis. Based on this analysis, two measures of management-rated performance were developed. Adherence to budgets and schedules was measured by averaging the two relevant items (alpha = .87) and efficiency in developing technical innovations was defined as the average of the remaining three questions (alpha = .76). The ratings of adherence to budgets
and schedules averaged 3.05 (s.d. = .98); and efficiency in developing technical innovations averaged 3.31 (s.d. = .83). Although these measures were correlated, discussions with the evaluating managers suggest that they represent conceptually distinct definitions of performance.
Team members were also asked to rate the performance of their teams on six dimensions including efficiency, quality, technical innovation, adherence to schedules, adherence to budgets, and work excellence. These items were completed by all individuals, so a principal components analysis of the items was conducted. Since this analysis yielded a single factor, the six items were averaged to form an overall measure of each individual's perception of the team's performance ( alpha = .83). A score was assigned to each team by averaging individual responses (mean = 3.50, s.d. = .41).
Control Variables
One important variable that has been established in group research is group size. Since size indirectly influences the potential magnitude of the coefficient of variation and may affect group process and communication, it was included in the analysis (mean = 9.56, s.d. = 6.27).
Many other factors can affect either group process or performance. In structured interviews with the leaders of each team, we assessed a number of these in an attempt to eliminate alternative interpretations. It should be noted that this set of control variables is not complete and that the sample size prevents the simultaneous testing of even this limited set of variables.
The first of these variables is the availability of resources. In an environment where resources are highly constrained, a different process or pattern of communications may develop than in one where resources are widely available. Also, the amount of resources may directly influence a team's performance (Gladstein, 1984). To assess this, team leaders were asked to describe the availability of financial, personnel, and equipment resources on separate 5-point scales. An overall measure of resource availability was obtained by averaging these three questions (mean = 2.90, s.d. = .86).
The second variable is the extent to which the product under development is a revolutionary development, as opposed to an incremental improvement of an existing product. As Dewar and Dutton (1986) have observed, different models may be necessary to explain radical and incremental innovations. When a product is revolutionary, the team may have different patterns of
communication with other groups than when a product uses a known technology (Brown & Utterback, 1985). This was measured with a single 5-point question (mean = 2.96,
s.d. = 1.18).
The third variable is the extent to which the new product will face competition in the marketplace. High levels of competition may reduce predictability and increase uncertainty
(Abernathy & Clark, 1985; Duncan, 1972), thereby influencing process. A single 5-point question was used to assess this variable (mean = 4.12, s.d. = 1.14).
20
The final control variable is the experience of the company in developing similar products or using similar technologies. Previous experience may shape both the composition of a team and the nature of the group's work. As with the previous control variables, this was assessed with a single 5-point question asked during the team manager interview (mean = 3.00, s.d. = 1.48). For all interview questions, high scores indicate high levels of the particular variable.
Analysis
We used path analysis to examine the direct effects of group demography and group process on performance, and the extent to which process variables mediate the relationship between demography and performance. The model being tested posits a causal relationship from: (1) the demography variables to performance; (2) the process and communication variables to
performance; and (3) the demography variables to process and communication. Drawing from Duncan (1972) and James, Mulaik, and Brett (1983), we adopted the following equation for decomposing the association between demography and performance:
(2) r(demography, performance) = Direct effect + Indirect effect + Unanalyzed spurious relationship
The total association between the demographic variables and performance measures is given by their zero-order correlations. The direct effect of demography on performance is the part of the total effect that is not transmitted via the mediating variables of process and communication. The indirect effect of the group demography variable on performance is that part of the total effect that is mediated either by process or communication. The spurious (i.e., non-causal) effect of each demographic variable is due to its unanalyzed correlations with all remaining independent variables (James, Mulaik & Brett, 1983; Prescott, Kohli & Venkatraman, 1986).
This analysis involves three steps. The first step entailed computing the correlation between the demography and performance variables to ascertain the total association between each
combination. In the second step, we performed two sets of ordinary least squares regressions. In the first set, each process variable was regressed against the coefficient of variation of tenure (c.v. tenure) and functional diversity. The resulting standardized beta values represent the path
coefficients of the paths from the demographic variables to the process variables. In the second set of regressions, each performance measure was regressed against the two demography variables (c.v. tenure and functional diversity) and the two group process variables (internal process and external communication). The standardized beta values represent path coefficients showing the direct paths from demography to performance and from process to performance. The third step in the analysis involved decomposing the correlations between demography and performance
variables. Once the direct and indirect effects were obtained, we calculated the spurious effects by subtracting the causal effects from the correlation coefficients. This analysis allows us to identify the specific nature of the relationships between the two demography variables and performance.
RESULTS
Table 1 shows the correlations among group demography, group process, and performance variables. Before examining the relationships among constructs, we look at the relationships among variables within constructs. Several factors are worth noting. The relationship between ratings of efficiency in developing technical innovations and adherence to budgets and schedules was strong (r = .42, p < .01), albeit not strong enough to be redundant measures. Despite the high correlations we retained both measures in later analyses because of their conceptual distinctiveness. Of some interest, the team-member ratings of team performance showed significant relationship only with the management ratings of innovation not with budget and schedule.
The two demographic measures, c.v. tenure and functional diversity, were negatively related (r = - .33, p < .05). High scores on these variables indicate greater heterogeneity; thus this
22
correlation suggests that groups with individuals from diverse functions had greater homogeneity of tenure than groups with less functional diversity, and vice versa. There was also a small, insignificant negative relationship between the two process variables.
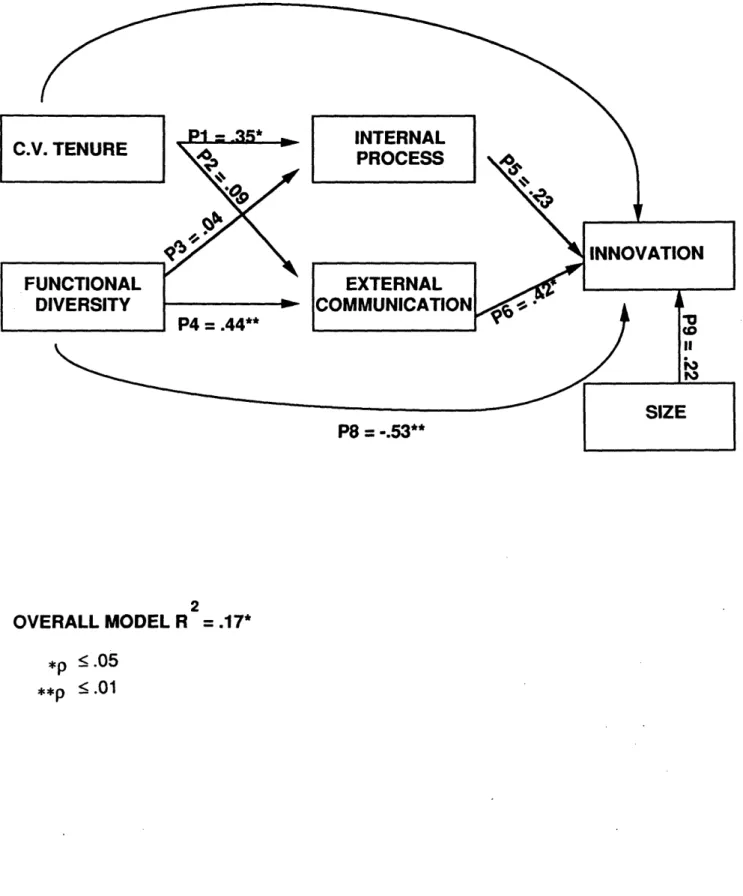
We used both correlational and path analysis to investigate our hypotheses. We used path analysis to more fully explore the relationships among group demography, group process, and performance variables. We ran separate models for each of the three performance measures. To ensure that the assumptions of path analysis were met and that the models being tested were not misspecified, scatter plots of the residuals were examined. Since the patterns of residuals were random and contained few outliers, the use of path analysis seemed appropriate. Figures 1
through 3 show the results of these analyses. Regression equations testing the full models indicate that significant variance was explained in management ratings of efficiency at developing technical innovations (R2 = .17, p < .05), but not in adherence to budgets and schedules (R2 = .07, n.s.). The equation explaining team ratings of performance was also significant (R2 = .34, p < .001). The path coefficients tell us more about the nature of the influence of demography. Combined with
the correlational analyses they show the degree of support for our hypotheses.
Hypotheses one and two link demographic variables to group process. Diversity of tenure and functional background is predicted to be negatively related to internal task processes and positively related to external communications. Correlational analyses indicate that the measures of group demography were related to the process variables. However, the hypotheses were only partially supported. Rather than both diversity measures having the same impact on each group process, each measure influenced only one process. Contrary to hypothesis #1, the coefficient of variation of tenure was related to reports of effective task processes within the group (r = .30, p < .05), while functional diversity did not significantly affect task processes. In support of
hypothesis #2, high levels of functional diversity were associated with high levels of external communication (r = .40, p < .01). However, tenure diversity had no significant effect on external
communication.
The path coefficients between the demography and process variables shown in the figures are consistent with the zero-order correlations. Significant path coefficients were found between c.v. tenure and internal process (P1 = .35, p < .05) and between functional diversity and external communication (P4 = .44, p < .01). The indirect influence of the demographic variables on performance is realized only if the process variables, in turn, are related to the performance
variables. Hypothesis #3 posits a positive relationship between internal task processes and team-rated performance while hypothesis #4 posits a positive relationship between external
communication and managerially-rated performance. Correlational analysis (see Table 1) supports both hypotheses. Internal task processes were positively related to team-rated performance (r = .54, p < .001), but not to the other measures of performance. The frequency of group member communication with outsiders was negatively related to team ratings of performance (r = -.33, p < .05), and marginally related to managerially ratings of teams' efficiency in introducing
innovations (r = .21, p < .10).
Path analyses mirror the correlational findings but are somewhat stronger. Significant path coefficients were found between internal task processes and team-rated performance (Figure 3: P5 = .57, p < .001). Amount of external communication is positively related to management ratings of a team's technical innovations (Figure 1 : P6 = .42, p < .05). These results, coupled with the tests of hypotheses #1 and #2, suggest that c.v. tenure indirectly influences team-rated
performance through its impact on internal processes, while functional diversity indirectly influences innovation through its impact on external communications.
In addition demographic variables are also predicted to have positive and direct effects on performance. Hypothesis #5 posits a positive relationship between tenure diversity and both team
and managerial ratings of performance while hypothesis #6 posits a positive relationship between functional diversity and these same performance measures. In contrast to our hypotheses, the diversity measures were negatively related to performance. Correlational analysis shows that variation of group tenure was negatively related to management ratings of adherence to budgets and schedules (r = -.43, p < .05). Functional diversity was negatively related to management ratings
24
of technical innovations (r = -.27, p < .05). In addition, functional diversity was negatively related to team-rated performance (r = -.29, p < .05). Path analysis also showed negative relationships between diversity and performance measures. More specifically, figure 1 shows a direct, negative effect of functional diversity on managerially-rated innovation (P7 = -.53, p < .01) while figure 3 shows a direct, negative effect of functional diversity on team-rated performance (P8 = -.28, p <
.05).
The pattern of direct and indirect relationships is shown in Table 2, which breaks down the covariance between each demographic and performance variable into direct, indirect, and spurious effects. These results show that, although demographic variables have indirect effects on
performance, these are often dwarfed by direct effects. Furthermore, the direct effects are often in the opposite direction of the indirect effects. For example, functional diversity has an indirect, positive effect through external communications, but this indirect effect is overshadowed by the direct, negative effect (P8 = - .53, p < .01) of functional diversity on innovation. So while diversity is positively associated with external communication, which in turn, is positively associated with innovation, functional diversity is related to lower ratings of innovation, either through a direct effect or through some other process not included in this model.
Table 2 also shows that some demography-performance variables are better explained than others. For example, the covariance between functional diversity and innovation, and between functional diversity and team-rated performance, are well explained by both direct and indirect effects. In contrast, the unexplained variance between tenure variation and innovation, and
functional diversity and budgets and schedules is above .1. It is interesting that, in this latter case, the small correlation between functional diversity and budgets and schedules (r = -.01) masks a large negative direct causal relationship that is diluted by a positive indirect causal relationship
through external communications. Although two sets of relationships show spurious variance over .10, our major effort here was not to reproduce the correlation matrix, but to understand the
comparative contribution of direct versus indirect effects. III
As previously noted, a number of other variables could influence the relationships among demography, process, and performance. While we included size in all the analyses because of its obvious effects on c.v. tenure and functional diversity, we did not include resource availability, the degree to which the product was revolutionary, the degree of competition the product will face, and the experience of the company in developing similar products. As seen in Table 3, none of these variables displayed a pattern of strong relationships with the variables included in the model. When the analyses were repeated using each of these control variables in place of size, the results were generally consistent with those reported. The one exception to this pattern occurred when resource availability was included in model predicting budgets and schedules. In that analysis, the model predicting rated adherence to budgets and schedules explained 18 percent of the total
variance (p < .10). After controlling for resource availability, the path coefficient of c.v. tenure is negatively and directly associated with achieving budgets and schedules (P = -.43, p < .05), suggesting that homogeneity in tenure is associated with achieving budget and schedule.
DISCUSSION
The increasing reliance on teams to develop new products raises a variety of questions. One important set of questions relates to how the teams should be formed. For example, should they be formed completely of engineers, or should they include a range of specialists from other
functional areas? Similarly do teams perform best when they are made up of people who have long tenure in the organization, or when they are made up of people who represent a wide range of experience?
This study attempts to answer some of these questions by extending the application of theories of group demography to product development teams. Four results stand out for their contribution to theory development and their implications for managing new product teams. First, performance turns out to be a multi-faceted construct so that multiple models are needed to explain
26
the different kinds of performance. Second, although the literature predicts that diversity, in general, will have an impact on process and performance, results in this study indicate that tenure diversity and functional diversity each have their own distinct effects. Third, while the
demography literature links diversity to group cohesiveness, this study suggest that internal task processes and external communication are also key processes that mediate the link between demography and performance. Finally, although most demographic models posit that
demographic variables have their largest impact through the mediation of group processes, in this study the direct effects of diversity are greater than the mediated effects, and those direct effects are negative.
Performance
This study is ultimately interested in predicting performance. Yet, as in other studies of performance (Tsui, 1984), we found it to be a multi-faceted construct. That is, performance has multiple dimensions and ratings vary across constituents. Top management differentiates between efficiency in producing innovations and achieving budget and schedule. As the push to speed product development continues we may have to keep in mind that this may call for trade-offs with other dimensions of performance such as innovation.
There is little or no relationship between team-rated performance and management-rated performance. It may be that each constituent group has different interests and different data available to assess performance. Team members may be more interested in creating a productive environment to do their work, while managers are more interested in output. Similarly, team members have access to day to day information about team interaction and may use this data to evaluate performance. Managers are more distant and hence rely on more quantitative data such as budgets and schedules.
Demographic Variables
Although hypotheses #1 and #2 posit the same impact on process and performance from both tenure and functional diversity, each demographic variable seems to operate in a distinct way. The more heterogeneous the group in terms of tenure, the greater the clarity of the group's goals and priorities. In turn, this clarity is associated with high team ratings of overall performance. In contrast, greater functional diversity is associated with more external communication. The more external communication team members have with other groups, the higher the managerial ratings of team innovation. In terms of direct linkages, tenure diversity has a significant and negative effect on budget and schedule, while functional diversity has a significant and negative effect on team-rated performance and managerially-team-rated innovation.
Taken together, these findings show the complexity with which the demography of a group can influence outcomes. Further, they suggest that our models of group demography have to become more clearly specified with respect to type of diversity, the type of group process under
investigation, the performance being assessed, and perhaps even the nature of the group's task. It also suggests the need for some speculation on why tenure diversity and functional diversity each had the impact that it had.
At first glance, the relationship we observed between heterogeneity and internal group process is not consistent with that reported by O'Reilly, Caldwell, and Barnett (1989), nor with hypothesis #1. O'Reilly et al found that. tenure homogeneity was positively associated with the group process variable of social integration, while we found it was negatively associated with a different measure of process, one more related to an ability to define and prioritize goals. On reflection, these different effects of diversity of tenure are not surprising. Individuals who enter an organization at the same time are likely to share a common perspective and to have undergone a similar set of experiences. These factors are likely to increase the frequency of communication among members and the attraction the members have for one another (Festinger, 1954; Hoffman,
28
assess priorities, a group may do better with multiple experiences and perspectives that help it to define goals more in line with complex demands placed upon it. This is particularly likely with groups such as product development teams, which must operate in complex environments and respond to frequently conflicting demands. It is not at all clear why functional diversity did not have a similar effect.
Our finding that the functional diversity of a team is related to the frequency of external communication supports hypothesis #2. One would expect representatives of a functional group to have more contacts and greater ease of communication with members of that same group given
their shared language, socialization, and worldview (Dougherty, 1987; Lawrence & Lorsch, 1969). This result complements those of Zenger and Lawrence, (1989) who found that within a single functional area, homogeneity was associated with communication, even across team
boundaries. Apparently functional diversity is a better predictor of ease of communication outside the group than is tenure diversity. Professional training may have a greater impact on language and worldview than organizational socialization.
New Mediating Variables
While the bulk of the demography literature posits cohesiveness as the key mediating
variable between diversity and performance, with the support of hypotheses #3 and #4, we show that the small group's literature is accurate in proposing internal task processes and external
communication as additional mediating variables. As predicted, however, each process has a distinct effect on performance.
As in other studies.of work groups, internal process is related to team ratings of performance (c.f. Gladstein, 1984). That is, teams that rate themselves as having clear goals and priorities also rate themselves as innovative, efficient, good at adhering to budgets and schedules, and as good overall performers. A number of explanations for this connection are possible. Members may be
labeling their team as high performing if it exhibits the processes thought to be linked to III
performance (Calder, 1977; Gladstein, 1984; Staw, 1975). Alternatively, members who view their team as effective may attribute effective processes to it. This relationship between process and performance does not hold when external measures of performance are used.
In contrast, top management ratings of innovation are related to the frequency of team members' external communications. External communications may be of a technical nature, allowing the team to improve the quality of their product (Allen, 1984). Alternatively, they may be geared toward profile management, whereby team members try to influence key outsiders to promote and support their product (Ancona & Caldwell, 1988). Finally, it may be that teams that know they have the support of top management may be more willing to communicate with others. Thus, task processes mediate the relationship between tenure diversity and team reatings of performance, while external communicators mediate the relationship between functional diversity and management ratings of innovation.
Direct Versus Indirect Effects
Although there is evidence of demography's indirect effect on performance through group process, this study presents even stronger evidence of demography's direct effect on
performance. In direct contrast to hypotheses #5 and #6, however, the direct effects of diversity on performance are all negative. High levels of functional diversity.were directly
associated with lower levels of performance, particularly for management ratings of innovation, and for teams' ratings of their own performance. Diversity of tenure shows a similar, albeit less strong, negative relationship with performance. These results are consistent with those of O'Reilly and Flatt (1989), showing a direct relationship between homogeneity and an organizational measure of innovation.
What can account for this contradictory effect of diversity particularly as it relates to innovation? On the one hand, it produces processes that facilitate performance, and on the other hand it directly impedes performance. As O'Reilly and Flatt (1989) note, innovation in
30
organizations requires two distinct sets of activities: creative problem solving and implementation of the new process. As they further suggest, the process of innovation is likely to generate conflict and confusion. It may be that potential for creative solutions inherent in a diverse group are
outweighted by the disadvantages such a group might have in developing the flexibility and teamwork necessary to implement a change in existing processes.
This raises the possibility that the negative direct effects may be a statistical artifact resulting from a missing mediating variable that negatively links demography and performance. One possibility is that diverse teams are able to develop goals and priorities, but not implement them
because of the conflict different perspectives create. A second possibility is that diversity allows for high levels of external communication but also reduces the social integration to such a level that the group cannot effectively make use of the information and resources obtained from others. For example, if we rerun the model using measures of cohesiveness rather than the more task-oriented measures of process, functional diversity is negatively and significantly related to cohesiveness. Thus diversity impedes social integration. Third, diverse teams may have better processes and linkages within the organization, yet this visibility opens the team up to the political and goal conflict that exists among functions. As such, the team becomes a forum for the rest of the organization to play out its conflicts, and performance suffers. Finally, it may be that diversity allows a lot of downstream activity to take place earlier in the product development cycle. As the team is tackling this larger set of activities, earlier, it may not seem to be as efficient and innovative as more homogeneous teams. In the long-term, however, these teams may show clear advantages. Longitudinal research is needed to test this assertion.
Applications and Limitations
From a managerial perspective these research findings suggest that simply changing the structure of teams (i.e. combining representatives from diverse functions and years) will not
improve performance. The team must find a way to garner the positive process effects of
diversity and to reduce the negative direct effects. At the team level, training and facilitation in negotiation and conflict resolution may be necessary to allow members to integrate the diverse perspectives and information flowing into the group. At the organization level, the team may need to be protected from external political pressures and rewarded for team, rather than functional, outcomes. Finally, diverse teams may need to be evaluated differently than
homogeneous teams. As other research shows, diversity may slow progress in the short-term, but allow for greater innovation and speed over the full development cycle (Ancona, 1990). Therefore, these teams should not be judged on their short-term performance.
The pattern of results found in this study is quite consistent across contexts. Most of the time, irrespective of technological uncertainty (degree to which the product is revolutionary), market uncertainty (degree of competition), organizational uncertainty (extent of the company's experience with the product), and size of the team, these relationships hold.
In interpreting the results of this study, certain limitations must be kept in mind. It should be noted that the sample of teams is limited to product development teams working with state-of-the-art technology. Therefore, although there is variance in the control variables, this sample of teams faces rather high uncertainty relative to other kinds of groups. In addition, the
processes and demographic variables shown to be influential in these teams may not be the same as those needed for less complex tasks in more certain environments. Also, although we have data from 409 individuals, they represent 45 teams, thus limiting the complexity of the models that can be tested. The study is further limited by its use of subjective performance ratings and of cross-sectional data. While managerial ratings of performance may be those used to make budget and promotion decisions we have no idea whether these ratings, or team ratings for that matter, are related to new product sales or actual product quality. We have assumed that demography influences process and that both demography and process influence performance. However, over time, there is a possibility that the causal pattern could change. For example, performance could influence the composition of a team. It may be that a team with performance problems is assigned new members in the hopes that those new members can resolve the team's
32
problems. This new assignment roster would account for the negative relationship between performance and diversity.
Despite these limitations, this study demonstrates the importance of more fully understanding the relationships between product team formation, the actions team members take, and the performance of the team. First, these results provide empirical evidence
supporting the notion that group demography influences performance directly, but also through group process. Second, the study illustrates that different kinds of diversity influence particular aspects of group process and performance. Finally, this research and other studies like it can expand knowledge about how best to form and support product development teams.
REFERENCES
Abernathy, W.J. & Clark, K. 1985. Innovation: Mapping the winds of creative destruction.
Research Policy, 14: 3-22.
Allen, T. 1984. Managing the flow of technology: Technology transfer and the
dissemination of technological information within the R&D organization,
Cambridge, MA: M.I.T. Press.
Allison, P.D. 1978. Measures of inequality. American Sociological Review, XLIII, 865-880.
Ancona, D.G. 1987. Groups in organizations: Extending laboratory models. In C. Hendrick (Ed.), Annual review of personality and social psychology: group and
intergroup processes, Beverly Hills, CA: Sage.
Ancona, D.G. 1990. Outward bound: Strategies for team survival in the organization, forthcoming in Academy of Management Journal.
Ancona, D.G. & Caldwell, D.F. 1987. Management issues facing new-product teams in high technology companies. Advances in Industrial and Labor Relations, 4, Greenwich, Ct: JAI Press.
Ancona, D.G. & Caldwell, D.F. 1988. Beyond task and maintenance: Definming external functions in groups. Group & Organization Studies, 13: 468-494.
Ancona, D.G. & Caldwell, D.F. 1990. Improving the performance of new product teams.
Research Technology Management, March-April, 33: 25-29.
Bernard, H.R., Killworth, P.D. & Sailer, L. 1980. Informant accuracy in social network data, IV: A comparison of clique-level structure in behavioral and cognitive data. Social
Networks, 2: 191-218.
Bernard, H.R., Killworth, P.D., Kronenfeld, D. & Sailer, L. 1985. On the validity of retrospective data: The problem of informant accuracy. Annual Reviews in
34
Bettenhausen, K. & Murnighan, J.K. 1985. The emergence of norms in competitive decision-making groups. Administrative Science Quarterly, 30: 350-372. Brown, J. & Utterback, J. 1985. Uncertainty and technical communication patterns.
Management Science, 31: 301-311.
Burgelman, R. 1983. A process model of internal corporate venturing in the diversified major
firm. Administrative Science Quarterly, 28: 223-244.
Calantone, R. & Cooper, G. 1981. New product scenarios: Prospects for success. Journal of
Marketing, 45: 48-80.
Calder, R. J. 1977. An attribution theory of leadership. In B. M. Staw and G. R. Salancik (Eds.), New Directions in Organizational Behavior, 179-204. Chicago: St. Clair. Chakrabarti, A.K. & O'Keefe, R.D. 1977. A study of key communicators in research and
development. Group and Organization Studies, 2: 336-346.
Cooper, R.G. 1979. The dimensions of industrial new product success and failure. Journal of
Marketing, 43: 93-103.
Dougherty, D. 1987. New products in old organizations: The myth of the better
mousetrap in search of the beaten path. Ph.D. Dissertation. Sloan School of
Management, M.I.T.
Dewer, R. & Dutton J. 1986. The adoption of radical and incremental innovations: An empirical analysis. Management Science, 32: 1422-1433.
Duncan, R. 1972. Characteristics of organizational environments and perceived environmental uncertainty. Administrative Science Quarterly, 17: 313-327.
Easterlin, R.A. 1980. Births and fortune: The impact of numbers of personal
welfare. New York: Basic Books.
Ebadi, Y. & Dilts, D. 1986. The relation between research and development project performance and technical communication in a developing country. Management Science, 32: 822-830.
Ebadi, Y. & Utterback, J. 1984. The effects of communication on technological innovation.
Management Science, 30: 572-585.
Festinger, L. 1954. A theory of social comparison processes. Human Relations, 1: 117-140. Freeman, L., Romney, A. K. & Freeman, S.E. 1987. Cognitive structure and informant
accuracy. American Anthropologist, 89: 310-325.
Gladstein, D.L. 1984. Groups in context: A model of task group effectiveness.
Administrative Science Quarterly, 29: 499-517.
Goodman, P.S., Ravlin, E., & Schminke, M. 1987. Understanding groups in organizations. In L.L. Cummings & B.M. Staw (Eds.), Research In Organizational Behaviors 9: 1-71. Guttentag, M. & Secord, P.F. 1983. Too many women: The sex ratio question.
Beverly Hills, CA: Sage.
Hackman, J.R. 1983. A normative model of work team effectiveness.
Technological Report #2, School of Organization and Management, Yale University.
Research Program on Group Effectiveness (November).
Hoffman, E. 1985. The effect of race-ratio composition of the frequency of organizational communication. Social Psychological Quarterly, 48: 17-26.
James, L.R., Mulaik, S.A. & Brett, J.M. 1983. Causal analysis: assumptions, models,
and data. Sage Publications, Inc.
Katz, R. 1982. The effects of group longevity on project communication and performance.
Administrative Science Quarterly, 27: 81-104.
Katz, R. & Tushman, M.R. 1979. Communication patterns, project performance, and task characteristics: An empirical evaluation and integration in an R&D setting. Organizational
Behavior and Human Performance, 23: 139-162.
Kiesler, S.B. 1978. Interpersonal processes in groups and organizations. Arlington Heights, IL: AHM Publishing.
Lawrence, P.R., & Lorsch, J.W. 1967. Managing differentiation and integration. Homewood, IL: Richard Irwin.