HAL Id: hal-01953902
https://hal.inria.fr/hal-01953902
Submitted on 13 Dec 2018HAL is a multi-disciplinary open access archive for the deposit and dissemination of sci-entific research documents, whether they are pub-lished or not. The documents may come from teaching and research institutions in France or abroad, or from public or private research centers.
L’archive ouverte pluridisciplinaire HAL, est destinée au dépôt et à la diffusion de documents scientifiques de niveau recherche, publiés ou non, émanant des établissements d’enseignement et de recherche français ou étrangers, des laboratoires publics ou privés.
Impact of genetic drift, selection and accumulation level
on virus adaptation to its host plants
Elsa Rousseau, Lucie Tamisier, Frédéric Fabre, Vincent Simon, Marion
Szadkowski, Olivier Bouchez, Catherine Zanchetta, Gregory Girardot, Ludovic
Mailleret, Frédéric Grognard, et al.
To cite this version:
Elsa Rousseau, Lucie Tamisier, Frédéric Fabre, Vincent Simon, Marion Szadkowski, et al.. Impact of genetic drift, selection and accumulation level on virus adaptation to its host plants. Molecular Plant Pathology, Wiley, 2018, 19 (12), pp.2575-2589. �10.1111/mpp.12730�. �hal-01953902�
‡Present address: IBM Almaden Research Center, San Jose CA, USA
§Present address: Plant Pathology Laboratory, TERRA-Gembloux Agro-Bio Tech, University of
Liège, Passage des Déportés, 2, 5030 Gembloux, Belgium
Impact of genetic drift, selection and accumulation level on virus
adaptation to its host plants
ELSA ROUSSEAU1,2,3†‡, LUCIE TAMISIER1,4†§, FREDERIC FABRE5, VINCENT SIMON1,6,
MARION SZADKOWSKI4, OLIVIER BOUCHEZ7, CATHERINE ZANCHETTA7, GREGORY
GIRARDOT1, LUDOVIC MAILLERET2,3, FREDERIC GROGNARD2, ALAIN PALLOIX4,
BENOIT MOURY1,*
1Pathologie Végétale, INRA, 84140 Montfavet, France
2Université Côte d'Azur, Inria, INRA, CNRS, UPMC Univ. Paris 06, Biocore team, Sophia
Antipolis, France
3Université Côte d'Azur, INRA, CNRS, ISA, Sophia Antipolis, France
4GAFL, INRA, 84140 Montfavet, France
5UMR SAVE, INRA, Villenave d'Ornon, France
6UMR BFP, INRA, Villenave d'Ornon, France
7INRA, US 1426, GeT-PlaGe, Genotoul, Castanet-Tolosan, France.
†co-first authors
§Present address: Plant Pathology Laboratory, TERRA-Gembloux Agro-Bio Tech, University of
Liège, Passage des Déportés, 2, 5030 Gembloux, Belgium
*Correspondence: Email: [email protected]
Running head: Impact of genetic drift on PVY adaptation
Keywords : genetic drift, selection, effective population size, viral load, resistance breakdown, eIF4E, plant breeding
Summary word count: 249 words
SUMMARY
The efficiency of plant major resistance genes is limited by the emergence and spread of resistance-breaking mutants. Modulating the evolutionary forces acting on pathogen populations constitutes a promising way to increase the durability of these genes. We studied the effect of four plant traits affecting these evolutionary forces on the rate of resistance breakdown (RB) by a virus. Two of those traits correspond to virus effective population sizes (Ne), either at plant inoculation or
during infection. The third trait corresponds to differential selection exerted by the plant on the virus population. Finally, the fourth trait corresponds to within-plant virus accumulation (VA). These traits were measured experimentally on Potato virus Y (PVY) and a set of 84 pepper doubled-haploid lines, all carrying the same pvr23 resistance gene but having contrasted genetic
backgrounds. The lines showed extensive variation for the rate of pvr23 RB by PVY and for the four
other traits of interest. A generalized linear model showed that three of these four traits, with the exception of Ne at inoculation, and several of pairwise interactions between them had significant
effects on RB. RB increased when Ne during plant infection or VA increased. The effect of
differential selection was more complex because of a strong interaction with VA. When VA was high, RB increased as the differential selection increased. An opposite relationship between RB and differential selection was observed when VA was low. This study provides a framework to select plants with appropriate virus-evolution-related traits to avoid or delay resistance breakdown.
INTRODUCTION
Resistance to pathogens, defined as the capacity of a host to decrease its pathogen load (Råberg et al., 2007; Restif and Koella, 2004), is widespread in plants. However, resistance efficiency, specificity and genetic determinism are highly variable across genotypes of a given plant species. Up to date, plant breeders have mostly created resistant cultivars using resistance mechanisms showing monogenic inheritance and a high efficiency level, often called ‘qualitative resistance’. Unfortunately, the protection conferred by such resistance genes is often poorly durable and resistance ‘breakdowns’ caused by pathogen evolution can be frequent and rapid (García-Arenal and McDonald, 2003; McDonald and Linde, 2002). In the case of viruses, the breakdown of a major resistance gene recently introgressed into commercial plant cultivars and used by growers can be schematically divided into three major steps (Gómez et al., 2009; Moury et al., 2011). If we assume that no resistance-breaking variant is initially present, the first step is the appearance of such variants from a wild-type (WT) virus population. The second step is within-plant colonization and accumulation of the resistance-breaking variants in competition with the rest of the virus population (i.e. WT variants). The last step is the transmission of the resistance-breaking variants to other plants, allowing epidemics to develop in plant cultivars carrying the resistance gene. Different evolutionary forces rule these three steps. The appearance of resistance-breaking variants usually involves a small number of nucleotide substitutions in the so-called avirulence factor encoded by the viral genome (Harrison, 2002; Moury et al., 2011). More rarely may recombination be required for this step (Díaz et al., 2004; Miras et al., 2014). Then, accumulation of the resistance-breaking variants within plants depends on selection and genetic drift. Selection favors the variants with highest fitness, i.e. growth rates when considering the within-plant scale, increasing their frequency over time. This deterministic force is usually evaluated with the selection coefficient, defined as the difference in fitness between two variants. By contrast, genetic drift acts in the same way on all variants of the population, introducing random fluctuations in the dynamics of variant frequencies (Charlesworth, 2009). This stochastic force is commonly evaluated with the effective population size Ne, defined as the size of an idealized population (i.e. a panmictic population of constant size
with discrete generations) that would show the same degree of randomness in the evolution of variant frequencies as the observed population (Kimura and Crow, 1963; Wright, 1931). In plant viruses, the intensity of genetic drift is modulated by bottlenecks occurring at multiple steps of virus infection (Sacristán et al., 2003; French and Stenger, 2003; Gutiérrez et al., 2010, 2012; Zwart and Elena, 2015). Modeling approaches have estimated that the evolutionary forces acting at the within-plant scale, especially the mutational pathway involved in resistance breakdown and the fitness cost
associated with the resistance-breaking mutation(s) accounted for about 50% of the risk of resistance breakdown in the field (Fabre et al., 2009, 2012b, 2015). Experimental data have shown that these two factors were indeed good predictors of the risk of resistance breakdown (Fabre et al., 2012a; Harrison, 2002; Janzac et al., 2009). The remaining 50% depended on factors related to virus epidemiology and thus mostly to step 3 of resistance breakdown.
One way to avoid or delay the breakdown of monogenic qualitative resistances is to combine the resistance gene with a suitable genetic background. Combined with a partially-resistant genetic background, a major resistance gene can show a significant increase in durability, as demonstrated experimentally for resistances targeting an RNA virus (Palloix et al., 2009), a fungus (Brun et al., 2010) or a nematode (Fournet et al., 2013). Indeed, the host genetic background can affect the level of resistance to pathogens and the intensity of different evolutionary forces undergone by pathogen populations (Lannou, 2012). In the case of the Potato virus Y (PVY, genus Potyvirus, family Potyviridae) - pepper (Capsicum annuum; family Solanaceae) pathosystem, Quenouille et al. (2013, 2015) showed a significant correlation between the breakdown frequency of a major resistance gene (the pvr23 gene, encoding a eukaryotic translation initiation 4E – eIF4E) and the capacity of the
virus to accumulate in the plant, i.e. the additional resistance level conferred by the plant genetic background. Assuming identical virus mutation rate between plant genotypes, they hypothesized that within-plant virus accumulation was linked to the total number of virus replications during plant infection and consequently to the probability of appearance of the resistance-breaking mutations. Using a progeny of pepper genotypes carrying the same major resistance gene but contrasted genetic backgrounds, Quenouille et al. (2014) mapped quantitative trait loci (QTLs) controlling either within-plant virus accumulation or the frequency of breakdown of the major resistance gene in the pepper genome. The two QTLs controlling virus accumulation colocalized with QTLs controlling the frequency of breakdown of the major resistance gene, which provided a genetic explanation for the observed correlation between the two traits. Further, by comparing two pepper genotypes carrying the same major resistance gene associated with either a partially-resistant or a susceptible genetic background, Quenouille et al. (2013) showed that the selection of the most adapted resistance-breaking PVY mutants was slower and/or rarer in the plants with a partially-resistant genetic background than in those with a susceptible genetic background. This slower and/or rarer selection may result from (i) the smaller selection coefficient of the adapted mutants and/or (ii) a higher genetic drift in the plants with a partially-resistant genetic background (Charlesworth, 2009; Feder et al., 2016; Quenouille et al., 2013; Rouzine et al., 2001)
The aim of the present study was to disentangle the role and relative importance of the three factors, virus accumulation, selection coefficient between virus variants and virus effective population size, on the breakdown of the major resistance gene in order to foster the breeding of plant cultivars with durable virus resistance.
RESULTS
The breakdown frequency of the pvr23–mediated resistance at the individual plant level
(response variable ‘RB’) and several putative explanatory variables linked to within-plant PVY evolutionary processes (mutation, selection and genetic drift) were estimated in 84 doubled-haploid (DH) pepper lines. The terminology ‘resistance breakdown’ is frequently used to describe the increase of infection rates, and often of subsequent economic losses, at the field scale following the adaptation of pathogen populations to resistant cultivars. For simplicity, we use this term to describe pathogen adaptation at the individual plant level, regardless of its epidemiological consequences. The variable RB and the explanatory variables corresponding to within-plant virus accumulation (variable ‘VA’) and to the PVY effective population size at inoculation step (variable ‘Neinoc’) were
estimated previously (Quenouille et al., 2014; Tamisier et al., 2017; Table 1 and section Experimental Procedures). In the present study, two additional explanatory variables were estimated: PVY effective population size during plant infection from inoculation to 21 days post inoculation (dpi) and the differential selection exerted by the plant on the same PVY population (variables ‘Ne’ and ‘r’, respectively; see below; Table 1). Note that in the following, Ne and RB
will correspond to the names of the variables estimated in our experimental context, whereas the expressions ‘effective population size’ and ‘resistance breakdown’ will be used to refer to the general concepts.
Estimates of Ne and r with a PVY composite population in 84 pepper DH lines
The intensities of genetic drift and selection operating on PVY during plant infection were estimated experimentally by studying the dynamics of an artificial population composed of five PVY variants from inoculation to 21 dpi. The inoculum was made of a roughly similar amount of these five variants carrying one or two nonsynonymous substitutions (named variants G, K, N, GK and KN). These variants were chosen because they showed contrasted selection coefficients in plants belonging to the same progeny as the one studied here but none of the variants has been
counter-selected too fast, ensuring enough genetic diversity in the PVY populations to allow estimation of Ne and selection coefficients (Rousseau et al., 2017). The variant frequencies in the
common inoculum and in pools of three systemically-infected leaves at 21 dpi for each plant were accurately determined using MiSeq Illumina high-throughput sequencing (HTS) of the VPg cistron region where the mutations that distinguish the five variants were located. We also calculated the frequencies of de novo nucleotide substitutions in each sample and at each nucleotide position, by comparison with the sequence of PVY SON41p reference clone, as described in Rousseau et al. (2017). In all, PVY populations sampled from 30 plants (4.2%) presented one or several de novo substitution(s) (38 substitutions in total) with a frequency exceeding 7% (Text S1; Table S1). Thirty-seven of these 38 substitutions were nonsynonymous and 34 involved codon positions 105, 115 or 119 that were previously shown to determine PVY adaptation to pvr2-mediated resistance in pepper (Ayme et al., 2006). Consequently, most of these mutations are certainly adaptive for PVY and were selected for during plant infection. Numerical simulations have shown that the presence of an additional, unaccounted for, virus variant present at a mean frequency of 7% had no significant impact on estimates of Ne (Rousseau et al., 2017). Moreover, this 7% frequency threshold is close
to the expected error frequency due to RT-PCR and MiSeq Illumina sequencing (Rousseau et al., 2017). Consequently, these 30 PVY populations were removed from analyses. In total, data from 5 or more plant replicates were available for 84 pepper DH lines, which were subsequently analyzed.
The effective population size of the PVY population during plant infection from 0 to 21 dpi (Ne) and the relative growth rates of the five PVY variants (
r
i with i ∈ {G, K, N, GK, KN}) wereestimated for each DH line using a method developed recently (Rousseau et al., 2017). Briefly, this method allows estimating the Ne and
r
i parameters of a multi-allelic Wright-Fisher model forhaploids in the absence of neutral markers (Ewens, 2004). Before using the estimation method in our experimental context, we performed several batches of simulations to assess its ability to infer effective population sizes and selection coefficients accurately (see Experimental Procedures and Fig. S1). Overall, these numerical simulations indicated that the r and Ne estimates obtained are
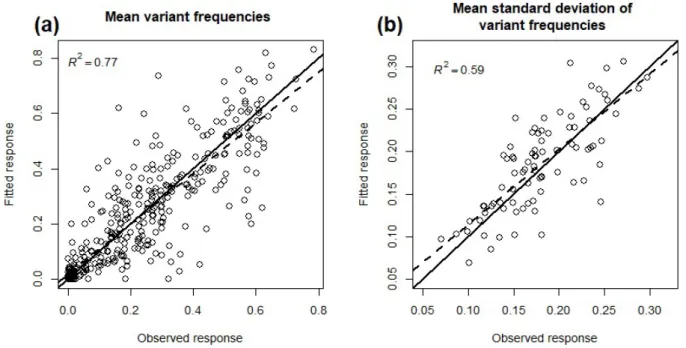
precise and accurate. Moreover, it is noteworthy that a Wright-Fisher model including selection and genetic drift fitted our dataset satisfactorily (Fig. 3). The best-fit line between observed and fitted mean variant frequencies was very close to the first bisector (Fig. 3a): the slope was close to 1.0 (0.92; standard deviation = 0.024) and the intercept close to 0.0 (0.016; standard deviation = 0.007), with R²=0.77. The fit was also satisfactory for the variability (i.e. standard deviation) of variant frequencies among the eight plants (Fig. 3b; slope = 0.89 with standard deviation = 0.08; intercept = 0.025 with standard deviation = 0.015; R²=0.6).
The fitness (
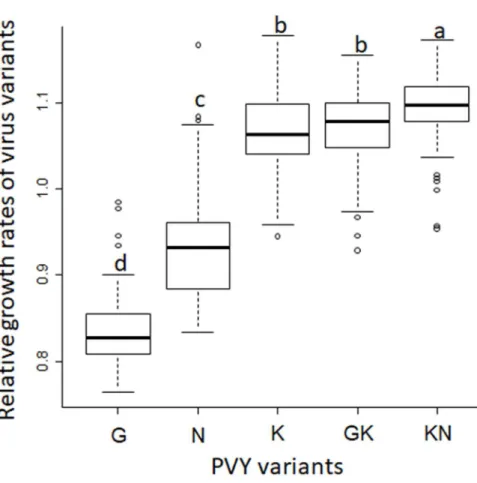
r
i) ranks of the five PVY variants were similar among the 84 DH lines, as describedpreviously on a set of 15 DH lines (Fig. 1; Rousseau et al., 2017). In 78 of the 84 lines, variant ‘G’ was the least fit. In the six remaining lines, variant ‘N’, which shows on average an intermediate fitness among the DH lines, was the least fit. The three variants possessing the ‘K’ mutation (i.e. variants ‘K’, ‘GK’ and ‘KN’) showed the highest fitness with small
r
i differences among them in82 of 84 lines. Because of this conserved fitness ranking among the 84 DH lines, we estimated the differential selection exerted by each DH line on the PVY population by the standard deviation of the growth rates
r
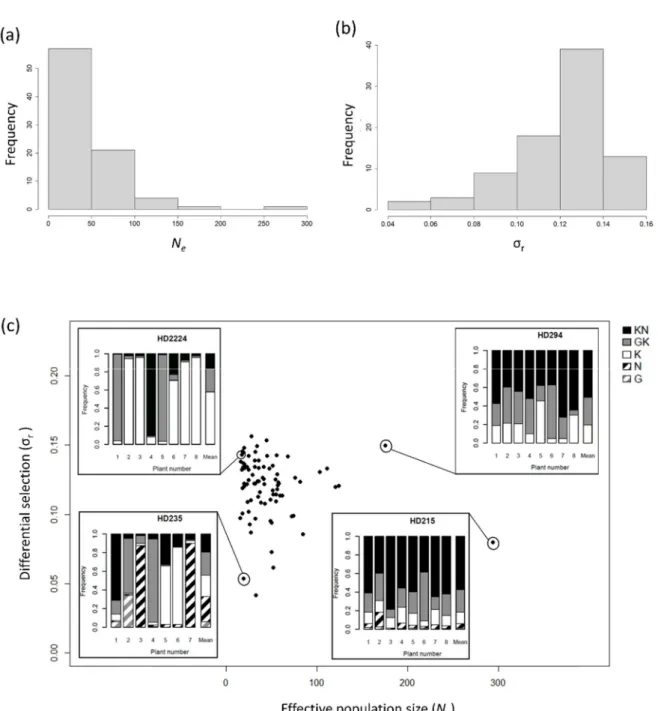
i of the five PVY variants, r. Among the 84 DH lines, r and Ne showed unimodaldistributions (Fig. 2). r varied from 0.041 to 0.156 (mean and median: 0.12) and presented a
nearly-Gaussian shape (Fig. 2a). Ne varied from 15.4 to 293.6 (mean: 46.4; median: 35.9) and the DH line
distribution was skewed toward small values (Fig. 2b). About two thirds of lines (57 of 84) had Ne<50 and only six lines had Ne>100. Figure 2c shows a set of bar plots representing the frequencies
of the five PVY variants in the 8 sampled plants and their mean frequencies in four DH lines showing contrasted Ne and r values.
Effect of evolutionary forces exerted on PVY populations on resistance-breakdown
Weak or no correlation was observed among the explanatory variables Ne, r, Neinoc and VA
(Table 2; Figs. S2 and S3). Ne and VA showed a significant positive correlation (Pearson’s r=0.31,
p-value=0.0045). However, this effect was mainly due to an outlier DH line showing an extreme Ne
value and the highest VA value (Fig. S2). After withdrawing this DH line (or using the Spearman’s rank correlation test), no significant correlation was observed between Ne and VA (p-values≥0.13).
With Spearman’s test, a weakly significant correlation was observed between Ne and r (=-0.22,
p-value=0.048). Finally, a weakly significant correlation was also observed between VA and r,
with both Pearson’s and Spearman’s tests (p-values=0.041 and 0.028, respectively). No correlation was detected between Ne and Neinoc or Neinoc and VA. Moreover, variance inflation factors (VIF)
were calculated for each explanatory variable. All VIF values were below 4, which ensures the lack of multicollinearity between explanatory variables in our analysis.
In contrast, three explanatory variables were significantly and consistently correlated with the response variable RB: r, Neinoc and VA (Table 2). The correlation was positive and highly
significant between RB and either Neinoc or VA. The correlation was negative and moderately
plots of the variables for the 84 DH lines did not reveal particular relationships other than the linear or ranking relationships revealed by the correlation analyses (Fig. S2 and S3).
Generalized linear model (GLM) analyses were performed to investigate the effect of the four explanatory variables r, VA, Ne and Neinoc on RB. After a stepwise selection procedure, both
forward and backward, based on Akaike’s information criterion (AIC), the retained model included three of the four explanatory variables (Ne, VA and r) and four of the six pairwise interactions
(Table 3). These factors and interactions had highly significant effects on RB. The model fit was quite good with McFadden R² = 0.40 (McFadden, 1973).
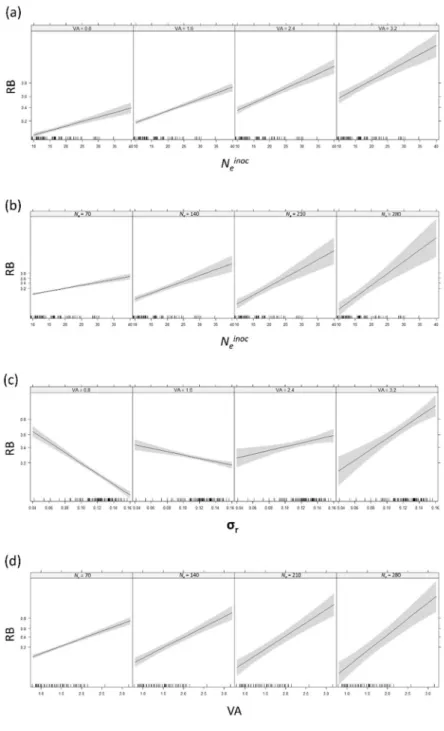
Significant interactions revealed synergistic effects on RB (Table 3 and Fig. 4). Indeed, the positive effect of Neinoc on RB is increased with increasing values of VA as attested by the higher
slope value (Fig. 4a). The same trend was observed with Neinoc and Ne or with VA and Ne (Fig. 4b
and 4c). For the last significant pairwise interaction, r ×VA, the effect on RB depended on the
values of the variables (Fig. 4d). When VA was small, RB decreased with increasing r values,
whereas when VA was high RB increased with increasing r values.
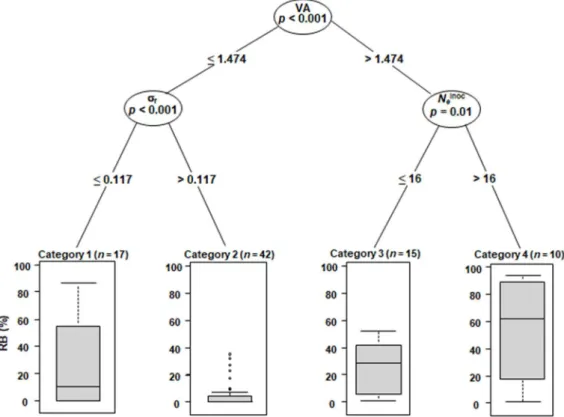
We computed conditional inference regression trees to synthesize the effect of the four explanatory variables on RB (Fig. 5). Regression trees take into account the interactions between explanatory variables and identify combinations of their levels leading to higher or lower RB. The first dichotomy in the regression tree was linked to the variable VA, reflecting its strong influence on RB. The second dichotomies were linked to the variables r and Neinoc. The variable Ne was not
retained(Table 2). The best way to reduce RB is thus to combine a weak VA (≤1.474) and a high r
(>0.117). When VA is higher (>1.474), a low Neinoc value (≤16) contributes also significantly to
reduce RB.
DISCUSSION
The main objective of this article was to study the relationships between the frequency of breakdown of the major resistance gene pvr23 (variable RB) and proxy variables quantifying the
main evolutionary forces exerted by the host plants on the virus population, notably the intensities of genetic drift and selection (Neinoc, Ne and r) and virus accumulation (VA).
No strong evidence of correlations between the four explanatory variables Neinoc, Ne, r and VA
were observed (Table 2). First, a positive correlation could have been expected between Neinoc and
Ne. Indeed, experiments with Tobacco etch virus (TEV; genus Potyvirus) in pepper or tobacco plants
showed that within-plant genetic drift is mostly determined by the inoculation step and not by the colonization of inoculated or apical leaves (Zwart et al., 2011, 2012). Second, a positive correlation could also have been expected between Neinoc and VA because, for potyviruses, a low Neinoc was
shown to result in a delay in plant infection at the systemic level (Rodrigo et al., 2014; Zwart et al., 2012) or in a lower proportion of infected cells (Lafforgue et al., 2012), hence probably also in a lower VA. Importantly, Lafforgue et al. (2012) and Rodrigo et al. (2014) analyzed potyvirus infection in one highly susceptible plant species, whereas we used a large number of pepper lines carrying different sets of resistance QTLs (Quenouille et al., 2014). As partial resistance mechanisms may act specifically on the virus local and/or systemic movement, they likely explain the absence of correlation between Neinoc and VA or between Neinoc and Ne (Table 2; Fig. S2). The
lack of correlation between Neinoc and Ne is consistent with the narrow bottleneck observed between
6 and 10 dpi, i.e. at the onset of systemic infection, in the majority of the pepper DH lines (8 of 15 tested) (Rousseau et al., 2017). Moreover, if links between Neinoc and Ne (or VA) are likely early in
the infection process, they may have blurred with time until disappearing 21 (for Ne) or 36 dpi (for
VA) (Table 1). The lack of (or low) correlation between Ne and VA could similarly be due to the
bottleneck during systemic infection. As effective population size Ne corresponds to the harmonic
mean of effective population sizes over the successive generations, a transient bottleneck could induce a strong reduction of Ne, while its effect could be small on VA because of the subsequent
growth of the virus population.
Which evolutionary forces contribute most to resistance breaking?
Relationships between the number of viral mutations required for host adaptation, their probabilities of appearance, the incurred fitness changes and genetic drift are complex (da Silva and Wyatt, 2014; Fabre et al., 2009; Iwasa et al., 2004; Quenouille et al., 2013). We thus also anticipated complex interaction patterns between VA, r, Ne and Neinoc and RB.
The strong positive correlation between VA and RB, observed earlier (Quenouille et al., 2014), may result from the link between VA and the probability of appearance of the resistance-breaking mutations in the inoculated plants (Quenouille et al., 2013). Indeed, VA is an estimate of the virus census population size at a given time-point, which depends on the population growth rate and generation time. Assuming equal PVY mutation rates between DH lines, VA would actually be a
proxy of the probability for a new mutation to occur during the experiment. This assumption also implies that the within-plant accumulation of the resistance-breaking variant (CI chimera carrying the ‘N’ substitution; Table 1), used to measure VA, is correlated to the residual accumulation of the WT variant (CI chimera), used to estimate RB. Unfortunately, we could not measure the accumulation of the WT variant in these plants. Indeed, even if the pvr23 resistance gene does not
control completely PVY multiplication or even movement (Montarry et al., 2011), the WT viruses were outcompeted by the resistance-breaking mutants that appeared stochastically and emerged rapidly in 99% of the infected plants. This scenario, where resistance breakdown results from the residual replication of the WT PVY variant, is suggested by, Montarry et al. (2011), who established that the PVY resistance-breaking mutants did not preexist in the inoculum.
The strong positive correlation between Neinoc and RB was expected if we consider, as
mentioned above, that genetic drift frequently slows down adaptation. Since the PVY resistance-breaking mutants were most probably absent from the inoculum, low Neinoc are not likely to
eliminate those putative resistance-breaking mutants at the inoculation step but rather to slow down their probabilities of appearance and subsequent fixation during the early steps of infection.
Similarly, we anticipated a positive correlation between r and RB (Feder et al., 2016), since
higher r values would accelerate the fixation of resistance-breaking mutations in the PVY
populations. Though the overall link between r and RB was negative (Table 2), the effect of r on
RB was complex due to strong interaction with VA (Table 3). When VA was high, RB increased with increasing r values, which fits our expectations. However, when VA was small, RB decreased
with increasing r values (Fig. 4 and 5).
tOur interpretation relies on the relationships between VA, r and the type of
resistance-breaking substitutions (transitions or transversions) (Fig. 6). Indeed, , transitions are 5 to 8 times more frequent than transversions in the PVY genome (Ayme et al., 2006). In the experiment performed to estimate RB, the resistance-breaking PVY mutants were single mutants (like G, K and N), double mutants (GK and KN) needing much more time to appear and become fixed (Montarry et al., 2011; Quenouille et al., 2013).
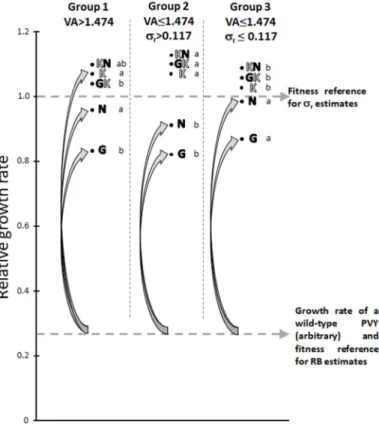
When VA is high (>1.474; plant group 1 in Fig. 6), the PVY population undergoes a large number of replication events and any kind of single mutant is likely to appear, either issued from a transition (G and N mutants) or from a transversion (K mutant). In particular, a high-fitness resistance-breaking mutant (mutant K) is likely to appear rapidly. In this case, the higher the
differential selection r, the faster this mutant will become fixed and the higher RB. A synergistic
effect between VA and r on RB is expected in this group of plant.
In contrast, when VA is low (≤1.474), the appearance of the N and G transitions could remain nearly certain whereas the appearance of the K transversion could be highly stochastic. It is noteworthy that the relative growth rates of mutants N and G are significantly higher for group 3 than for group 2, whereas, on the opposite, r values are higher for group 2 (r>0.117) than for
group 3 (r≤0.117) (Fig. 6). Then, starting with a wild-type virus with a low fitness, as was the case
in the experiment used to measure RB, the fitness gains provided by mutations G or N are higher for plants of group 3 than for plants of group 2, explaining the higher RB observed in that case (Fig. 6). In these two groups of plants with low VA, a negative correlation between r and RB is therefore
expected.
This result underlines the risk of extrapolating selection coefficients from one experimental context to the other, as they may be strongly influenced by the composition of the considered population (kind, number and initial frequency of variants).
Applied consequences: breeding rules to improve the durability of major-effect resistance genes
Breeding cultivars with efficient and durable pathogen resistance frequently relies on measuring the pathogen load (VA in our case). Our results indicate first that independent mechanisms are likely to act on Neinoc, Ne, r and VA, given the lack of (or low) correlation between
them. Accordingly, these evolution-related factors could also be considered as complementary breeding levers to control virus infection and evolution. Indeed, in addition to VA, the intensities of genetic drift and selection are relevant traits to promote the durability of plant resistance genes to viruses (Rousseau et al., 2017; Zhan et al., 2015), as proposed more generally to limit the emergence of microbe variants adapted to drug treatments (Abel et al., 2015). Accordingly, Lê Van et al. (2013) showed that the differential selection exerted by apple trees on a composite fungus population was inversely correlated with the spectrum of action of the resistance, hence also inversely correlated with the expected durability of the resistance. From an applied point of view,, the regression tree issued from this work can provide insightful decision rules for breeding strategies (Fig. 5). Reducing RB is firstly achieved by reducing VA. Then, if VA is high, one can still reduce RB by favoring plants with low Neinoc values. Finally, low VA values can be combined with high r
values to still improve resistance durability. Note however that this latter effect should be taken with caution, being certainly linked to the experimental context used to estimate r. One can argue,
at least on a limited set of plant-virus genotype × genotype interactions, that Neinoc estimates and, to
a lower extent, VA estimates may be representative of various PVY population compositions. On the opposite, the differential selection (r) estimates may vary strongly with the PVY population
used (notably with different numbers and/or types of variants).
As a conclusion, we provide evidence that traits accounting for the plant impact on virus evolution have a great potential to reduce the risks of breakdown of a major resistance gene. Phenotyping such traits becomes feasible with recent sequencing technologies and population genetics models. Hence, conditions are met to include these, or similar, approaches in plant breeding programs aiming to improve the resistance durability to pathogens.
EXPERIMENTAL PROCEDURES
Previous data
Different variants of the WT PVY clone SON41p (Moury et al., 2004) were chosen to estimate the response variable RB (breakdown frequency of the pvr23–mediated resistance) and the
explanatory variables corresponding to within-plant PVY accumulation (VA) and PVY effective population size at inoculation (Neinoc). RB was previously evaluated after inoculation of each of the
DH lines (60 plants per DH line) with the ‘CI chimera’, an artificial recombinant of SON41p carrying the cylindrical inclusion (CI)-coding region of PVY isolate LYE84.2 (Table 1) (Montarry et al., 2011; Quenouille et al., 2014). This variant was preferred to SON41p because of its higher ability to break the pvr23 resistance, providing a larger range of RB values among DH lines, hence
allowing a higher precision for genetic and statistical analyses. Still, RB obtained with SON41p was shown to be highly correlated with RB obtained with the CI chimera on a subset of sixteen contrasted DH lines (Quenouille et al., 2013). RB corresponds to the frequency of plants showing virus infection at the systemic level around one month after inoculation and was shown to correspond to situations where a nonsynonymous mutation in the VPg-(viral protein genome-linked) coding region became fixed in the PVY population, conferring adaptation to the pvr23
resistance (Ayme et al., 2006; Montarry et al., 2011).
PVY accumulation in plants was measured by quantitative DAS-ELISA (double antibody sandwich enzyme-linked immunosorbent assay) (Quenouille et al., 2014). Mean relative virus accumulation (VA) was assessed in pools of three systemically-infected leaves per plant at 36 days post-inoculation (dpi) in 10 plants per DH line (Quenouille et al., 2014; Table 1). For this, a mutant
of the CI chimera carrying the aspartic acid to asparagine substitution at amino acid position 119 of the VPg (‘N’ substitution) that allowed infection of plants carrying pvr23 was used.
Finally, effective population size at plant inoculation (Neinoc) was estimated with a SON41p
variant carrying a GFP (Green Fluorescent Protein) reporter gene and a single amino acid substitution in the VPg (threonine to lysine substitution at codon position 115; ‘K’ substitution) which allows infection of plants carrying pvr23 (Tamisier et al., 2017; Table 1). N
einoc corresponds
to the mean number of PVY primary infection foci visualized by the GFP fluorescence 5 or 6 days after mechanical inoculation of 20 pepper cotyledons per DH line.
Analysis of composite PVY populations infecting pepper DH lines
An experiment was dedicated to estimate two more explanatory variables for RB: the PVY effective population size during plant infection (Ne) and the differential selection exerted by the host
genotype on a composite PVY population (r). The experimental design was as in Rousseau et al.
(2017) except for two main differences: (i) the experiment comprised initially 151 pepper DH lines instead of 15 and (ii) only one plant sampling date (21 dpi) was retained instead of six, to keep the experimental size compatible with MiSeq Illumina sequencing capacity. The sampling date at 21 dpi was chosen based on the previous experiments (Rousseau et al., 2017) as a balance between the time for differential selection to operate on the PVY population and the risk of extinction of the less fit PVY variants with time. In the latter case (absence of a virus variant in all sampled plants), the lack of genetic information in the PVY populations would preclude estimation of Ne and r with
Rousseau et al.’s (2017) model. All the 151 DH lines of C. annuum carried the PVY resistance allele pvr23 and differed in their genetic background (Quenouille et al., 2014). They were issued
from the F1 hybrid between ‘Perennial’, a PVY-resistant pepper line carrying the pvr23 allele, and
‘Yolo Wonder’, a PVY-susceptible line (Quenouille et al., 2014). The five SON41p variants, named G, N, K, GK and KN based on their amino acid substitutions in the VPg (i.e. the ‘K’ and ‘N’ mutations defined previously and the ‘G’ mutation corresponding to the serine to glycine substitution at codon position 101 of the VPg), were mixed in similar amounts based on quantitative DAS-ELISA and were mechanically inoculated to the two cotyledons of eight plants per DH line. Each of these mutations or mutation pairs (double-letter names) conferred to PVY the capacity to infect plants carrying pvr23. At 21 dpi, for each plant, all apical leaves were collected, pooled
together and crushed in buffer before RNA purification as in Rousseau et al. (2017). One-step reverse-transcription polymerase chain reaction (RT-PCR) amplification was conducted for the 1208 plants (8 plants × 151 DH lines) individually, in thirteen 96-well PCR plates. The amplified
region was 104 nucleotide long and corresponded to positions 5991-6094 of PVY SON41p (accession AJ439544).
In all, the sampling, RT-PCR and sequencing procedures performed to obtain the viral sequences were essentially as described by Rousseau et al. (2017). Eight differently tagged primers were used, corresponding to the eight different plant replicates of the same plant genotype. Three of the eight primers used by Rousseau et al. (2017) were poorly efficient in PCR (corresponding to primer tags 5’-GGTCTAGTAC, 5’-GAGGCTCTAC and 5’-TGCTGATATC), and were thus replaced with primer tags 5’-CGACGACTGC, 5’-TGGAGTACGA and 5’-GGAGCGTCAC, respectively. Amplified DNAs corresponding to the eight plant replicates were pooled together on the basis of their intensity on electrophoresis gels. To avoid opening the reaction microtubes and hence cross-contamination between microtubes of the same RT-PCR plate, single-step RT-PCRs were performed on RNA extracts on a first set of 13 PCR plates. For 66 DH lines, no RT-PCR products were detected by agarose gel electrophoresis for at least 4 of the 8 plants. A two-step RT-PCR protocol was thus carried out for all the samples of these 66 DH lines in six additional 96-well PCR plates. This protocol usually provides a higher sensitivity than the first one but increases the risk of contamination (Bustin, 2000). Unfortunately, MiSeq sequencing results showed that significant contaminations occurred in 4 of these 6 additional PCR plates (see below). As next-generation sequencing data may be impacted by contaminations, several controls were included as in Rousseau et al. (2017). These controls allowed estimating potential cross-contamination among samples during the crushing step or during RT-PCR. HTS was performed at the GeT-PlaGe
Genomic Platform of INRA Toulouse. For this purpose, 2 × 150 base-pair libraries were prepared with multiplex adapters (12 PCR cycles), and all the RT-PCR-amplified products were pooled into a single large sample. This sample was run on a MiSeq Illumina paired-end sequencer with the MiSeq Reagent Kit v2, for 500 cycles. By using tagged primers and subsequent multiplex adapters, we were able to assign a plant number and a plant genotype to each sequence.
After MiSeq sequencing, the number (counts) of reads detected in the negative controls of the former set of 13 PCR plates ranged from 0 to 100, with a mean number (± standard deviation) of 40 ± 24. This contrasts greatly with the number of reads per sample, which ranged from 201 to 11052, with a mean read number of 4919 ± 1747. As mentioned above, the sequencing results confirmed the occurrence of high contamination levels on four plates in the second set of six PCR plates, with 1449 ± 1917 reads in the negative controls. All DH lines corresponding to these four PCR plates were removed from the dataset. Consequently, sequences corresponding to 89 DH lines were kept and further analyzed. From these reads, counts of sequences corresponding to the five inoculated PVY variants in each individual plant were obtained as in Rousseau et al. (2017). The initial
inoculum was also sequenced and the following frequencies were obtained for the five PVY variants: G (22%), N (15%), K (17%), GK (18%) and KN (28%). Counts of sequence corresponding to the five PVY variants in all sampled plants and in the inoculum are available in Table S2. Moreover, the presence of de novo nucleotide substitutions in the sequence dataset was checked as described in Rousseau et al. (2017) (Text S1; Table S1). A minimal threshold of 7% was considered for these de novo mutations, which accounts for (i) potential errors due to RT-PCR and MiSeq Illumina sequencing and for (ii) potential impact on the precision of estimation of genetic drift (Ne)
and differential selection (r) with method Rousseau et al.’s (2017) method. Consequently, we
withdrew plants with de novo mutations exceeding 7% of the PVY population. For five DH lines, less than five plant replicates were remaining and these DH lines were removed before further analyses. We ended up with a dataset of 84 DH lines.
Inference of virus Ne and r
Estimation of the strength of genetic drift and the relative growth rates of PVY variantsacting on the composite PVY population was performed with the method proposed by Rousseau et al. (2017). Estimated parameters are the relative growth rates ri of each PVY variant i (G, N, K, GK
and KN) and the effective population size Ne of the whole PVY population for each of the 84 DH
lines considered. For a given DH line, the observed variables are the PVY variant sequence counts obtained from HTS data in the 8 sampled plants. The differential selection (r) exerted by a pepper
DH line on the whole PVY population composed of five variants was estimated as the standard deviation of the ri values of the five PVY variants.
The method of Rousseau et al. (2017) was validated for an experimental context involving the determination of virus variant frequencies by HTS in eight plants at each of six sampling dates. In contrast, the present experimental design involved a single sampling date. Before applying the method to the current dataset, we performed several batches of simulations to assess its efficiency to infer accurately virus effective population sizes and relative growth rates with a single sampling date. Briefly, we first simulated the changes in frequency of five virus variants under 400 selection and genetic drift regimes with a Wright-Fisher model for haploid individuals. The simulated datasets have been generated as in Rousseau et al. (2017), except that a single sampling date (21 dpi with 8 independent host plants sampled for each plant genotype) was considered and that the criteria for accepting the simulated datasets differed as follows: (i) three out of the five virus variants had to be present at a minimum frequency of 0.5% in at least 50% of the plants and (ii) all variants had to be present in at least one of the eight plants at a minimum frequency of 0.1%. These criteria were met in 83 of the 84 DH lines analyzed.
The genetic drift regimes were defined by a vector of effective population sizes varying every 5 generations (Text S2 in Rousseau et al. 2017). For each of the 400 datasets obtained, the true parameters are known and can be compared to the estimated parameters (one growth rate for each variant; one effective population size corresponding to the harmonic mean of effective population sizes over the successive generations).
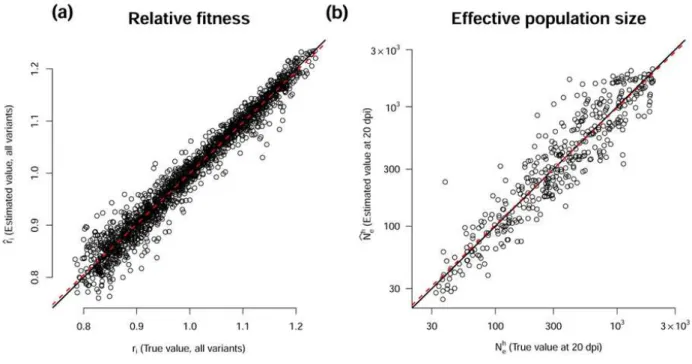
Estimates of the relative growth rates ri were highly accurate, with an R² of the best-fit line of
0.96, a slope close to 1.0 (0.98) and an intercept of 0.02 (Supplementary Fig. S1a). Estimates of the harmonic mean of effective population sizes Neh were also accurate with a best-fit line, in log scale,
close to the first bisector (R²=0.86), a slope of 0.98 and an intercept of 0.05 (Supplementary Fig. S1b). In both cases, the 95% confidence interval of the mean relative bias included zero. The 90% confidence interval was highly accurate for Neh as it included 89% of the true parameter values.
However, the 90% confidence interval of ri was overestimated, the true parameter values being
included in 98% of cases.
Statistical analyses of the links between variables related to the evolution of PVY populations
Statistical analyses were handled with the R software version 3.0.2 (R Core Team, 2013; http://www.r-project.org/). We used generalized linear models (GLMs) to study the effects of Ne,
r, Neinoc and VA on the response variable RB, considered as a binary variable representing the
occurrence (1) or absence (0) of infection in a total of 60 individual plants per DH line, except seven DH lines for which only 30 plants were assayed (Quenouille et al., 2014). Values of all variables for each DH line are available in Table S3. As a consequence, a binomial distribution was used in the GLMs for RB. All explanatory variables (Ne, r, Neinoc and VA) and their pairwise interactions
were included in the full GLM and stepwise model selection was performed using Akaike’s information criterion (AIC) (Akaike, 1974). GLMs were done with the R packages ‘lme4’ and ‘MASS’. The variance inflation factor (VIF) was assessed with the R package ‘car’. Additionally, conditional inference regression trees were realized using the method ‘ctree’ implemented in the package ‘party’. Such trees allow to explore the effects of the most significant explanatory variables on RB. Regression trees were computed with a minimum number of 10 DH lines in each terminal ‘leaf’ of the tree and default setting for other parameters to describe the conditional distribution of RB as a function of the four explanatory variables Ne, r, Neinoc and VA.
The authors thank AM Sage-Palloix and G Nemouchi for providing pepper genetic resources and J. Béraud, N Truglio and M. Pascal for plant care. We also thank HM Clause for its support. L. Tamisier’s PhD was supported by the BAP (Biologie et Amélioration des Plantes) department and SMaCH (Sustainable Management of Crop Health) INRA metaprogramme and by the Région Provence-Alpes-Côte d’Azur (PACA). Experimental work was supported by the SMaCH metaprogramme and partly performed on the LBM platform of INRA Avignon. Simulations were carried out with the Avakas computer cluster at Bordeaux University. This work was performed in collaboration with the GeT core facility, Toulouse, France (http://get.genotoul.fr) and was supported by France Génomique National infrastructure, funded as part of “Investissement d’avenir” program managed by Agence Nationale pour la Recherche (contract ANR-10-INBS-09).
REFERENCES
Abel, S., Abel zur Wiesch, P., Davis, B. M. and Waldor, M.K. (2015) Analysis of bottlenecks in experimental models of infection. PLoS Pathog. 11, e1004823.
Akaike, H. (1974) A new look at the statistical model identification. IEEE Trans. Autom. Control 19, 716–723.
Ayme, V., Souche, S., Caranta, C., Jacquemond, M., Chadœuf, J., Palloix, A. and Moury, B. (2006) Different mutations in the genome-linked protein VPg of Potato virus Y confer virulence on the pvr23 resistance in pepper. Mol. Plant. Microbe Interact. 19, 557–563.
Brun, H., Chèvre, A.-M., Fitt, B.D., Powers, S., Besnard, A.-L., Ermel, M., Huteau, V., Marquer, B., Eber, F., Renard, M. and Andrivon, D. (2010) Quantitative resistance increases the durability of qualitative resistance to Leptosphaeria maculans in Brassica napus. New Phytol. 185, 285–299.
Bustin, S.A. (2000) Absolute quantification of mRNA using real-time reverse transcription polymerase chain reaction assays. J. Mol. Endocrinol. 25, 169–193.
Charlesworth, B. (2009) Fundamental concepts in genetics: Effective population size and patterns of molecular evolution and variation. Nat. Rev. Genet. 10, 195–205.
da Silva, J. and Wyatt, S. (2014) Fitness valleys constrain HIV‐1’s adaptation to its secondary chemokine coreceptor. J. Evol. Biol. 27, 604–615.
de la Iglesia, F., Martínez, F., Hillung, J., Cuevas, J.M., Gerrish, P. J., Daròs, J.-A. and Elena, S.F. (2012) Luria-Delbrück estimation of Turnip mosaic virus mutation rate in vivo. J. Virol. 86, 3386–3388.
Díaz, J.A., Nieto, C., Moriones, E., Truniger, V. and Aranda, M.A. (2004) Molecular characterization of a Melon necrotic spot virus strain that overcomes the resistance in melon and nonhost plants. Mol. Plant. Microbe Interact. 17, 668–675.
Ewens, W.J. (2004) Mathematical population genetics. I. Theoretical introduction. Second Edition, Interdisciplinary applied mathematics, vol. 27, Springer-Verlag, New York.
Fabre, F., Bruchou, C., Palloix, A. and Moury, B. (2009) Key determinants of resistance durability to plant viruses: Insights from a model linking within- and between-host dynamics. Virus Res. 141, 140–149.
Fabre, F., Rousseau, E., Mailleret, L. and Moury, B. (2012b) Durable strategies to deploy plant resistance in agricultural landscapes. New Phytol. 193, 1064–1075.
Fabre, F., Montarry, J., Coville, J., Senoussi, R., Simon, V. and Moury, B. (2012a) Modelling the evolutionary dynamics of viruses within their hosts: A case study using high-throughput sequencing. PLoS Pathog. 8, e1002654.
Fabre, F., Rousseau, E., Mailleret, L. and Moury, B. (2015) Epidemiological and evolutionary management of plant resistance: optimizing the deployment of cultivar mixtures in time and space in agricultural landscapes. Evol. Appl. 8, 919–932.
Feder, A.F., Rhee, S.-Y., Holmes, S.P., Shafer, R.W., Petrov, D.A., Pennings, P.S. (2016) More effective drugs lead to harder selective sweeps in the evolution of drug resistance in HIV-1. Elife 5, e10670.
Fournet, S., Kerlan, M.-C., Renault, L., Dantec, J.-P., Rouaux, C. and Montarry, J. (2013) Selection of nematodes by resistant plants has implications for local adaptation and cross-virulence: Local adaptation and cross-virulence in Globodera pallida. Plant Pathol. 62, 184–193.
French, R. and Stenger, D.C. (2003) Evolution of wheat streak mosaic virus: Dynamics of population growth within plants may explain limited variation. Ann. Rev. Phytopath. 41, 199-214.
Gago, S., Elena, S.F., Flores, R. and Sanjuán, R. (2009) Extremely high mutation rate of a hammerhead viroid. Science 323, 1308–1308.
García-Arenal, F. and McDonald, B.A. (2003) An analysis of the durability of resistance to plant viruses. Phytopathology 93, 941–952.
Gómez, P., Rodríguez-Hernández, A., Moury, B. and Aranda, M. (2009) Genetic resistance for the sustainable control of plant virus diseases: breeding, mechanisms and durability. Eur. J. Plant Pathol. 125, 1–22.
Gutiérrez, S., Yvon, M., Thébaud, G., Monsion, B., Michalakis, Y. and Blanc, S. (2010) Dynamics of the multiplicity of cellular infection in a plant virus. PLoS Pathog. 6, e1001113.
Gutiérrez, S., Michalakis, Y. and Blanc, S. (2012) Virus population bottlenecks during within-host progression and within-host-to-within-host transmission. Curr. Opin. Virol. 2, 546–555.
Harrison, B.D. (2002) Virus variation in relation to resistance-breaking in plants. Euphytica 124, 181–192.
Iwasa, Y., Michor, F. and Nowak, M.A. (2004) Stochastic tunnels in evolutionary dynamics. Genetics 166, 1571–1579.
Janzac, B., Fabre, F., Palloix, A. and Moury, B. (2009) Constraints on evolution of virus avirulence factors predict the durability of corresponding plant resistances. Mol. Plant Pathol. 10, 599–610.
Khelifa, M., Massé, D., Blanc, S. and Drucker, M. (2010) Evaluation of the minimal replication time of Cauliflower mosaic virus in different hosts. Virology 396, 238–245.
Kimura, M. (1970) Stochastic processes in population genetics, with special reference to distribution of gene frequencies and probability of gene fixation. In Mathematical topics in population genetics, pp. 178–209. Springer.
Kimura, M. and Crow, J.F. (1963) The measurement of effective population number. Evolution 17, 279–288.
Lafforgue, G., Tromas, N., Elena, S.F. and Zwart, M.P. (2012) Dynamics of the establishment of systemic potyvirus infection: independent yet cumulative action of primary infection sites. J. Virol. 86, 12912–12922.
Lande, R. and Barrowclough, G.F. (1987) Effective population size, genetic variation, and their use in population management. Viable Popul. Conserv. 87, 124.
Lanfear, R., Kokko, H. and Eyre-Walker, A. (2014) Population size and the rate of evolution. Trends Ecol. Evol. 29, 33–41.
Lannou, C. (2012) Variation and selection of quantitative traits in plant pathogens. Annu. Rev. Phytopathol. 50, 319–338.
Lê Van, A., Caffier, V., Lasserre-Zuber, P., Chauveau, A., Brunel, D., Le Cam, B. and Durel, C.-E. (2013) Differential selection pressures exerted by host resistance quantitative trait loci on a pathogen population: a case study in an apple × Venturia inaequalis pathosystem. New Phytol. 197, 899–908.
Malpica, J.M., Fraile, A., Moreno, I., Obies, C.I., Drake, J.W. and García-Arenal, F. (2002) The rate and character of spontaneous mutation in an RNA virus. Genetics 162, 1505–1511. Martínez, F., Sardanyés, J., Elena, S.F. and Daròs, J.-A. (2011) Dynamics of a plant RNA virus intracellular accumulation: stamping machine vs. geometric replication. Genetics 188, 637– 646.
McDonald, B.A. and Linde, C. (2002) Pathogen population genetics, evolutionary potential, and durable resistance. Annu. Rev. Phytopathol. 40, 349–379.
Miras, M., Sempere, R.N., Kraft, J.J., Miller, W.A., Aranda, M.A. and Truniger, V. (2014) Interfamilial recombination between viruses led to acquisition of a novel translation-enhancing RNA element that allows resistance breaking. New Phytol. 202, 233–246. Montarry, J., Doumayrou, J., Simon, V. and Moury, B. (2011) Genetic background matters: a
plant-virus gene-for-gene interaction is strongly influenced by genetic contexts: Viral genetic background matters. Mol. Plant Pathol. 12, 911–920.
Moury, B., Morel, C., Johansen, E., Guilbaud, L., Souche, S., Ayme, V., Caranta, C., Palloix, A. and Jacquemond, M. (2004) Mutations in Potato virus Y genome-linked protein determine virulence toward recessive resistances in Capsicum annuum and Lycopersicon hirsutum. Mol. Plant. Microbe Interact. 17, 322–329.
Moury, B., Fereres, A., García-Arenal, F. and Lecoq, H. (2011) Sustainable management of plant resistance to viruses. In Recent advances in plant virology, pp. 219–336. Norwich, UK.
Palloix, A., Ayme, V. and Moury, B. (2009) Durability of plant major resistance genes to pathogens depends on the genetic background, experimental evidence and consequences for breeding strategies. New Phytol. 183, 190–199.
Quenouille, J., Montarry, J., Palloix, A. and Moury, B. (2013) Farther, slower, stronger: how the plant genetic background protects a major resistance gene from breakdown: Mechanisms of polygenic resistance durability. Mol. Plant Pathol. 14, 109–118.
Quenouille, J., Paulhiac, E., Moury, B. and Palloix, A. (2014) Quantitative trait loci from the host genetic background modulate the durability of a resistance gene: a rational basis for sustainable resistance breeding in plants. Heredity 112, 579–587.
Quenouille, J., Saint-Felix, L., Moury, B. and Palloix, A. (2015) Diversity of genetic backgrounds modulating the durability of a major resistance gene. Analysis of a core collection of pepper landraces resistant to Potato virus Y. Mol. Plant Pathol. 17, 296–302. Råberg, L., Sim, D. and Read, A.F. (2007) Disentangling genetic variation for resistance and
tolerance to infectious diseases in animals. Science 318, 812–814.
Restif, O. and Koella, J.C. (2004) Concurrent evolution of resistance and tolerance to pathogens. Am. Nat. 164, E90–E102.
Rodrigo, G., Zwart, M.P. and Elena, S.F. (2014) Onset of virus systemic infection in plants is determined by speed of cell-to-cell movement and number of primary infection foci. J. R. Soc. Interface 11, 20140555.
Rousseau, E., Moury, B., Mailleret, L., Senoussi, R., Palloix, A., Simon, V., Valière, S., and Grognard, F. Fabre, F. (2017) Estimating virus effective population size and selection without neutral markers. PLoS Pathog. 13, e1006702.
Rouzine, I.M., Rodrigo, A. and Coffin, J.M. (2001) Transition between stochastic evolution and deterministic evolution in the presence of selection: general theory and application in virology. Microbiol. Mol. Biol. Rev. 65, 151-185.
Sácristan, S., Malpica, J.M., Fraile, A. and García-Arenal F. (2003) Estimation of population bottlenecks during systemic movement of Tobacco mosaic virus in tobacco plants. J. Virol. 77, 9906-9911.
Tamisier, L., Rousseau, E., Barraillé, S., Nemouchi, G., Szadkowski, M., Mailleret, L., Grognard, F., Fabre, F., Moury, B. and Palloix, A. (2017) Quantitative trait loci in pepper control the effective population size of two RNA viruses at inoculation. J. Gen. Virol. 98, 1923–1931.
Tromas, N. and Elena, S.F. (2010) The rate and spectrum of spontaneous mutations in a plant RNA virus. Genetics 185, 983–989.
Wright, S. (1931) Evolution in Mendelian populations. Genetics 16, 97–159.
Zhan, J., Thrall, P.H., Papaïx, J., Xie, L. and Burdon, J.J. (2015) Playing on a pathogen’s weakness: Using evolution to guide sustainable plant disease control strategies. Annu. Rev. Phytopathol. 53, 19–43.
Zwart, M.P. and Elena, S.F. (2015) Matters of Size: Genetic Bottlenecks in Virus Infection and Their Potential Impact on Evolution. Annu. Rev. Virol. 2, 161–179.
Zwart, M.P., Daròs, J.-A. and Elena, S.F. (2011) One Is Enough: In Vivo Effective Population Size Is Dose-Dependent for a Plant RNA Virus. PLoS Pathog. 7, e1002122.
Zwart, M.P., Daros, J.-A. and Elena, S.F. (2012) Effects of potyvirus effective population size in inoculated leaves on viral accumulation and the onset of symptoms. J. Virol. 86, 9737–9747.
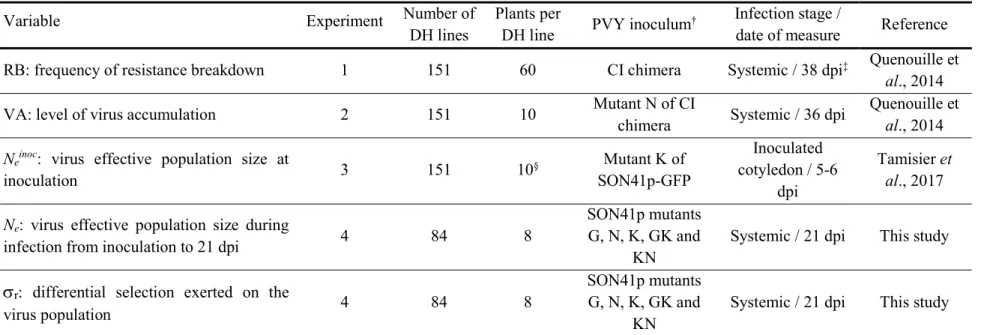
Table 1 Description of the variables used in this study.
Variable Experiment Number of
DH lines
Plants per
DH line PVY inoculum†
Infection stage /
date of measure Reference RB: frequency of resistance breakdown 1 151 60 CI chimera Systemic / 38 dpi‡ Quenouille et
al., 2014
VA: level of virus accumulation 2 151 10 Mutant N of CI
chimera Systemic / 36 dpi
Quenouille et al., 2014 Neinoc: virus effective population size at
inoculation 3 151 10§ Mutant K of SON41p-GFP Inoculated cotyledon / 5-6 dpi Tamisier et al., 2017 Ne: virus effective population size during
infection from inoculation to 21 dpi 4 84 8
SON41p mutants G, N, K, GK and
KN
Systemic / 21 dpi This study
r: differential selection exerted on the
virus population 4 84 8
SON41p mutants G, N, K, GK and
KN
Systemic / 21 dpi This study
†One or two letter codes for mutants correspond to amino acid substitutions in PVY VPg allowing infection of plants carrying the pvr23 resistance gene. ‡dpi: days post inoculation
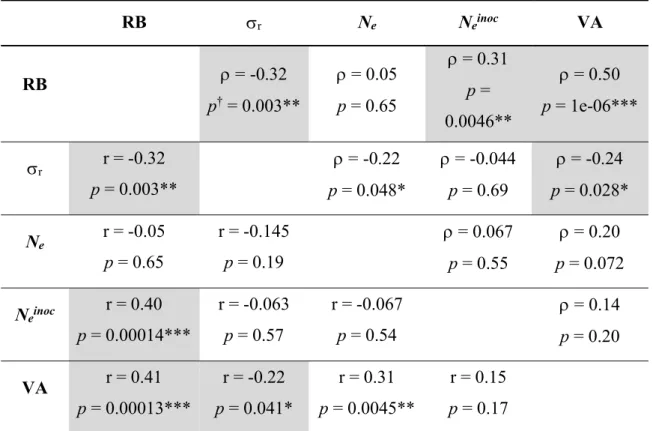
Table 2 Pearson r (below the diagonal) and Spearman rank (above the diagonal) correlation coefficients between the pvr23 resistance breakdown frequency (RB) and four variables linked to
evolutionary forces characterizing PVY populations in the different pepper genotypes: the differential selection (r), the effective population size during plant colonization (Ne), the effective population size
at inoculation (Neinoc) and the viral accumulation (VA). Correlations that are significant with both the
Pearson and Spearman coefficients are shaded in gray.
†p-values corresponding to H
0: r=0 or =0. *, ** and *** correspond to 0.05, 0.01 and 0.001 significance
thresholds, respectively. RB r Ne Neinoc VA RB = -0.32 p† = 0.003** = 0.05 p = 0.65 = 0.31 p = 0.0046** = 0.50 p = 1e-06*** r r = -0.32 p = 0.003** = -0.22 p = 0.048* = -0.044 p = 0.69 = -0.24 p = 0.028* Ne r = -0.05 p = 0.65 r = -0.145 p = 0.19 = 0.067 p = 0.55 = 0.20 p = 0.072 Neinoc r = 0.40 p = 0.00014*** r = -0.063 p = 0.57 r = -0.067 p = 0.54 = 0.14 p = 0.20 VA r = 0.41 p = 0.00013*** r = -0.22 p = 0.041* r = 0.31 p = 0.0045** r = 0.15 p = 0.17
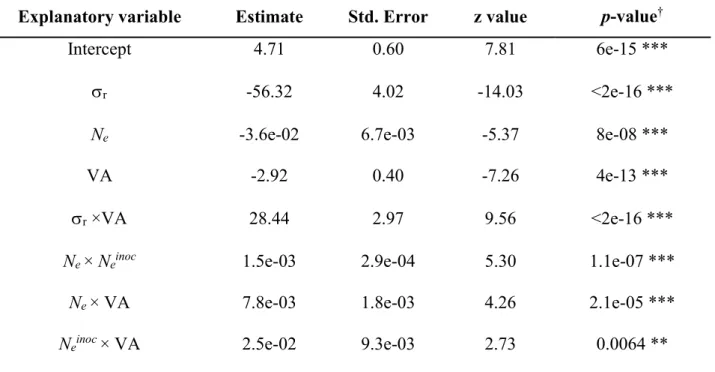
Table 3 Generalized linear model analysis of the frequency of pvr23 resistance breakdown (RB) with
four explanatory variables linked to evolutionary forces characterizing PVY populations in the different pepper genotypes. Explanatory variables are the differential selection r, the effective population size
during plant colonization (Ne), the effective population size at inoculation (Neinoc) and the viral
accumulation (VA). A stepwise selection procedure, both forward and backward, was applied using Akaike’s information criterion. The resulting model presented had a null deviance of 2264.3 on 83 degrees of freedom, while the residual deviance was 1287.7 on 75 degrees of freedom. McFadden’s R² was 0.40.
†** and *** correspond to 0.01 and 0.001 significance thresholds, respectively.
Explanatory variable Estimate Std. Error z value p-value†
Intercept 4.71 0.60 7.81 6e-15 ***
r -56.32 4.02 -14.03 <2e-16 ***
Ne -3.6e-02 6.7e-03 -5.37 8e-08 ***
VA -2.92 0.40 -7.26 4e-13 ***
r ×VA 28.44 2.97 9.56 <2e-16 ***
Ne × Neinoc 1.5e-03 2.9e-04 5.30 1.1e-07 ***
Ne × VA 7.8e-03 1.8e-03 4.26 2.1e-05 ***
FIGURES
Fig. 1 Distribution of the relative growth rates of the five PVY variants in 84 pepper DH lines. Different letters indicate significantly different groups (p-value<0.05) in Mann-Whitney-Wilcoxon tests with Bonferroni correction.
Fig. 2 Distribution of differential selection within, and effective population size of a PVY population in 84 pepper lines. (a) Distribution of differential selection (r). r is the standard deviation of the relative growth
rates ri of the five variants composing the PVY population. (b) Distribution of effective population size (Ne).
(c) Distribution of the 84 pepper DH lines according to Ne and r. For four DH lines with contrasted Ne and
r values, bar plots illustrating the composition of the PVY population 21 days post inoculation are provided.
For each DH line, each of the first 8 bars represents the frequencies of the five PVY variants (G, N, K, GK and KN) in a single plant initially inoculated with a similar amount of the five variants. The last bar represents the mean frequencies of the five PVY variants among the eight plants.
Fig. 3 Goodness of fit of a Wright-Fisher model with selection and genetic drift with the experimental dataset. (a) Correlation between the observed mean frequencies of each of the five virus variants in the population and their fitted values (n= 420; 84 DH lines, five values per DH line). (b) Correlation between the observed means of the standard deviation of variant frequencies and their fitted values (n=84; one value per DH line). In both panels, the black line is the first bisector and the gray dashed line is the best-fitting linear model.
Fig. 4 Response of RB to pairwise interactions between the four explanatory variables according to the GLM. Only significant interactions are shown (Table 3). RB is the frequency of breakdown of the pvr23–mediated
resistance in 84 pepper DH lines. The four explanatory variables considered were within-plant virus accumulation (VA), effective population size at the plant inoculation step (Neinoc) or during plant colonization
(Ne) and differential selection exerted by the host plant on the composite PVY population (r). (a) Pairwise
interaction between Neinoc and VA. (b) Pairwise interaction between Neinoc and Ne. (c) Pairwise interaction
between r and VA (d) Pairwise interaction between VA and Ne. Gray areas correspond to the 95% confidence
Fig. 5 Conditional inference regression tree modelling RB with three explanatory variables. RB is the frequency of breakdown of the pvr23–mediated resistance in 84 pepper DH lines. Three explanatory variables
representing evolutionary forces exerted by the host plant on PVY populations were retained by the analysis: VA, Neinoc and r. Given the parameters of the analysis (minimum number of 10 DH lines in each terminal
‘leaf’ of the tree and default setting for other parameters), the fourth explanatory variable (Ne) was not found
to determine significantly RB. The number of DH lines in each category is indicated in brackets. p: p-value indicating the significance of the variable.
Fig. 6 Interpretation of the combined effects of virus accumulation and differential selection on RB. The effects of virus accumulation (VA) and differential selection (r) on RB, the frequency of resistance
breakdown, were considered for the three groups of DH lines defined by the regression tree (Fig. 5). Represented are the mean relative growth rates of the five PVY variants (uppercase single or double letters) used to estimate r in experiment 4 (Table 1) among each plant group. Letters filled in black correspond to
transitions and letters filled in white to a transversion. Lower case letters represent, for each PVY variant, significant differences in relative growth rates among plant groups (Kruskal-Wallis test, p-value<0.05). Double mutants GK and KN did not appear in the resistance breaking experiments but were used for estimation of r. When VA is high (group 1), the K mutant which confers a high fitness gain to PVY and
requires a transversion is likely to appear. When VA is lower, resistance breakdown involves more likely mutants which require a transition (G and N) but confer lower fitness gains. Since RB was evaluated in experiment 1 (Table 1) with a wild-type PVY, its initial fitness in pvr23-carrying plants is low (fictitious
broken line). Fitness gains associated with resistance-breaking mutations G and N are higher for group 3 than for group 2, despite higher r values in the latter group. This may explain the negative effect of r on
SUPPORTING INFORMATION
Fig. S1 Inference of the relative growth rates of virus variants and of the effective population size of the virus population with 400 datasets simulated with five virus variants and a single sampling date with the method of Rousseau et al., (2017). (a) Correlation between true and estimated relative growth rates ri (all
variants mixed). (b) Correlation between true and estimated harmonic means of effective population sizes Neh (log-scale). In both panels, the black line is the first bisector and the red dashed line is the best linear
Fig. S2 Pairwise relationships between the four explanatory variables related to PVY evolution: VA (within-plant virus accumulation), r (differential selection exerted on the virus population), Ne (virus effective
population size during plant infection) and Neinoc (virus effective population size at virus inoculation). The
Fig. S3 Pairwise relationships between the response variable RB (frequency of breakdown of the pvr23
-mediated resistance) and each of four explanatory variables related to PVY evolution: VA (within-plant virus accumulation), r (differential selection exerted on the virus population), Ne (virus effective population size
Supplementary Information -- Text S1: Analyses of Illumina sequences to detect de novo mutations in PVY populations
Viruses being characterized by high mutation rates, we conducted a sequence analysis to detect potential de novo mutations in virus populations representing the common inoculum and the infected plants. This analysis is similar to the one performed in Rousseau et al. (2017)
(Supplementary material). In all, 660 samples were analyzed, corresponding to all infected plants from the 89 doubled-haploid (DH) lines of pepper, as well as 6 samples representing replicates of the initial inoculum. This analysis is important because the presence of new mutants could affect the dynamics of virus populations and the intensities of the evolutionary forces at stake. We analyzed each nucleotide position in all sequences. First, we focused on the three
single-nucleotide polymorphisms (SNPs) located at codon positions 101, 115 and 119 of the VPg cistron which distinguish the five variants mixed to make the inoculum, i.e. variants G, N, K, GK and KN. For each sequence, we identified the variant among the eight possible (23) at the three
nucleotide positions of interest. By doing so, we could estimate the frequencies of the five variants included in the inoculum and of the three other possible variants carrying alternative SNP
combinations at the three nucleotide positions of interest (i.e. the wild-type variant SON41p and variants GN and GKN). Then, for each of the 666 PVY populations, we determined the relative frequencies of these eight PVY variants. The additional three possible variants SON41p, GN and GKN could have appeared by mutation or recombination, either in vivo or in vitro, and should thus be surveyed. In a second step, we calculated the frequencies of all remaining nucleotide substitutions in each virus population by comparison with the sequence of the SON41p reference clone (equivalent to comparison with sequences of the G, N, K, GK and KN clones).
Sequence counts of the eight variants corresponding to the SNPs present in the initial inoculum
We assigned each sequence to one of the eight potential PVY variants defined by the three SNPs of interest (variants G, N, K, GK, KN, SON41p, GN or GKN). The sum of the frequencies of the three variants SON41p, GN and GKN that had not been included into the inoculum remained below 7% in all virus populations analyzed except for one. The exception concerned plant number 2 of DH line 2109, featuring a surprisingly high frequency of variant SON41p (43.8%), but also a very low total number of sequences (242). This plant sample was removed for estimations of effective population size and selection. In all, 77.58% of samples showed a sum of frequencies of the three variants SON41p, GN and GKN below 2%, and 98.64% were below 5%. Given the low frequencies recorded, we cannot tell if those sequences indeed correspond to variants present in the virus population, or if they are artifacts due to errors during RT-PCR or sequencing (Rousseau et al., 2017).
Frequencies of de novo nucleotide substitutions
The complementary analysis consisted in looking for de novo substitutions at all remaining nucleotide positions and in looking for the two possible remaining substitutions at the three SNP positions of interest, i.e. those that were absent of the inoculum (first part). We focused on the sum of the frequencies of potential de novo substitutions at each nucleotide position, in plant samples or in the inoculum (Table 1 below). In infected plants, 5.60% (3662/65340) of nucleotide positions did not show any de novo substitution (i.e. frequency of 0%). Additionally, 98.70% of nucleotide positions showed a frequency of de novo substitutions below 1%, 99.93% showed a frequency below 5% and 99.94% below 7%.
We expect a total maximum error rate of 0.86% per nucleotide in our experiment, due to the reverse transcription (RT), polymerase chain reaction (PCR) and Illumina MiSeq sequencing steps