HAL Id: tel-01975808
https://tel.archives-ouvertes.fr/tel-01975808
Submitted on 9 Jan 2019
HAL is a multi-disciplinary open access archive for the deposit and dissemination of sci-entific research documents, whether they are pub-lished or not. The documents may come from teaching and research institutions in France or abroad, or from public or private research centers.
L’archive ouverte pluridisciplinaire HAL, est destinée au dépôt et à la diffusion de documents scientifiques de niveau recherche, publiés ou non, émanant des établissements d’enseignement et de recherche français ou étrangers, des laboratoires publics ou privés.
Global linkages, trade network and development
Magali Pinat
To cite this version:
Magali Pinat. Global linkages, trade network and development. Economics and Finance. Université Panthéon-Sorbonne - Paris I, 2018. English. �NNT : 2018PA01E031�. �tel-01975808�
THÈSE DE DOCTORAT
DE L’UNIVERSITÉ PARIS 1 PANTHÉON SORBONNE
ÉCOLE DOCTORALE D’ÉCONOMIE N
o465
par
Magali Pinat
Global Linkages, Trade Network and
Development
Thèse présentée et soutenue à Paris, le 25 septembre 2018
Sous la direction de :
Lionel Fontagné, Professeur, Université Paris 1 Sorbonne & Paris School of Economics, France
Composition du Jury :
Luca de Benedictis (Rapporteur), Professeur, Università degli Studi di Macerata & LUISS University, Italy
Raja Kali (Rapporteur), Professeur, ConocoPhillips Chair in International Economics & Business, University of Arkansas, United States
Anne-Célia Disdier, Directrice de Recherche, CNRS, INRA, & Paris School of Economics, France
Angelo Secchi (Président du Jury), Professeur, Université Paris 1 Sorbonne & Paris School of Economics, France
Il n’y a de bonnes affaires que celles qui sont terminées. Théodore Leclercq
Acknowledgements
First and before all, I would like to thank Lionel Fontagné for having been my advisor. His comments from the very first proposal to the final version of the dissertation have always been clear, rigorous, consistent and to the point. Each of our conversations were dense and of a high quality. I highly appreciated his support and his guidance through all the process. It took me a while, but Bloningen is finally referenced in this dissertation! Merci, vraiment merci.
I feel lucky to have in my dissertation committee people whose work I admire. Many thanks to Luca de Benedictis and Raja Kali to have accepted the role of referees. Both have been pioneers in trade network analysis, and I am honored they accepted to review my work. Many thanks to Anne-Celia Disdier and Jose de Sousa for being part of the committee. Their very constructive comments during the pre-defense have contributed to greatly improve this dissertation. Many thanks to Angelo Secchi for chairing the committee. Hopefully I was able to make the dissertation clearer as he suggested. Also a special thanks to Jean-Christophe Fouillé who made the administrative process so much smoother during these three years and to Loïc Sorel who has been of a great help in the final line.
Completing a PhD is a long journey and life follows its path in parallel. I was lucky enough to get through it with Gabriel on my side. He taught me the principle of roller-coaster of emotions a PhD student goes through, and remind me at each down that the upside will always come again. Elisa, our little bundle of joy, joined the journey right in the middle. Thank you for giving me a worry-free pregnancy, considering sleeping over some nights, and being the most adorable human being on Earth. More importantly, thanks to both of you for making me so happy. These acknowledgements are dedicated to those who contributed to the completion of my
dissertation, and having a truly happy life outside of the PhD was perhaps the main reason of success.
Unfortunately, educational achievements are still very correlated to the familiar environment. Fortunately, I was born in a family that have always been supportive, backing up any of my educational decisions. Merci Maman for all your support, for being on my side, for not sharing all the worries you surely had, and for always supporting my decisions, even if they include building my life in the other side of the Atlantic. Merci too for proof-reading the French sum up of my dissertation – a role that only a mother could have accepted! Merci also to my grand-mother, my Mamichou, for the strong inspirational role she had in my life.
While completing my PhD, I worked in parallel in several offices, and met many very supportive colleagues. Tatiana Didier, my first boss, who become my true friend deserves a huge thank for the empowerment she gave me and the example she has been for me. My dissertation benefited from long conversations with Tito Cordella, Joaquin Urrego, and Anderson Ospina. Two of the four chapters of my dissertation are co-authored papers. Thank you Tatiana Didier, Yevgneyia Korniyenko, Brian Dew and Sebastian Herrádor for having contributed to this journey.
My PhD is also the fruit of a voyage across different institutions that contributed to my formation in economics: University Paris Dauphine, Universidad Católica de Chile, Paris School of Economics, University Paris 1 Sorbonne, the World Bank and the International Monetary Fund. On my way, there was one important high school professor, who detected my early interest in economics. Merci Mireille Kral. I was for the first time exposed to international economics as a research assistant of a Paris Dauphine professor. Merci Jean-Marc Siroën. A professor at the PSE triggered a full change in my life just after I finished my master. Merci Romain Rancière. A boss
taught me how important is talking clearly about complex subjects. Gracias Augusto de la Torre.
I had also been supported by a team of close friends. Arthur Poirier deserves a special thanks for being during these three years my one-stop for questions relative to a PhD. I shared my fears and roller coaster emotions with my close friend Nathaly Rivera while we were both going through the PhD. I benefited from the longstanding support of Yacine Rouimi who has always believed more in my work than I do. I will forever remember assisting to the PhD defense of my cheRRYshed friend Amandine Vecina Issautier, a PhD in quantic red clouds physic, and not understanding anything beside the opening slide. It is a great honor to join the club Vecina! My dear friends Alexandre Deyieux and David Gonzalez de Cabo, early proof-readers of some of my research and travel companions across the world, have highlighted all my PhD-related trips to Paris. Merci les ami.e.s.
Contents
Acknowledgements . . . v
List of Tables . . . xiii
List of Figures . . . xv
Résumé 1 Introduction 23 1 Diffusion of Ideas and Centrality in the Trade Network 45 1.1 Introduction . . . 46
1.2 Literature review . . . 49
1.2.1 Growth theory, idea flow literature and trade . . . 49
1.2.2 Import openness, economic growth and network effect . . . 52
1.3 Theoretical framework . . . 55
1.3.1 Framework . . . 56
1.3.2 Maximizing the diffusion of ideas and centrality of trade partners 61 1.4 Empirical strategy . . . 62
1.4.1 Baseline regression equations and extensions . . . 62
1.4.2 Empirical methodology . . . 64
1.4.3 Data . . . 66
1.4.4 Results . . . 68
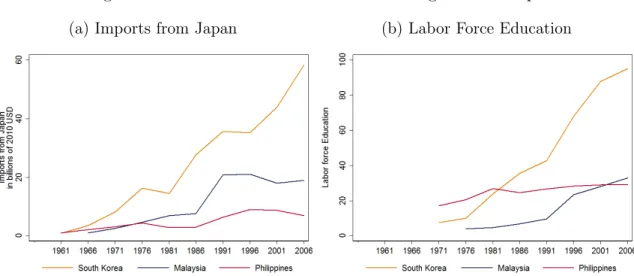
Appendix 1.A Two illustrative case study: South Korea and Colombia . . 91
1.A.1 The case of South Korea . . . 91
1.A.2 The case of Colombia . . . 92
Appendix 1.B Dynamic of the evolution of the central countries . . . 98
Appendix 1.C Random Walk Betweenness Centrality . . . 103
2 Timing of Technology Adoption and Clustering in Trade Network 111 2.1 Introduction . . . 112
2.2 Definition and determinants of clusters’ boundaries . . . 115
2.2.1 Trade cluster algorithm . . . 117
2.2.2 Determinants of cluster boundaries . . . 118
2.3 Literature Review on Technology Adoption and Network Effects . . . 125
2.3.1 Process of technology adoption . . . 125
2.3.2 Traditional determinants of technology adoption . . . 126
2.3.3 Value chain and technology diffusion . . . 128
2.3.4 Network effects in adopting new technologies . . . 129
2.4 Modeling technology adoption in a clustered network . . . 131
2.5 Empirical approach . . . 135
2.5.1 Importance of clusters in technology adoption . . . 135
2.6 Conclusion . . . 144
Appendix 2.A Geographical maps . . . 154
Appendix 2.B Methodology . . . 155
2.B.1 Rosvall and Bergstrom (2008) algorithm on detection of com-munities . . . 155
Appendix 2.C Data . . . 156
3 Network Determinants of Mergers and Acquisitions Decisions 161
3.1 Introduction . . . 162
3.2 Literature Review . . . 164
3.2.1 Traditional determinants of M&A investment . . . 164
3.2.2 Network determinants of M&A decision . . . 166
3.3 Methodology . . . 168
3.3.1 Exponential random graph model . . . 168
3.3.2 Temporal exponential random graph model . . . 170
3.3.3 Obtaining convergence . . . 171
3.4 Data and descriptive statistics . . . 172
3.4.1 Dyad level variables . . . 175
3.4.2 Network level variables . . . 176
3.5 Results . . . 177
3.5.1 Logit estimations . . . 177
3.5.2 ERGM estimations . . . 179
3.5.3 TERGM estimations . . . 181
3.6 Concluding remarks . . . 182
Appendix 3.A Sample and descriptive statistics . . . 187
3.A.1 Country sample . . . 187
3.A.2 Descriptive statistics . . . 188
Appendix 3.B Goodness of fit for ERGM results . . . 190
Appendix 3.C Goodness of fit for TERGM results . . . 196
4 Assessing the Fragility in Global Trade: The Impact of Natural Dis-asters Using Network Analysis 199 4.1 Introduction . . . 200
4.2 Empirical Methodology . . . 204
4.2.2 Classifying overall product fragility . . . 209
4.3 Results and Analysis . . . 210
4.3.1 Descriptive statistics . . . 210
4.3.2 Countries’ fragility and origins of risk . . . 212
4.4 Validation of the Methodology . . . 217
4.4.1 Case studies . . . 217
4.4.2 Cross-country past event validity of the index . . . 221
4.5 Conclusion and Potential Applications . . . 227
Appendix 4.A Technical details on the definition of components and the overall product fragility measure . . . 237
4.A.1 Outdegree centrality . . . 237
4.A.2 Tendency to cluster . . . 238
4.A.3 International substitutability . . . 240
4.A.4 Classifying overall product fragility . . . 240
Appendix 4.B Descriptive statistics . . . 242
4.B.1 Frequency of products . . . 242
4.B.2 List of risky products . . . 242
Appendix 4.C Fragility maps over time . . . 245
Appendix 4.D Alternative to the third component . . . 247
Appendix 4.E Alternative using all the products available . . . 249
Appendix 4.F Countries’ response after a a disaster in a provider of risky goods . . . 251
List of Tables
1.1 Baseline Results and Alternative Estimation Strategies . . . 70
1.2 Influence of the centrality of import partners on economic growth . . 73
1.3 Potential gain of increasing imports from central countries . . . 74
1.4 Sample of countries . . . 105
1.5 Descriptive Statistics . . . 106
1.6 Source variables . . . 107
1.7 Influence of the centrality of import partners on economic growth . . 108
1.8 Differentiated impact of the core partners in function of dynamic . . . 109
2.1 Predictability of cluster formation based on gravity and RTA variables 121 2.2 Results of OLS pooled regression . . . 140
2.3 Influence of multipolarization . . . 144
2.4 Data of adoption of technology . . . 157
2.5 Description of the variables . . . 158
2.6 Robustness check of Table 2.2 . . . 159
3.1 Estimations of M&A determinants using Logit estimates . . . 178
3.2 Estimations of M&A determinants using the Exponential Random Graph Model . . . 180
3.3 Estimations of M&A determinants using the Temporal Exponential Random Graph Model . . . 182
3.4 Descriptive statistics for 2016 . . . 188
3.5 Descriptive statistics for 2000-2016 . . . 189
3.6 Estimation of M&A in Primary sector determinants using ERGM pro-cedure . . . 193
3.7 Estimation of M&A in Light Manufacturing determinants using ERGM procedure . . . 194
3.8 Estimation of M&A in Heavy Manufacturing determinants using ERGM procedure . . . 195
4.1 Top 10 risky import products by their value in trade . . . 210
4.2 Selected risky products exported by Japan in 2010, one year before 2011 earthquake and nuclear disaster . . . 218
4.3 Selected risky products exported by Thailand in 2010, one year before 2011 floods . . . 221
4.4 Cross-country regressions . . . 226
4.5 Robustness check on cross-country regressions (1) . . . 227
4.6 Robustness check on cross-country regressions (2) . . . 228
4.7 Number of products in each category over time . . . 242
4.8 One hundred most traded risky products during 2003-2014 . . . 243
4.9 Correlation Component 3 and Hausman, Hidalgo and Rodrik 2007’s Product Complexity Index (PCI) by year . . . 247
4.10 Top 10 risky import products by their value in trade . . . 248
4.11 Case studies with alternative Component 3 . . . 248
4.12 Number of products in each category over time . . . 249
4.13 Top 10 risky import products by their value in trade . . . 250
List of Figures
1 Part mondiale du PIB et des exports . . . 2
2 Centralité et communautés de commerce . . . 5
3 Composition sectorielle des flux de fusions et acquisitions transfrontal-ières . . . 7
4 Plan de la thèse . . . 12
5 World share of GDP and exports of goods and services . . . 24
6 Centrality and clusters . . . 27
7 Sectoral composition of cross-border mergers and acquisitions (M&A) flows . . . 29
8 Sectoral composition of cross-border mergers and acquisitions (M&A) flows . . . 33
1.1 Total Growth Effects of Increasing the Share of Trade with Central Countries by a SD . . . 75
1.2 Total Growth Effects of Increasing the Share of Trade with Core and Inner-Periphery by a SD . . . 77
1.3 Total Growth Effects of Increasing the Share of Trade with Core at the technological frontier, other Core and Inner-Periphery by a SD . . . 79
1.4 Selected EAP economies GDP and trade openness evolution . . . 92
1.5 Factors that led South Korea to get to develop . . . 93
1.7 Share of Bolivia and Colombia total imports from core countries . . . 94
1.8 Imports by origin country . . . 96
1.9 Bolivia and Colombia GDP per capita and labor force education evolution 97 1.10 Evolution of high-tech exports in Bolivia and Colombia . . . 97
1.11 Evolution of selected countries centrality . . . 99
1.12 Evolution of trade network centrality for selected countries . . . 100
1.13 Evolution of the countries’ centrality between 1980 and 2012 . . . 101
1.14 Distribution centrality measure over time . . . 102
2.1 Clusters in global networks . . . 116
2.2 Kernel density of M&A inflows growth among countries in the same cluster . . . 122
2.3 Kernel density of intermediary good trade growth among countries in the same cluster . . . 123
2.4 Histogram of military spending from countries in the same cluster . . 124
2.5 Kernel density of the share of total imports from countries in the same cluster . . . 125
2.6 Adoption of emails across a network with clusters . . . 134
2.7 Adoption of emails in a clustered network with switching countries . . 135
2.8 Evolution of clusters overtime . . . 142
2.9 Clusters in global networks . . . 154
3.1 M&A investment network by sector in 2016 . . . 173
3.2 M&A investments sample . . . 174
3.3 Primary sector . . . 190
3.4 Light manufacturing . . . 191
3.5 Heavy manufacturing . . . 192
3.7 Light manufacturing . . . 197
3.8 Heavy manufacturing . . . 198
4.1 Detection of the presence of central players using network analysis . . 206
4.2 Detection of the tendency to cluster using network analysis . . . 208
4.3 Industry classification of products traded in 2014 . . . 211
4.4 HS classification by section of products traded in 2014 . . . 212
4.5 Importers of risky products, 2014 . . . 215
4.6 Exporters of risky products and Risk of Supply Shock in 2014 . . . . 216
4.7 Network analysis of diesel engines . . . 219
4.8 Macroeconomic spillovers of importing risky products from Japan . . 222
4.9 Macroeconomic spillovers of importing risky products from a country impacted by a disaster, 2003-2014 . . . 223
4.10 Different level of clustering coefficient . . . 239
4.11 Share of Total Imports of fragile products . . . 245
Résumé
Le système économique mondial n’est plus ce qu’il était au XXe siècle, lorsque les économies avancées (AE1) opéraient en tant que « centre » d’une « périphérie »
d’économies émergentes et en développement (EMDE2). La dynamique des EMDE
amène à penser au-delà de cette dichotomie. Les caractéristiques des AE et EMDE ont évolué, suggérant l’émergence d’une économie mondiale beaucoup plus multipo-laire. En particulier, l’association traditionnelle entre « centre » et « AE » versus « périphérie » et « EMDE » s’érode, certains pays émergents devenant des acteurs majeurs du paysage économique mondial.
Quelques statistiques mettent en lumière l’ampleur et la rapidité de ces change-ments (cf. graphique 1). En 1980, le produit intérieur brut (PIB) des EMDE (défini comme l’ensemble des pays n’appartenant pas à l’OCDE en 19803) représentait
en-viron 20% du PIB mondial. En 2016, les EMDE ont capturé plus de 40% du PIB mondial. L’expansion des EMDE est tout aussi frappante en termes de flux commerci-aux et financiers. Les pays EMDE représentaient environ 30% des flux commercicommerci-aux mondiaux en 1980, alors qu’en 2016 ils représentaient environ 47%. De même, les EMDE ont capturé environ 13% des entrées de capitaux mondiaux en 1980 ; en 2016, ils ont reçu plus de 40% du total. Ils sont également devenus plus représentatifs en
1
Acronyme en anglais correspondant aux Advanced Economies.
2
Acronyme en anglais correspondant aux Emerging Markets and Developing Economies.
3
Les pays de l’OCDE en 1980 comprennent : Australie, Autriche, Belgique, Canada, Dane-mark, Finlande, France, Allemagne, Grèce, Islande, Irlande, Italie, Japon, Luxembourg, Pays-Bas, Nouvelle-Zélande, Norvège, Portugal, Espagne, Suède, Suisse, Turquie, Royaume-Uni et les États-Unis.
Figure 1: Part mondiale du PIB et des exports
(a) Part mondiale du PIB (b) Part mondiale des exports
Source: WDI.
Note: Le graphique de gauche présente l’évolution de la part du PIB mondial ; le graphique de droite montre la part mondiale des exportations de biens et de services.
tant que pays d’origine, en étant à l’origine de 30% des capitaux mondiaux en 2016, contre 6% en 1980. Bien que la Chine ne soit pas la seule économie EMDE derrière ces tendances, elle a joué un rôle important depuis son accession à l’Organisation mondiale du commerce en 2001. Au cours des dernières années, le processus de rat-trapage a été freiné dans certaines grandes économies émergentes —les économies brésilienne, russe et sud-africaine ont ralenti ou sont entrées en récession alors que l’économie chinoise s’est rééquilibrée vers une consommation intérieure plus forte avec un rythme plus lent.
Cette reconfiguration radicale du paysage économique mondial - en particulier l’abandon du modèle traditionnel des pays à revenu élevé au centre et des pays en développement à la périphérie - a également apporté des changements significatifs à l’analyse traditionnelle du commerce et de la finance internationale. Cette thèse doctorale contribue à l’analyse de l’impact des développements récents des structures des réseaux commerciaux et financiers sur la diffusion internationale de la technologie (chapitre 1), la vitesse d’adoption des nouvelles technologies (chapitre 2), la
proba-bilité d’investir dans un nouveau pays (chapitre 3), et le risque de perturbation de la production (chapitre 4). Avant de passer au contenu de la thèse, ce chapitre intro-ductif expose les changements récents dans la structure des réseaux commerciaux et financiers dont les impacts seront analysés dans les prochains chapitres.
Comme point de départ de cette analyse, ce chapitre introductif présente quatre faits 4 liés à la montée des EMDE :
1. Plusieurs pays émergents sont désormais au centre du réseau commercial mon-dial.
2. Les communautés de commerce ont changé au fil du temps.
3. Le réseau financier mondial n’a pas été fondamentalement restructuré, mais les EMDE sont maintenant plus intégrées que par le passé.
4. La production des biens est plus fréquemment impactée que par le passé après une catastrophe naturelle dans un pays fournisseur de biens intermédiaires.
Fait n˝
1 : Plusieurs économies émergentes ont rejoint les AE au centre du réseau commercial mondial.
Cet important changement est visible sur les figures du graphique 2, qui montrent les réseaux commerciaux mondiaux en 1980 et en 2012. Chaque nœud représente un pays, tandis que les couleurs différencient les économies avancées (en orange) des économies émergentes (en bleues). Chaque lien correspond à l’existence d’une connex-ion bilatérale active, correspondant aux exportatconnex-ions d’un pays vers un autre, comme indiqué par les flèches. Les pays qui captent une plus grande part des exportations d’autres pays et qui sont liés à un plus grand nombre de partenaires commerciaux
4Les faits 1 et 2 sont tirés d’un document de travail co-écrit avec Augusto de la Torre et Tatiana
(c’est-à-dire les pays les plus importants du réseau mondial) apparaissent à droite dans le graphique 2.
En 1980, un ensemble d’économies avancées se situait à ce qui peut être em-piriquement caractérisé comme le centre du réseau commercial mondial : les États-Unis, l’Allemagne (et quelques autres pays d’Europe occidentale) et le Japon étaient au cœur du réseau. En 2012, plusieurs pays émergents, comprenant non seulement la Chine mais aussi le Brésil, l’Inde, la Fédération de Russie, l’Afrique du Sud, la Turquie et d’autres, se sont déplacés vers le centre. À la suite de ces changements, les EMDE ne sont plus synonyme de périphérie et les AE ne sont plus synonymes de centre du commerce mondial.
Fait n˝
2 : Les pôles commerciaux ont changé au fil du temps.
Le graphique 2 illustre également la similarité de la structure des relations com-merciales entre les pays : plus proches sont deux pays sur le graphique, plus ils ont des parts d’exportations similaires avec le reste du monde. Au cours des années 1980 et 1990, les pays centraux du réseau (situés à droite) sont très proches les uns des autres, ce qui reflète un degré élevé de similitude dans la structure de leurs relations commerciales avec les autres pays du réseau. Le réseau commercial mondial en 1980 avait donc tendance à afficher une « polarité unique », les économies avancées agissant comme un seul pôle (c’est-à-dire jouant le même rôle) dans le commerce mondial.
Le réseau commercial mondial en 2012 révèle un changement radical : plusieurs pays parmi les EMDE apparaissent sur la partie droite en bas du graphique 2, ce qui indique leur pertinence accrue pour le commerce mondial. Cependant, ils restent éloignés (le long de la dimension verticale) des économies avancées sur le côté droit de la figure. Ce côté du graphique ressemble à une étoile, avec de petits groupes de pays centraux placés à une certaine distance les uns des autres. La Russie et la Turquie, par exemple, ne sont pas situées à proximité des économies avancées européennes, et
Figure 2: Centralité et communautés de commerce
(a) 1980
(b) 2012
Source: Calculs basés sur la base de données DOTs.
Note: Le graphique estime l’ampleur et la direction des exportations. Un algorithme de composante principale est ensuite appliqué à la matrice de part des exportations afin de déterminer la position de chaque pays dans le réseau commercial. Le long de l’axe horizontal, les pays sont répartis en fonction de leur centralité dans le réseau commercial. Les pays les plus centraux sont situés à la droite du graphique. L’axe vertical indique la similarité de la structure des exportations entre les pays. Une distance plus faible entre deux pays indique une structure plus similaire, en termes d’exportations vers le reste du monde et d’importance relative pour les autres partenaires commerciaux.
le Japon n’est proche ni de la Chine ni de la Corée. Le paysage commercial mondial est devenu plus hétérogène et « multipolaire ».
La dispersion du processus de production entre les pays soutient ces schémas de regroupement autour de pôles. Les chaînes mondiales de valeur sont en effet issues d’un nombre limité de pays qui se groupent pour produire un bien. Hernández et al. (2014) mettent en évidence le cas du secteur laitier en Amérique centrale. Des entreprises au Salvador ont établi des partenariats avec le Nicaragua pour produire du fromage qui est ensuite vendu aux États-Unis ; Morris et al. (2011) soulignent le développement des chaînes régionales de valeur parmi les fabricants de vêtements, dirigées par l’Afrique du Sud et étendues au Lesotho et au Royaume du Swaziland.
Fait n˝
3 : Contrairement au réseau commercial mondial, le réseau fi-nancier n’a pas été fondamentalement restructuré ; mais les EMDE sont maintenant plus intégrées que par le passé.
Une caractéristique clé de la nouvelle dynamique de l’économie mondiale a été l’asymétrie dans la structure des changements entre le commerce mondial et les réseaux financiers. Dans le domaine du commerce, la correspondance traditionnelle entre les AE et le centre, et les EMDE et la périphérie, a été reconfigurée. En re-vanche, dans le domaine de la finance, les Aes restent seules au centre des réseaux financiers mondiaux, bien que les EMDE aient accru leur connectivité.
La croissance des EMDE a été généralisée. Au fur et à mesure que les EMDE prenaient de l’importance dans l’économie mondiale, le nombre de leurs connexions internationales bilatérales a augmenté. Les flux de fusions et acquisitions sont par-ticulièrement importantes dans l’industrie lourde (55% depuis 2011, graphique 3). L’investissement dans le secteur primaire a augmenté et est maintenant plus impor-tant que les investissements dans l’industrie légère (25% contre 20% depuis 2011).
Figure 3: Composition sectorielle des flux de fusions et acquisitions transfrontalières
Source: Calculs basés sur la base de données SDC platinium.
Note: Le secteur primaire comprend l’agriculture, la chasse, la foresterie, la pêche, l’exploitation minière, le pétrole brut et le gaz naturel. L’industrie légère comprend les produits alimentaires, les boissons, le tabac, le textile, les vêtements (y compris le cuir), et les produits liés au bois et au papier. L’industrie lourde comprend le pétrole raffiné et les produits connexes, les produits chimiques et les plastiques, les minéraux non métalliques, les métaux, les machines et le matériel et les équipements de transport.
Fait n˝
4 : L’internationalisation des processus de production a accru l’interdépendance des pays.
La dispersion des processus de production, évoquée dans le fait n˝2, a accru
l’interdépendance entre les pays. Les estimations suggèrent l’existence de points d’étranglement spécifiques dans le réseau commercial mondial qui deviennent par-ticulièrement saillants après une catastrophe naturelle. Le tremblement de terre au Japon en 2011 est maintenant un événement très étudié qui met en lumière la façon dont une catastrophe localisée peut avoir un effet de contagion important sur de nom-breux pays à travers le monde. Les pays qui importaient des facteurs de productions de la zone touchée à Fukushima ont dû interrompre leur production pendant des jours, voire des mois, en raison du retard pris en amont par les entreprises japonaises. Cela s’est produit dans le cas de l’entreprise Apple, qui importait le verre de son écran
tactile de l’iPad 2 exclusivement d’Asahi Glass, une entreprise située dans la province de Fukushima. Après le tremblement de terre, l’entreprise a retardé de cinq semaines la livraison du verre de l’écran tactile, ce qui a provoqué un retard de deux mois du lancement de l’iPad 2.
L’augmentation de l’importance des chaînes internationales de valeur a conduit à une plus haute interdépendance des pays. Une catastrophe naturelle dans un des pays fournisseurs de biens intermédiaires a maintenant une forte probabilité de perturber la production dans d’autres pays.
Énoncé de la question de recherche
Les relations internationales sont traditionnellement étudiées à travers l’analyse des liens bilatéraux. Cependant, l’intensification et la complexification des liens interna-tionaux exigent une analyse plus globale, dans laquelle non seulement les caractéris-tiques au niveau du pays et entre deux pays sont prises en compte, mais où les relations sont également considérées du point de vue du réseau. Cette dissertation porte sur la manière dont les réseaux affectent les relations économiques internationales, en particulier le commerce et la finance, et évalue leurs impacts sur les trajectoires de développement des pays.
Comment la structure du réseau influence-t-elle les relations internationales ? • Quelles sont les conséquences de la dynamique des réseaux pour la croissance
économique, la diffusion de la technologie, les processus de production et le développement ?
• Comment les caractéristiques du réseau telles que la centralité, les communautés de commerce et la transitivité importent-elles ?
• Quelles sont les fragilités du processus de production à la lumière des carac-téristiques du réseau ?
Pourquoi étudier les relations internationales en
util-isant l’analyse de réseau ?
L’objectif de cette thèse est de revisiter certaines questions d’économie internationale, en utilisant les outils d’analyse de réseau. Les outils d’analyse de réseau sont de plus en plus utilisés pour étudier le commerce et la finance internationale pour de multiples raisons.
En se référant à leur utilisation pour analyser les données du commerce interna-tional, De De Benedictis et al. (2014) déclarent : « L’analyse de réseau est fonda-mentalement liée aux analyses des relations. » De nombreux aspects des relations internationales sont étudiés en fonction des caractéristiques individuelles des pays (comme la population ou le PIB) ou en fonction des caractéristiques de leurs rela-tions (comme la distance géographique). Cependant, une troisième composante de ces relations a été moins étudiée, et De Benedictis et al. (2014) la décrit comme la « dimension structurelle ». Les relations entre deux pays ne peuvent pas être analysées indépendamment des effets des pays tiers. La notion d’interdépendance est centrale dans l’analyse de réseau.
Des études ont tenté de mesurer l’interdépendance et les effets des pays tiers sur le commerce et la finance. Dans l’article publié dans l’American Economic Review, Anderson and Van Wincoop (2003) tentent d’identifier les barrières non observables au commerce international en estimant une résistance commerciale multilatérale (MRT) entre deux partenaires commerciaux. Leurs résultats théoriques montrent comment les exportations du pays i vers le pays j sont déterminées par le coût du commerce du pays i par rapport à sa « résistance » globale aux importations (toutes choses égales par ailleurs, plus le coût commercial général et la résistance moyenne des exportateurs du pays i sont hauts, plus les exportateurs du pays i sont poussés à commercer avec le pays j).
Il est difficile d’estimer la résistance commerciale multilatérale. Anderson et Van Wincoop (2003) utilisent des méthodes itératives pour estimer les effets d’une hausse de la résistance commerciale multilatérale, mais cette procédure n’est pas souvent utilisée car elle nécessite une approche non linéaire utilisant la méthode des moindres carrés ordinaires. Des alternatives plus simples incluent l’utilisation d’une variable d’éloignement ou d’effets fixes (Rose and Van Wincoop (2001); Feenstra (2005); Bald-win and Taglioni (2006)).
Une autre tentative théorique et empirique importante d’introduire des effets de réseau à l’analyse du commerce international a été faite dans Chaney (2014). Dans son article, une entreprise exportant vers un pays i durant l’année t est plus sus-ceptible d’entrer en t ` 1 dans le pays j, un pays géographiquement proche de i, et ce même si j n’est pas proche du pays d’origine de l’entreprise. Ce résultat est dû à la dynamique informationnelle. Chaney (2014) prouve cette prédiction théorique en utilisant des données d’entreprises françaises. La littérature sur les « plateformes d’exportation » (Ekholm et al. (2007), Yeaple (2003), Bergstrand and Egger (2007)) souligne également l’importance des partenaires dans le choix de nouvelles destina-tions d’exportation. Les plateformes d’exportation font références aux situadestina-tions dans lesquelles un pays investit dans un pays hôte avec l’intention de desservir des marchés « tiers ».
L’analyse de réseau permet d’analyser l’impact de la structure sur le réseau que la littérature existante n’étudie pas systématiquement. Dans cette approche, les effets des pays tiers ne sont pas réduits à un effet moyen, masquant l’hétérogénéité entre les pays tiers. À mesure que les économies deviennent plus globalisées, les analyses des relations internationales à travers les lentilles de réseau deviennent plus nécessaires.
Pendant longtemps, les auteurs manquaient d’outils pour mesurer correctement l’intégration économique internationale (Kali and Reyes (2007)). Les progrès de la théorie des réseaux et de l’économétrie, la disponibilité de nouvelles bases de données
bilatérales et l’augmentation de la capacité informatique ont ouvert de nouveaux horizons de recherche et donné de nouveaux outils aux économistes pour étudier les liens entre les pays (Albert and Barabási (2002); Newman (2005); Galeotti et al. (2010); De Martí and Zenou (2009); Jackson (2010); Newman (2010)).
Cette dissertation permet d’inclure l’hétérogénéité des effets des pays tiers dans les relations commerciales et financières. L’analyse de réseau y est appliquée à différentes bases de données bilatérales de commerce et de finance afin d’étudier le système en tant que réseau interconnecté. L’approche en réseau permet d’étudier la pertinence de certaines caractéristiques du réseau, telles que la centralité des partenaires com-merciaux, l’impact des communautés de commerce et l’importance des relations tri-angulaires sur la diffusion de nouvelles technologies, l’augmentation de la productivité et le développement des investissements, ainsi que sur l’augmentation des risques de disruption de la production.
Plan de la thèse
Cette thèse est composée de quatre chapitres. Comme illustré dans le graphique 4, les chapitres 1 à 3 proposent d’étudier l’impact des réseaux commerciaux et financiers sur le développement des pays, tandis que le chapitre 4 met en évidence les risques émergeant de la structure du réseau. Les chapitres 1, 2 et 4 étudient le commerce international, tandis que le chapitre 3 se penche sur la finance internationale.
Chapitre 1 : Diffusion des idées et centralité dans le réseau commercial Le chapitre 1 analyse la diffusion des idées à travers le commerce international. Dans ce chapitre, la notion d’impact des partenaires commerciaux est essentielle : si la diffusion des connaissances par le biais du commerce est bilatérale (un pays apprend de son partenaire commercial), l’impact économique de cette diffusion dépend
Figure 4: Plan de la thèse
de la pertinence du partenaire dans le réseau commercial. Dans Coe et al. (1997), les auteurs établissent qu’ « en échangeant avec un pays industriel disposant d’un ‘stock de connaissances’ plus important, un pays en développement a plus à gagner à la fois en terme de produits qu’il peut importer et des connaissances directes qu’il peut acquérir ». Ce chapitre fait valoir que l’association entre pays industrialisés et larges stocks de connaissances n’est plus pertinente, car la frontière entre le niveau de développement et la position dans le réseau commercial est plus floue que par le passé (graphique 2). Au lieu des pays industrialisés, le chapitre fait valoir que les pays les plus centraux sont ceux qui ont les plus grands stocks de connaissances. Plus un partenaire est important (central) dans le réseau commercial, plus les connaissances acquises grâce au commerce avec ce partenaire affecteront la croissance d’un pays.
La première contribution du chapitre 1 est théorique. Le modèle ricardien multi-pays du commerce international d’Alvarez et al. (2017) et Buera and Oberfield (2017) est réinterprété en utilisant l’analyse de réseau. Les pays centraux d’un réseau com-mercial ont tendance à être à la frontière des idées. Ces pays sont les principaux moteurs de la diffusion des connaissances. Les pays qui développent des liens étroits avec les pays du centre sont plus susceptibles d’acquérir des technologies récentes, d’améliorer leur productivité et d’augmenter leurs revenus.
Le chapitre se tourne ensuite vers l’évaluation empirique de la théorie. Pour la pre-mière fois dans la littérature sur le commerce, le chapitre utilise la mesure de la central-ité d’intermédiarcentral-ité par marche aléatoire (RWBC5) développée par Newman (2005)
et Fisher and Vega-Redondo (2006). La mesure de la centralité d’intermédiarité est mieux adaptée à la notion de flux d’idées dans le réseau. Cette mesure souligne l’influence d’un pays sur les autres pays. Un pays avec une centralité élevée a une forte influence dans la transmission des idées et des technologies à travers le réseau.
Troisièmement, dans le cadre d’un système de méthodes généralisées des moments (S-GMM6), les estimations confirment que les pays qui ont développé plus de liens avec
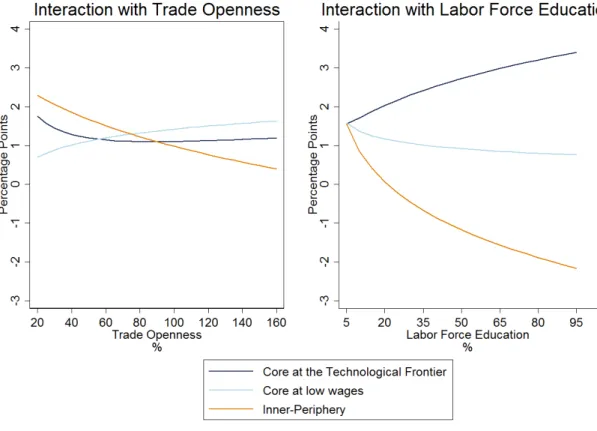
les partenaires commerciaux centraux ont eu une croissance plus forte. L’importance du canal d’apprentissage est confirmée. Les pays où l’éducation de la population active est la plus élevée bénéficient davantage des échanges avec les pays du centre que ceux qui ont des travailleurs moins instruits. Les gains potentiels pour les pays à forte intensité de main-d’œuvre peuvent atteindre 2 points de croissance du PIB.
Chapitre 2 : Timing de l’adoption des nouvelles technologies et com-munauté de commerce
Le chapitre 2 explore les déterminants d’une adoption plus rapide des nouvelles technologies. Dans les études théoriques et empiriques antérieures, l’importance du commerce avec les partenaires était un facteur clé d’une adoption plus rapide des nouvelles technologies. Cette étude prolonge cette idée et conclut que les partenaires commerciaux ne contribuent pas de manière égale. Plus précisément, les partenaires commerciaux appartenant aux mêmes communautés commerciales sont plus suscep-tibles de favoriser l’adoption de nouvelles technologies.
La première contribution du chapitre est l’utilisation de l’algorithme de détection des communautés de Rosvall and Bergstrom (2008) (RB) pour identifier les groupes de
5Acronyme en anglais correspondant à la Random Walk Betweeness Centrality.
pays dans le réseau commercial. Les recherches antérieures ont utilisé des définitions basées sur des similitudes dans la matrice des exportations qui ne garantissent pas que les pays qui font du commerce appartiennent à la même communauté ou à des méthodologies telles que la moyenne k, qui requièrent l’imposition du nombre de communautés a priori. L’algorithme RB utilise la marche aléatoire comme proxy des flux commerciaux et décompose le réseau en communautés de pays en « compressant une description du flux de probabilité ». L’algorithme RB vise à identifier la colonne vertébrale du réseau en regroupant les pays en communautés représentant sa structure principale. Il ne requiert pas l’imposition du nombre de communautés a priori.
Deuxièmement, ce chapitre décrit le mécanisme de formation des communautés dans le réseau commercial. Après avoir montré que les variables de gravité ne per-mettent pas de déterminer les limites des communautés commerciales, les résultats indiquent que les intentions de développer une chaîne de valeur conduisent à la for-mation de nouvelles communautés. L’analyse des pays qui changent de communauté montrent que ceux qui changent reçoivent plus d’entrées d’investissements et aug-mentent leur commerce de biens intermédiaires avec les membres de leur nouveau groupe.
Troisièmement, cette étude offre une contribution théorique en fournissant un aperçu de la façon dont les communautés influencent le processus de diffusion de la technologie, en imitant la possibilité d’une cascade complète. Dans ce cadre, les pays adoptent une nouvelle technologie lorsqu’un nombre suffisant de partenaires commer-ciaux l’ont déjà adoptée. Contrairement à la littérature théorique sur l’adoption de la technologie, l’existence de communautés implique que la technologie est adoptée dans le groupe de l’innovateur, mais pas plus loin. Une augmentation du nombre de communautés dans un réseau a deux implications théoriques sur le processus de dif-fusion de la technologie : un impact négatif lorsque le nombre de pays dans le cluster d’innovateurs diminue, mais aussi un impact positif car il y a plus de communautés.
La quatrième contribution est l’estimation empirique de l’impact des pôles com-merciaux sur l’adoption de la technologie. Alors qu’une technologie se diffuse parmi les partenaires commerciaux (en adéquation avec les contributions passées), le processus d’adoption est plus rapide parmi les pays d’une même communauté (conformément aux implications du modèle théorique). La première approche utilise la méthode groupée des moindres carrés ordinaires pour tester si le fait d’avoir un partenaire commercial au sein d’une même communauté favorise l’adoption d’une technologie par un pays. Les résultats indiquent un effet causal statistiquement significatif. Le résultat est robuste à diverses spécifications et variables de contrôle.
Ensuite, cette étude explore l’influence du nombre de communautés et de leur com-position sur le timing de l’adoption d’une nouvelle technologie. L’augmentation du nombre des communautés favorise l’adoption de la technologie, mais simultanément, la réduction du nombre de pays dans les communautés a un impact négatif. Ce double effet conduit à l’existence d’un nombre optimal de communautés. Si l’évolution au cours des dernières décennies a eu un effet positif sur la diffusion de la technologie, cela pourrait ne pas être le cas si le nombre de communautés continue d’augmenter.
Chapitre 3 : Les déterminants de réseau des décisions de fusions-acquisitions
Le chapitre 3 évalue si les décisions de fusions-acquisitions sont basées sur des effets de réseau. Conformément à la littérature sur les plates-formes d’exportation et les obstacles informationnels, le chapitre conclut sur l’importance des pays tiers dans la création de nouveaux investissements.
La première contribution de ce chapitre est d’utiliser des outils économétriques de réseau pour intégrer l’impact des pays tiers. Des modèles de graphe aléatoire exponentiel (ERGM7) et de graphe aléatoire exponentiel temporel (TERGM8) sont
7Acronyme en anglais correspondant aux Exponential Random Graph Models.
utilisés pour estimer les déterminants des investissements de fusions-acquisitions au niveau sectoriel. À la différence des modèles d’estimations traditionnels, les ERGM et TERGM permettent l’analyse de dépendances plus élevées. Le réseau de fusions-acquisitions observé est considéré comme l’un des nombreux qui pourraient avoir eu lieu. Il représente la réalisation d’un tirage au sort à partir d’une distribution de tous les réseaux de fusions-acquisitions possibles. Les inférences statistiques donnent des informations sur les déterminants du réseau réalisé, en particulier la probabilité de transitivité dans la réalisation de nouveaux investissements.
La deuxième contribution de ce chapitre est dans les résultats empiriques. Les estimations montrent que la transitivité est importante : un pays est plus susceptible d’investir dans une destination où l’un de ses partenaires a déjà réalisé une fusion-acquisition. Cet effet de réseau est considérable, et elle est plus importante que certains des déterminants traditionnels des fusions-acquisitions. Les chances d’un investissement sont 4,2 fois plus élevées dans l’industrie légère, 4,5 fois plus élevée dans l’industrie primaire et 6,2 fois plus élevée dans l’industrie lourde, lorsqu’un pays partenaire a déjà investi dans le nouveau pays. Ces probabilités sont plus grandes que certains des déterminants traditionnels des fusions- acquisitions, tels que l’ouverture commerciale.
Chapitre 4 : Évaluation de la fragilité du commerce mondial : l’impact des catastrophes naturelles au travers de l’analyse de réseau
Le chapitre 4 prend un angle différent du chapitre précédent. Au lieu de mon-trer le rôle que les réseaux jouent dans le développement, l’adoption de la technolo-gie ou de nouvelles décisions d’investissements, il évalue les risques qui émergent de la connectivité des pays. Ce chapitre fait valoir que les conséquences d’un choc d’approvisionnement situé dans un pays d’origine des imports dépendent de la struc-ture du réseau du bien importé.
La première contribution du chapitre 4 est de construire une mesure de la fragilité des importations. La mesure est basée sur l’évaluation du risque des produits échangés en analysant le réseau de biens exportés et en basant le choix des composants de l’indice sur la littérature. En particulier, le chapitre souligne le risque lié à la présence d’acteurs centraux dans le réseau d’un produit, à l’existence de communautés et à la faible substituabilité internationale des partenaires commerciaux. La méthodolo-gie développée permet d’identifier les produits les plus vulnérables dans le commerce mondial et détecte les principaux exportateurs et importateurs de ces produits. La méthodologie permet de comparer les vulnérabilités potentielles des différents pays importateurs et fournit un nouvel ensemble de données utilisé pour l’analyse transna-tionale.
La deuxième contribution du chapitre est l’estimation du pouvoir prédictif de l’indicateur. La méthodologie est testée pour deux cas particuliers de catastrophe na-turelle : le tremblement de terre au Japon en 2011 et les inondations en Thaïlande en 2011. Sur la base des données de 2010, l’indicateur permet de détecter 5 des 6 produits qui ont perturbé les chaînes de valeur mondiales après les catastrophes naturelles. Le test est généralisé à une régression entre pays. Une augmentation de 1% de la part des importations de produits fragiles d’une économie touchée par une catastrophe est associée à une réduction de 0,7% des exportations du pays importateur.
Bibliography
R. Albert and A.-L. Barabási. Statistical mechanics of complex networks. Reviews of modern physics, 74(1):47, 2002.
F. E. Alvarez, F. J. Buera, and R. E. Lucas. Idea flows, economic growth, and trade. Technical report, National Bureau of Economic Research, 2017.
J. E. Anderson and E. Van Wincoop. Gravity with gravitas: a solution to the border puzzle. American economic review, 93(1):170–192, 2003.
R. Baldwin and D. Taglioni. Gravity for dummies and dummies for gravity equations. Technical report, National Bureau of Economic Research, 2006.
J. H. Bergstrand and P. Egger. A knowledge-and-physical-capital model of interna-tional trade flows, foreign direct investment, and multinainterna-tional enterprises. Journal of International Economics, 73(2):278–308, 2007.
F. J. Buera and E. Oberfield. The global diffusion of ideas. NBER Working Paper, 2017.
T. Chaney. The network structure of international trade. American Economic Review, 104(11):3600–3634, 2014.
D. T. Coe, E. Helpman, and A. W. Hoffmaister. North-south r & d spillovers. The Economic Journal, 107(440):134–149, 1997.
L. De Benedictis, S. Nenci, G. Santoni, L. Tajoli, and C. Vicarelli. Network analysis of world trade using the baci-cepii dataset. Global Economy Journal, 14(3-4):287–343, 2014.
A. De la Torre, T. Didier, and M. Pinat. Can latin america tap the globalization upside? World Bank Policy Research Working Paper, (6837), 2014.
J. De Martí and Y. Zenou. Social networks. 2009.
K. Ekholm, R. Forslid, and J. R. Markusen. Export-platform foreign direct invest-ment. Journal of the European Economic Association, 5(4):776–795, 2007.
R. C. Feenstra. Advanced international trade: theory and evidence. Princeton uni-versity press, 2005.
E. Fisher and F. Vega-Redondo. The linchpins of a modern economy. AEA Annual Meeting, Chicago, IL, 2006.
A. Galeotti, S. Goyal, M. O. Jackson, F. Vega-Redondo, and L. Yariv. Network games. The review of economic studies, 77(1):218–244, 2010.
R. Hernández, J. M. Martínez Piva, N. Mulder, et al. Global value chains and world trade: Prospects and challenges for Latin America. ECLAC, 2014.
M. O. Jackson. Social and economic networks. Princeton university press, 2010. R. Kali and J. Reyes. The architecture of globalization: a network approach to
international economic integration. Journal of International Business Studies, 38 (4):595–620, 2007.
M. Morris, C. Staritz, and J. Barnes. Value chain dynamics, local embeddedness, and upgrading in the clothing sectors of lesotho and swaziland. International Journal of Technological Learning, Innovation and Development, 4(1-3):96–119, 2011.
M. Newman. Networks: an introduction. Oxford University Press, 2010.
M. E. Newman. A measure of betweenness centrality based on random walks. Social networks, 27(1):39–54, 2005.
A. K. Rose and E. Van Wincoop. National money as a barrier to international trade: The real case for currency union. American Economic Review, 91(2):386–390, 2001. M. Rosvall and C. T. Bergstrom. Maps of random walks on complex networks reveal community structure. Proceedings of the National Academy of Sciences, 105(4): 1118–1123, 2008.
S. R. Yeaple. The complex integration strategies of multinationals and cross country dependencies in the structure of foreign direct investment. Journal of International Economics, 60(2):293–314, 2003.
Introduction
The world economic system is not what it used to be in the 20th century, when ad-vanced economies (AEs) were acting as “center” for a “periphery” of emerging market and developing economies (EMDEs). The rise of EMDEs advocates for the need to go beyond this dichotomy. The previous AE–EMDE dynamics are diversifying and changing, suggesting the emergence of a much more multipolar world economy. In particular, the traditional overlap between “center” and “AEs” versus “periphery” and “EMDEs” is eroding, as some emerging countries are becoming major players on the global economic landscape.
A few statistics shed light on the magnitude and speed of these changes (Figure 5). Back in 1980, the gross domestic product (GDP) in current dollars of the EMDEs (defined as all the countries outside of OECD in 19809) was around 20 percent of the
global GDP. By 2016, EMDEs captured more than 40 percent of the global GDP. The EMDEs’ expansion is similarly striking in terms of trade and financial flows. EMDEs accounted for about 30 percent of global trade flows in 1980, whereas in 2016 they represented around 47 percent. Similarly, EMDEs captured around 13 percent of global capital inflows in 1980; by 2016, they received more than 40 percent of the total. They also became more representative as source countries, sending 30 percent of global capital outflows in 2016, up from 6 percent in 1980. Although China
9
OECD countries in 1980 include Australia, Austria, Belgium, Canada, Denmark, Finland, France, Germany, Greece, Iceland, Ireland, Italy, Japan, Luxemburg, Netherlands, New Zealand, Norway, Portugal, Spain, Sweden, Switzerland, Turkey, United Kingdom, and the United States.
Figure 5: World share of GDP and exports of goods and services
(a) World share of GDP (b) World share of exports
Source: WDI.
Note: The left-hand panel presents the evolution of the world share of current GDP; the right-hand panel shows the world share of exports of goods and services.
is not the only EMDE behind these trends, it has played an important role in their development since its accession to the World Trade Organization in 2001. In the most recent years, the process of catch-up held back in major emerging economies —Brazil, Russia and South Africa slowed down or fell into recession while the Chinese economy was rebalancing toward more domestic consumption with a lower growth rate.
This tectonic reconfiguration of the global economic landscape—particularly the move away from the traditional pattern of high-income countries at the center and developing countries at the periphery—has also brought significant changes to the traditional analysis of trade and finance. The present dissertation contributes to the understanding of the impact of recent developments in trade and finance network structures on the international diffusion of technology (chapter 1), the timing of technology adoption (chapter 2), the likeliness to invest in a new country (chapter 3), and the risk of production disruption (chapter 4). Before turning to the content of the dissertation, this introductory chapter exposes the recent changes in the structure of the trade and finance networks that will be analyzed in the forthcoming chapters.
As a starting point for this analysis, this introductory chapter outlines four sets of facts10 related to the rise of the EMDEs:
1. Several emerging countries are now at the center of the global trade network. 2. Trade clusters have changed over time.
3. The global finance network has not been fundamentally restructured but EMDEs are now more integrated than in the past.
4. Large disruptions in trade production are occurring more frequently after a disaster in a source country.
Fact 1: Several EMDEs have joined the AEs at the center of the global trade network.
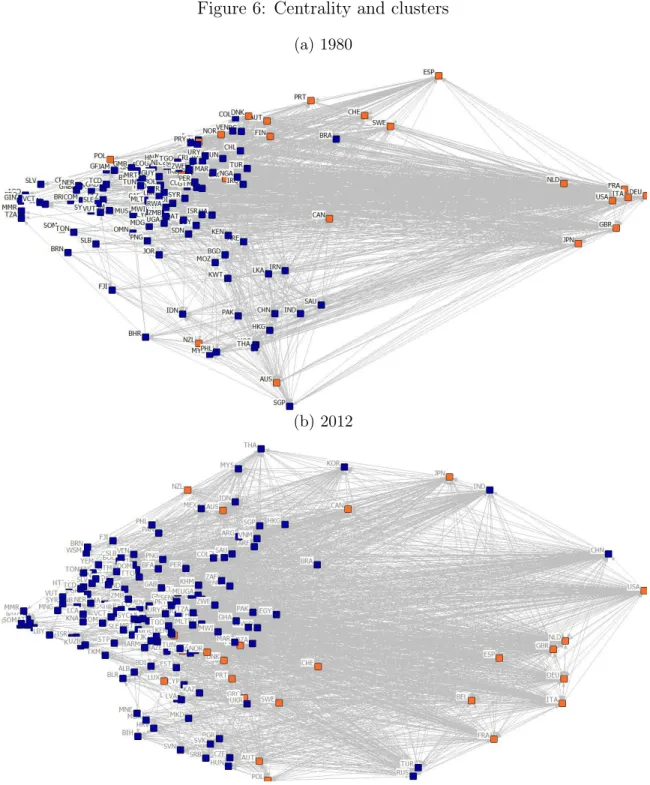
This momentous change stands out clearly in Figure 6, which shows the global trade networks in 1980 and in 2012. Each node represents a country, while colors differentiate between AEs (in orange) and EMDEs (in blue). Each link corresponds to the existence of an active bilateral connection, corresponding to exports from one country to another, as indicated by the arrows. Countries that capture a larger share of other countries’ exports and that are connected with a larger number of trading partners (that is, countries that are more important in the global network) appear to the right in Figure 6.
In 1980, a set of AEs stood at what can be empirically characterized as the center of the global trade network: the United States, Germany (and a few other Western European countries), and Japan were at the core of the network. By 2012, several emerging countries, including not only China, but also Brazil, India, the Russian Federation, South Africa, Turkey, and others, had moved to the center. As a result of
these changes, EMDE is no longer a synonym for the periphery, and AE is no longer a synonym for the center of global trade.
Fact 2: Trade clusters have changed over time.
Figure 6 also illustrates the similarity in the structure of trade connections among countries: the closer countries are to one another, , the more alike they are in terms of export shares with the rest of the world. During the 1980s and 1990s, countries central to the network (situated on the right) are very close to one another, reflecting a high degree of similarity in the structure of their trade connections with other countries in the network. The global trade network in 1980 thus tended to display a sort of “single polarity,” with some North countries acting as a single pole (that is, playing the same role) within world trade.
The global trade network in 2012 reveals a tectonic shift: several countries among the EMDEs appear on the right-hand side of panel b of Figure 6, indicating their increased relevance to world trade. However, they remain somewhat distant (along the vertical dimension) from the other AEs on the right-hand side of the figure. This side of the figure resembles a star, with small groups of central countries placed at a certain distance from one another. Russia and Turkey, for example, are not located near any core AEs countries from Europe, and Japan is not close to either China or Korea. The global trading landscape has become more heterogeneous and “multipolar.”
The dispersion of production stages and processes across countries supports these clustering patterns to some degree. So-called global value chains (GVCs) are indeed arising among a limited set of countries, rather more regionally than truly worldwide. Hernández et al. (2014) highlight the case of the dairy sector in Central America. Companies in El Salvador have developed partnerships in Nicaragua to produce cheese that is then sold in the United States; Morris et al. (2011) highlight the development
Figure 6: Centrality and clusters
(a) 1980
(b) 2012
Source: IMF’s DOTs.
Note: The figure estimates the magnitude and the direction of the exports. A principal component algorithm is then applied to the matrix of share of exports in order to determine the position of each country in the trade network. Along the horizontal axis, countries are distributed according to their centrality to the trade network. More relevant countries to the network are situated to the right of the plot. The vertical axis indicates the similarity of trade structure between countries, with a smaller distance between two countries indicating a more similar structure of trade connections, in terms of exports to the rest of the world and relative importance to other trade partners.
of regional value chains among clothing manufacturers, led by South Africa in Lesotho and the Kingdom of Swaziland.
Fact 3: Unlike the global trade network, the global finance network has not been fundamentally restructured; but EMDEs are now more inte-grated than in the past.
A key feature of the new dynamics of the global economy has been the asymmetry in the pattern of changes between the global trade and financial networks. In the sphere of trade, the traditional correspondence between the AEs and the center, and the EMDEs and the periphery, has been reconfigured. In contrast, in the sphere of finance, AEs still stand alone at the center of the global financial networks, though the EMDEs have increased their connectivity within these networks.
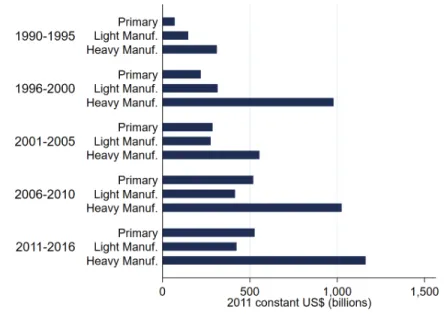
The growth of the EMDEs has been widespread. As the EMDEs gained promi-nence in the global economy, the number of their bilateral international connections proliferated. M&A flows are particularly large in the heavy manufacturing sector (55 percent since 2011, Figure 7). Investment in the primary sector has been growing and is now larger than investments in light manufacturing (25 percent versus 20 percent since 2011).
Fact 4: The internationalization of production processes has increased countries’ interconnectedness.
The dispersion of production stages and processes across countries, evoked in Fact 2, has increased the interdependence across countries. Anecdotal evidence suggests the existence of specific choke points in the global trade network that become espe-cially salient after natural disasters occur. The 2011 Japanese earthquake is now a well-studied event that shed light on how a localized disaster can have a significant contagion effect on many countries around the world. Countries importing inputs
Figure 7: Sectoral composition of cross-border mergers and acquisitions (M&A) flows
Source: Calculations based on SDC platinium database.
Note: The primary sector includes agriculture, hunting, forestry, and fishing; mining; and crude petroleum and natural gas. The light manufacturing sector includes food, beverages, and tobacco; textiles and apparel (including leather); and wood and paper-related products. The heavy manufac-turing sector includes refined petroleum and related products, chemicals and plastics, nonmetallic minerals, metals, machinery and equipment, and transport equipment.
for their production from the impacted area of Fukushima had to interrupt their production for days or even months, because the lack of key inputs for their produc-tion. This occurred in the case of Apple, which was importing overlay glass for its iPad 2 touchscreen exclusively from Asahi Glass, a firm located in the province of Fukushima. After the earthquake, the firm delayed its delivery of overlay glass for five weeks, generating a two-month delay in launching the iPad 2.
With trade becoming more integrated into international value chains, any disaster located within providers of key intermediary goods now has a large probability to disrupt production in other countries.
Statement of the research question
International relationships are traditionally studied through the analysis of bilateral ties. However, the intensification and complexification of international links call for a more global analysis, in which not only the characteristics at the country level and between two countries are taken into account, but the situation is also considered from a network perspective. This dissertation deals with how the networks affect international economics relationships, in particular trade and finance, and assesses their impact on countries’ development paths.
How does the network structure impact on international relationships?
• What are the consequences of network dynamics for economic growth, diffusion of technology, production processes, and development?
• How do network characteristics such as centrality, clusters, and transitivity matter?
• How fragile is the production process in light of network characteristics?
Why analyze international relationships using
net-work analysis?
The focus of this dissertation is to revisit some questions researchers have been work-ing on, uswork-ing network analysis tools. The use of network analysis tools for the analysis of international trade and finance is increasing for multiple reasons. Referring to the use of network analysis tools to analyze international trade data, De Benedictis et al. (2014) stated: “Networks are about relations.” Many aspects of international rela-tionships are studied based on individual characteristics —i.e., country-level
charac-teristics —or the nature of their connections —i.e., observables ties, such as common language or geographical distance. However, a third component to these relation-ships has received less attention, and is described by De Benedictis et al. (2014) as the “structural dimension.” Relations between two countries cannot be analyzed in isolation of third-country effects. The notion of interdependence is key in network analysis.
The trade and finance literature has attempted to proxy countries’ interdepen-dence and third-country effects. In their American Economic Review paper, An-derson and Van Wincoop (2003) attempt to identify unobserved barriers to trade by estimating a multilateral trade resistance (MRT) between two trading partners. Their theoretical results show how the exports of country i to countryj are deter-mined by country j’s trade cost toward i relative to its overall “resistance” to imports (everything else equal, the higher the general trade cost and the average “resistance” exporters face in country i, the more they are pushed to trade with country j).
Estimation of MRT is challenging. Anderson and Van Wincoop (2003) use itera-tive methods to construct estimates of the price-raising effects of MRT barriers, but this procedure is not often used, as it requires a non-linear least squares approach. Simpler alternatives include the use of a remoteness variable or fixed effects (Rose and Van Wincoop (2001); Feenstra (2005); Baldwin and Taglioni (2006))11.
Another important theoretical and empirical attempt has been made by Chaney (2014)’s studies on informational friction in trade. In his paper, a firm exporting to country i in year t is more likely to enter in year t ` 1 in country j , a country
11
Other attempts include the gravity literature, which assesses the impact of cultural ties on trade. Rauch and Trindade (2002) shows first that proximity and a common language or colonial ties are more important for differentiated products than for homogenous ones, and that search barriers to trade are higher for differentiated than for homogeneous products. Rauch and Trindade (2002) show that Chinese ethnic networks represent an influential facilitator of trade. Felbermayr and Toubal (2010) find a positive correlation between trade and a measure of cultural similarity based on a European singing competition.
geographically close to i, even if j is not close to the origin country of the firm. The reason behind this is an informational dynamic. Chaney (2014) finds empirical evidence for this prediction using French firm data. The “export platform” literature (Ekholm et al. (2007), Yeaple (2003), Bergstrand and Egger (2007)) also emphasizes the importance of partners in choosing new export destinations. Export platform refers to situations where a parent country invests in a particular host country with the intention of serving “third” markets with exports of final goods from the affiliate companies in the host country.
Network analysis allows to approach more systematically particular impacts that the existing literature does not capture, such as the impact of the structure on the network, or the role of individual countries or groups of countries within it. In this approach, third-country effects are not reduced to an average effect, thus masking heterogeneity across third countries. As economies become more globalized, analyses of international relationships though network lenses become more necessary.
For a long time, authors lacked the tools to measure international economic inte-gration correctly (Kali and Reyes (2007)). Progress in network theory and economet-rics, the availability of newer bilateral databases, and increases in computer capacity opened new areas of research and gave new tools to international economists to study the patterns of linkages that connect countries together (Albert and Barabási (2002); Newman (2005); Galeotti et al. (2010); De Martí and Zenou (2009); Jackson (2010); Newman (2010)).
This dissertation takes a step toward including the heterogeneity of third-country effects in trade and finance relationships. Network analysis is applied to different bi-lateral trade and finance databases in order to study the system as an interconnected network. The network approach allows to study the relevance of certain
character-istics of the network, such as the centrality of trade partners, the impact of cluster-ization, and the importance of triangular relationships on the likeliness of diffusing new technologies, increasing productivity, and developing investment, as well as on the development of risks emerging from the structure.
Outline of the dissertation
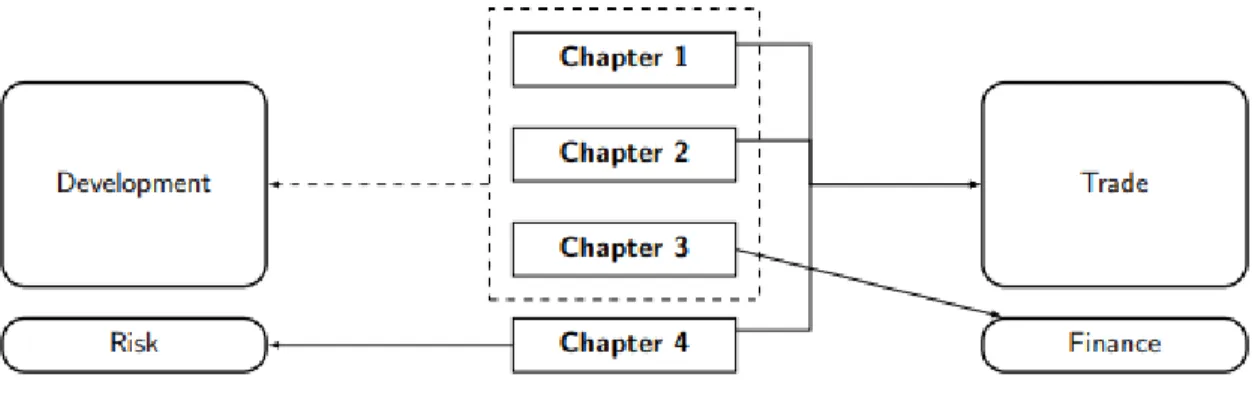
This dissertation is composed by four chapters. As depicted in Figure 8, Chapter 1, 2, and 3 study the impact of trade and finance networks on countries’ development, while 4 highlights the risks emerging from the structure of the network. Chapter 1, 2, and 4 investigate trade while 3 looks into finance.
Figure 8: Sectoral composition of cross-border mergers and acquisitions (M&A) flows
Chapter 1: Diffusion of ideas and centrality in the trade network Chapter 1 explores the diffusion of ideas through international trade. In this chapter, the notion of the impact of trade partners is key: if the diffusion of knowledge through trade is bilateral (a country learns from its trade partner), the economic impact of this diffusion depends on the relevance of the partner in the trade network. In Coe et al. (1997), the authors state that “by trading with an industrial country that has a larger ‘stock of knowledge,’ a developing country stands to gain more in
terms of both the products it can import and the direct knowledge it can acquire than it would by trading with another developing country.” This chapter argues that the association between industrial countries and larger stocks of knowledge is no longer relevant, as the line between level of development and position in the trade network is more blurred than in the past (Figure 6). In lieu of industrial countries, the chapter argues that the most central countries are those that have the largest stocks of knowledge. The more important (central) a partner is in the trade network, the more the knowledge gained from trade with this partner will affect a country’s growth.
The first contribution of chapter 1 is theoretical. The multi-country Ricardian model of international trade of Alvarez et al. (2017) and Buera and Oberfield (2017) is reinterpreted using network analysis. Countries central to a trade network tend to be at the frontier of ideas. These countries are the main drivers of knowledge diffusion. Countries that develop strong ties with central countries that are innovators are more likely to acquire recent technologies, improve their productivity, and boost their income.
The chapter then turns to the empirical assessment of the theory. For the first time in the trade literature, the chapter uses the random walk betweenness centrality (RWBC) measure developed by Newman (2005) and Fisher and Vega-Redondo (2006). The measure of betweenness centrality is better suited to fit the notion of idea flows in the network. In turn, the concept of a random walk is more relevant for networks where the concept of shortest path is not meaningful, as it is the case of densely connected network such as the trade network. This measure emphasizes the role of a country in its relations in acting between other countries. A country with high betweenness centrality has a key influence in the transmission of ideas and technologies through the network.