HAL Id: tel-01142164
https://tel.archives-ouvertes.fr/tel-01142164
Submitted on 14 Apr 2015HAL is a multi-disciplinary open access
archive for the deposit and dissemination of sci-entific research documents, whether they are pub-lished or not. The documents may come from teaching and research institutions in France or abroad, or from public or private research centers.
L’archive ouverte pluridisciplinaire HAL, est destinée au dépôt et à la diffusion de documents scientifiques de niveau recherche, publiés ou non, émanant des établissements d’enseignement et de recherche français ou étrangers, des laboratoires publics ou privés.
Joint network and system performance for cloud
computing
Sonia Belhareth
To cite this version:
Sonia Belhareth. Joint network and system performance for cloud computing. Other [cs.OH]. Univer-sité Nice Sophia Antipolis, 2014. English. �NNT : 2014NICE4146�. �tel-01142164�
´
ECOLE DOCTORALE STIC
SCIENCES ET TECHNOLOGIES DE L’INFORMATION ET DE LA COMMUNICATION
TH`ESE
Pour obtenir le titre de Docteur en Sciences
de l’Universit´e de Nice-Sophia Antipolis Mention : Informatique
Pr´esent´ee et soutenue par
Sonia BELHARETH
Performances R´
eseaux et Syst`
eme
pour le Cloud Computing
Directeur de th`ese : Guillaume URVOY-KELLER
soutenue le 18 D´ecembre 2014 Jury :
Directeur de th`ese M. Guillaume URVOY-KELLER Professeur, UNS, France
Co-directeur M. Denis COLLANGE Orange Labs, France
M. Dino LOPEZ-PACHECO UNS,France
Rapporteur et Pr´esident M. Andr´e-Luc BEYLOT ENSEEIHT, France
Rapporteur M. Martin HEUSSE ENSIMAG, France
Cloud computing enables a flexible access to computation and storage services. This requires, for the cloud service provider, mastering network and system issues. During this PhD thesis, we focused on the performance of TCP Cubic, which is the default version of TCP in Linux and thus widely used in today’s data centers.
Cloud environments feature low bandwidth-delay products (BPD) in the case of intra data center communications and high BDP in the case of inter data center communica-tions. We have developed analytical models to study the performance of a TCP Cubic connection in isolation or a set of competing TCP Cubic connections. Our models turn out to be precise in the low BDP case but fail at capturing the synchronization of losses that NS-2 simulations reveal in the high BDP case.
We have complemented our simulations studies with tests in real environments: (i) an experimental network at I3S and (ii) a cloud solution available internally at Orange: Cube.
Studies performed in Cube have highlighted the high correlation that might exist between network and system performance and the complexity to analyze the performance of applications in a cloud context.
Studies in the controlled environment of I3S have confirmed the existence of synchro-nization and enabled us to identify its condition of appearance. We further investigated two types of solution to combat synchronization: client level solutions that entail mod-ifications of TCP and network level solutions based on queue management solutions, in particular PIE and Codel.
R´esum´e
Le cloud computing permet d’offrir un acc`es `a la demande `a des ressources de calcul et de stockage. Le succ`es du cloud computing n´ecessite la matrise d’aspects syst`eme et r´eseau. Dans cette th`ese, nous nous sommes int´eress´es aux performances du protocole TCP Cubic, qui est la version par d´efaut de TCP sous Linux et donc pr´esent dans de nombreux serveurs op´erationnels dans les data centers actuels.
Afin de comprendre les performances d’un environnement cloud, qui offre un faible produit bande passante-d´elai pour le cas intra-data center, et un fort produit dans le cas inter-data center, nous avons d´evelopp´e des mod`eles analytiques pour les cas d’une ou plusieurs connexions TCP Cubic. Nos mod`eles se sont r´ev´el´es pr´ecis dans le cas intra-datacenter, mais ne capturaient pas la synchronisation des pertes indiqu´ee par les simulations NS-2 dans le cas inter-datacenter.
Nous avons compl´et´e les simulations par des tests en environnements r´eels avec (i) un r´eseau exp´erimental `a l’I3S ; et (ii) une solution cloud interne `a Orange : Cube.
Les ´etudes dans Cube nous ont d´emontr´e la forte corr´elation qui pouvait exister entre performances r´eseau et syst`eme, et la complexit´e d’analyser les performances des applications dans des contextes cloud.
Les ´etudes dans l’environnement I3S ont confirm´e la forte synchronisation qui peut ex-ister entre connexions TCP Cubic et nous ont permis de d´efinir les conditions d’apparition de cette synchronisation. Nous avons ´etudi´e deux types de solution pour lutter contre la synchronisation: des solutions niveau client, avec des modifications de TCP Cubic, et des solutions r´eseau avec l’utilisation de politiques de gestion de tampon, notamment PIE et Codel.
Acknowledgments
I express my gratitude to Prof. Guillaume Urvoy-Keller, for the time he spent with me, for particularly enriching scientific exchanges, to the great cultural discussions, for his support and sympathy. I also thank Dr. Dino Lopez-Pacheco with whom I took a real pleasure to work with.
My thanks to Dr. Denis Collange for our daily trading during these three years, his involvement, his wise and decisive in times of doubt advices.
A special thank to Dr. Lucile Sassatelli for her advices, help and excellent knowledge on Mean-field theory.
I want to thank the members of my jury for agreeing to evaluate this thesis, including M. Andr´e-Luc Beylot, M. Martin Heusse, and M. Matti Siekkinen. Their skills and generosity have contributed to improving the manuscript.
I do not forget to thank my friends: Mariem, Hajer, Ameni, Olfa, Youssef, Neetya, Imen, Wafa, Bryan, with whom I spent unforgettable moments.
A big thanks, I address to my dear family who trusted me, and always encouraged me, and this has been my unwavering support during these three years.
Finally, I extend heartfelt thanks to my Love Zouhir, for his continued and unfailing love, support and understanding that makes the completion of this thesis possible.
Contents
Abstract iii R´esum´e iv Acknowledgments v List of Figures xi List of Tables xv Acronyms xvii Introduction 21 State of the art 7
1.1 Introduction . . . 7
1.2 Performance of data centers . . . 7
1.2.1 Data Analysis . . . 7
1.2.2 Scalable Network-Application Profiler (SNAP) . . . 8
1.2.3 Comparing Public Cloud Providers (CloudCmp) . . . 9
1.2.4 The Incast Collapse problem . . . 9
1.2.5 Virtualization in cloud environments . . . 10
1.3 TCP and congestion control . . . 11
1.3.1 A Protocol for Packet Network Intercommunication . . . 11
1.3.2 Congestion problem . . . 12
1.3.3 Congestion control for TCP . . . 13
1.4 Other congestion control strategies . . . 14
1.4.1 Buffer sizing . . . 14
1.4.2 Active Queue Management mechanisms . . . 15
1.4.3 Multipath TCP . . . 16
1.4.4 Transport protocol at the application layer . . . 16
1.4.4.1 SPDY . . . 16
1.4.4.2 QUIC . . . 17
1.4.4.3 HTTP2.0 . . . 17
1.4.4.4 Aspera FASP . . . 17
Contents viii
1.5 TCP Cubic evaluation : models, simulations and experiments . . . 18
1.5.1 Evaluation through analytical models and simulations . . . 18
1.5.2 Evaluation through experiments . . . 20
1.6 Analytical models: Mean-field approach . . . 21
1.7 Conclusion . . . 21
2 Analyzing a Single TCP Cubic flow 23 2.1 Introduction . . . 23
2.2 Background on TCP Cubic . . . 23
2.2.1 Window variation in TCP Cubic . . . 23
2.2.2 TCP Cubic mode of operation . . . 25
2.3 TCP Cubic model . . . 26
2.3.1 Dynamical Analysis . . . 28
2.3.1.1 Different Phases of TCP Cubic . . . 28
2.3.1.2 Combining Multiple Phases . . . 31
2.3.2 RTT Analysis . . . 32
2.3.2.1 The upper bound for R(t) . . . 32
2.3.2.2 The lower bound for R(t) . . . 33
2.4 Numerical results . . . 34
2.4.1 Algorithm versus simulation . . . 34
2.4.1.1 Fast Convergence . . . 34 2.4.1.2 Delayed Acknowledgments . . . 35 2.4.1.3 Entire packet . . . 36 2.4.2 Validation . . . 37 2.4.2.1 ADSL scenario . . . 37 2.4.2.2 FTTH scenarios . . . 38 2.5 Conclusion . . . 39
3 Understanding TCP Cubic Performance in the Cloud: a Mean-field Approach 40 3.1 Introduction . . . 40
3.2 Background . . . 40
3.2.1 TCP Cubic . . . 40
3.2.2 Mean-field models . . . 41
3.3 Performance analysis of TCP Cubic . . . 42
3.3.1 A fluid model for TCP Cubic . . . 42
3.3.2 Decreasing the computational intensity of the model . . . 44
3.4 Numerical validation . . . 46
3.4.1 Network scenarios . . . 47
3.4.2 FTTH and intra-DC scenarios . . . 48
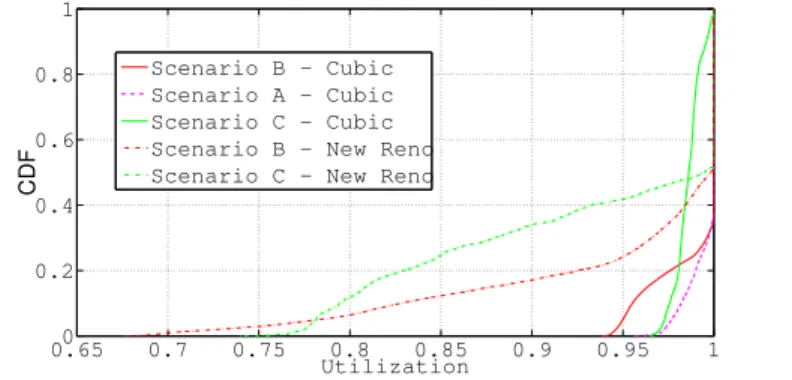
3.4.3 Inter-DC scenario . . . 48
3.4.4 FTTH scenario with New Reno . . . 50
3.5 Study of fairness and the impact of the buffer size . . . 51
3.5.1 Fairness analysis . . . 52
3.5.2 Impact of the buffer size . . . 54
4 Performance Analysis of Orange cloud solution: Cube 56
4.1 Introduction . . . 56
4.2 Cube Beta Infrastructure as a Service (IaaS) . . . 56
4.2.1 Cube environment . . . 57
4.2.1.1 Sandbox Environment . . . 57
4.2.1.2 Service Description . . . 57
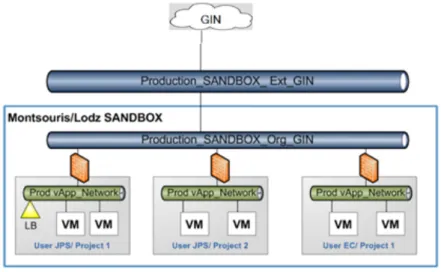
4.2.2 Orange Group Architecture . . . 58
4.3 Disk Benchmarking . . . 60
4.3.1 Motivation . . . 60
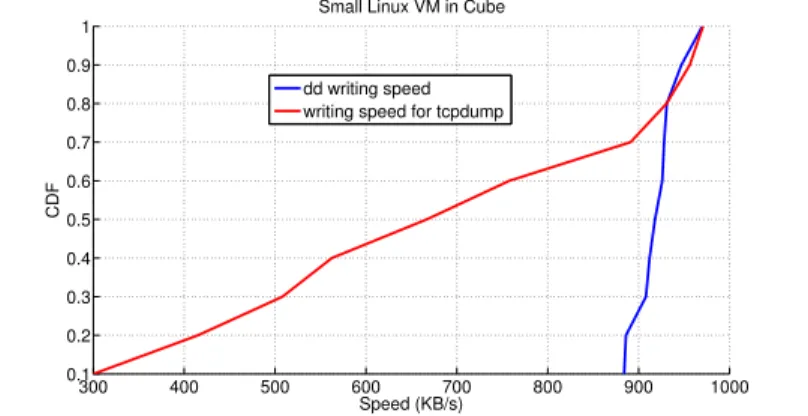
4.3.2 Reading and Writing from disks and through file systems . . . 61
4.3.3 Results on Cube experiments . . . 63
4.3.3.1 I/O requirements: back of the envelope computation . . . 63
4.3.3.2 Cube instances and SND6 performance . . . 64
4.3.4 Results obtained with the I3S testbed . . . 67
4.3.4.1 Native performance . . . 68
4.3.4.2 Performance under Xen and VMware . . . 68
4.3.4.3 Impact of block size . . . 69
4.4 Network Benchmarking . . . 71
4.4.1 Description of the tools: Iperf, Perl-data and Perl-file, and the trace analysis tools . . . 71
4.4.1.1 Iperf . . . 71 4.4.1.2 Perl Socket . . . 72 4.4.1.3 Sniffing/analyzing tools . . . 73 4.4.2 Methodology . . . 74 4.4.3 Sophia to Cube . . . 74 4.4.3.1 Calibration of Iperf . . . 74 4.4.3.2 Measurement results . . . 75 4.4.4 Cube to Sophia . . . 78
4.4.4.1 Silence during transfers . . . 78
4.4.4.2 Measurement results for several transfers in parallel . . . 82
4.4.5 Conclusion . . . 85
5 Synchronization of TCP Cubic connections 86 5.1 Introduction . . . 86
5.2 Motivating examples . . . 86
5.3 Experimental set-up . . . 88
5.3.1 Testbed . . . 88
5.3.2 Scenarios . . . 88
5.4 Experimental results of cloud scenarios . . . 89
5.4.1 Cloud center scenarios . . . 89
5.4.2 Synchronization vs. background traffic . . . 92
5.4.3 The impact of Fast Convergence . . . 93
5.5 Root cause of synchronization . . . 94
5.5.1 Behavior of TCP Cubic around the equilibrium point . . . 95
5.5.2 Tracking of cubic function in the actual implementation of TCP Cubic . . . 97
Contents x
5.5.4 Discussion . . . 98
5.6 Alleviating Synchronization . . . 100
5.7 Conclusion . . . 103
6 Impact of queue management mechanisms on synchronization 104 6.1 Introduction . . . 104
6.2 Active Queue Management Mechanisms . . . 104
6.2.1 RED . . . 105
6.2.2 ARED . . . 106
6.2.3 CoDel . . . 107
6.2.4 PIE . . . 108
6.3 Bibliographical comparison of AQMs . . . 109
6.4 Simulation results . . . 111 6.4.1 Target Delay . . . 112 6.4.2 Interval Time . . . 113 6.4.3 Base RTT . . . 114 6.5 Experimental results . . . 115 6.5.1 Experimental setup . . . 115 6.5.2 Ros comparison . . . 116
6.5.3 Experiments: Synchronization vs. AQMs . . . 118
6.5.4 Combining LinCubic and AccuCubic with AQMs . . . 120
6.5.5 Parameter Sensitivity . . . 122
6.6 Conclusion . . . 123
Conclusions and perspectives 124 A Computing parameters for a single TCP Cubic flow model 127 A.1 Transitions between states . . . 127
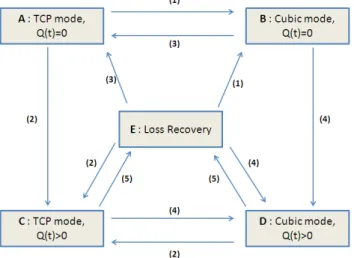
A.1.1 State (A), TCP mode, Q(t)=0 . . . 127
A.1.2 State (B), Cubic mode, Q(t)=0 . . . 128
A.1.3 State (C),TCP mode, Q(t)>0 . . . 129
A.1.4 State (D), Cubic mode, Q(t)>0 . . . 129
A.2 Sequence number . . . 130
A.3 Quality of Service metrics . . . 131
B R´esum´e de la th`ese 133 B.1 Introduction . . . 133
B.1.1 R´esum´e par chapitre . . . 138
B.1.2 Chapitre 1 : ´Etat de l’art . . . 138
List of Figures
1.1 Congestion avoidance (AIMD) [ATRK10] . . . 13
1.2 Effective TCP load versus offered load from TCP senders [ATRK10] . . . 13
2.1 TCP Cubic window growth function [HRX08] . . . 23
2.2 Congestion window growth of TCP Cubic in Cubic and TCP modes. . . . 26
2.3 Model for a single TCP connection . . . 27
2.4 Transition diagram . . . 29
2.5 Trace of the sequence and acknowledgment numbers when there is no loss [Col98] . . . 32
2.6 Fast Convergence phenomenon, C = 100M bps, τ = 50ms, B=50 packets . 35 2.7 Delayed Acknowledgments phenomenon, C = 200M bps, τ = 10ms, B=50 packets . . . 36
2.8 Entire packet phenomenon, C = 200M bps, τ = 10ms, B=50 packets . . . 37
2.9 Time series of the window, ADSL, C = 10M bps . . . 37
2.10 Time series of the window, FTTH, C = 100M bps . . . 38
2.11 Time series of the window, FTTH, C = 200M bps . . . 38
2.12 Time series of the window, FTTH, C = 300M bps . . . 38
2.13 Time series of the window, FTTH, C = 400M bps . . . 38
3.1 The elapsed time until the last loss sloss(t) . . . 44
3.2 Connections arriving in and leaving state < w, wmax> in the time interval [t, t + dt[ . . . 44
3.3 Scaling factor α for New Reno . . . 46
3.4 Network scenario indicating the N flows, buffer and servicing link . . . 47
3.5 Time series of queue size and average window size - FTTH scenario - TCP Cubic . . . 48
3.6 Time series of queue size and average window size IntraDC scenario -TCP Cubic . . . 49
3.7 Congestion window - FTTH scenario - TCP Cubic . . . 49
3.8 Congestion window - Intra-DC scenario - TCP Cubic . . . 49
3.9 Time series of queue size and average window size InterDC scenario -TCP Cubic . . . 50
3.10 Congestion window - Inter-DC scenario - TCP Cubic . . . 51
3.11 Time series of utilization - FTTH scenario - New Reno . . . 51
3.12 Congestion window - Intra-DC and FTTH - TCP Cubic and New Reno . 53 3.13 CoV of congestion window - Intra-DC and FTTH - TCP Cubic and New Reno . . . 53
3.14 Utilization - Intra-DC and FTTH - TCP Cubic and New Reno . . . 53
List of Figures xii
3.15 Impact of buffer size - Intra-DC - TCP Cubic . . . 54
3.16 Impact of buffer size - Intra-DC - New Reno . . . 55
4.1 GIN Network and Platforms Relationships . . . 58
4.2 Cube Platforms, GIN & Countries Connections . . . 59
4.3 Sophia/Cube machines . . . 59
4.4 Writing speed, dd-tcpdump, small Linux VM in Cube . . . 63
4.5 Reading speed without disk access (MB/s), Linux VMs in Cube . . . 64
4.6 Reading speed with disk access(KB/s), Linux VMs in Cube . . . 64
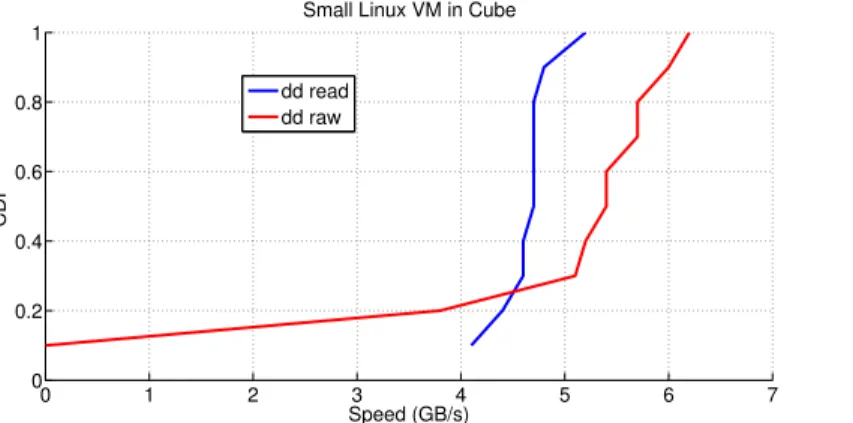
4.7 Disk performance using dd without conv option, small Linux VM in Cube, Reading speed (GB/s) . . . 65
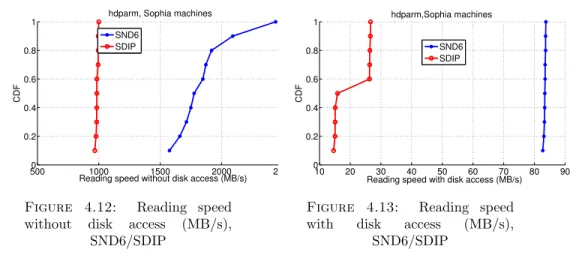
4.8 Disk performance using dd with conv option, small Linux VMs in Cube . 65 4.9 Disk performance using dd with conv option, medium Linux VMs in Cube 65 4.10 hdparm, Reading speed without disk access (KB/s), Windows VM in Cube 66 4.11 hdparm, Reading speed with disk access (KB/s), Windows VM in Cube . 66 4.12 Reading speed without disk access (MB/s), SND6/SDIP . . . 67
4.13 Reading speed with disk access (MB/s), SND6/SDIP . . . 67
4.14 Reading/Writing Speed (MB/s), Vsignet1 machine . . . 68
4.15 Reading/Writing Speed (MB/s), Vsignet2 machine . . . 68
4.16 dd write (MB/s), the three OS . . . 68
4.17 dd read (MB/s), the three OS . . . 68
4.18 dd raw (MB/s), the three OS . . . 69
4.19 hdparm with disk access(MB/s), the three OS . . . 69
4.20 Disk performance using dd, different block sizes, writing speed (MB/s), Vsignet . . . 69
4.21 Disk performance using dd, different block sizes, reading speed (MB/s), Vsignet2 . . . 69
4.22 Disk performance using dd, reading speed from the raw device, Vsignet2 . 70 4.23 Disk performance (MB/s), one VM in Vsignet1, 128 1M blocks . . . 70
4.24 Disk performance (MB/s), one VM in Vsignet1, 2000 64KB blocks . . . . 70
4.25 CDF Throughput(Mbps), Iperf l=8, 16, 32K bytes . . . 75
4.26 Congestion window, Iperf Sophia to Cube, w = 40 k bytes . . . 75
4.27 Congestion window (Kbytes), from Sophia to Cube, Iperf, Perl-File/Data 76 4.28 CDFs of congestion window from Sophia to Cube, Iperf, Perl-File/Data . 76 4.29 Throughput(Mbps), from Sophia to Cube, Iperf, Perl-File/Data . . . 77
4.30 CDFs of throughput, from Sophia to Cube, Iperf, Perl-File/Data . . . 77
4.31 Results from Sophia to Cube, CDFs of RTTs of the 10 tests . . . 77
4.32 Congestion window(Kbytes), from Cube to Sophia, Iperf, Perl-File/Data . 78 4.33 CDFs of congestion window, from Cube to Sophia, Iperf, Perl-File/Data . 78 4.34 Throughput(Mbps), from Cube to Sophia, Iperf, Perl-File and Perl-Data . 79 4.35 CDFs of throughput(Mbps), Perl-Iperf, from Cube to Sophia . . . 79
4.36 CDFs of RTTs (ms), Perl-Iperf, Cube to Sophia . . . 80
4.37 Average throughput per flow (Mbps), Perl-Data, Parallel flows from Cube to Sophia . . . 80
4.38 Average throughput per flow (Mbps), Perl-Data, 1 flow from Cube to Sophia . . . 81
4.39 Average throughput per flow (Mbps), Perl-Data, 1 among 10 flows Cube to Sophia . . . 82 4.40 Time sequence graph, Perl-Data, 1 among 10 flows from Cube to Sophia . 82 4.41 Average throughput per flow (Mbps), Perl-Data, 1 among 17 flows from
Cube to Sophia . . . 83 4.42 Time sequence graph, Perl-Data, 1 among 17 flows from Cube to Sophia . 83 4.43 Average throughput per flow (Mbps), Perl-Data, 1 among 100 flow from
Cube to Sophia . . . 83 4.44 Time sequence graph, Perl-Data, 1 among 100 flow from Cube to Sophia . 83 4.45 CDFs of throughputs (Mbps), 1 flow . . . 84 4.46 CDFs of throughputs (Mbps), 10 flows among 50 . . . 84 4.47 CDFs of throughputs (Mbps), 10 flows among 100 parallel flows . . . 84 4.48 Box plot throughputs (Mbps), {1, 10, 100, 200, 300} parallel flows . . . . 84 4.49 Box plot loss,{1, 10, 100, 200, 300} parallel flows . . . 85 5.1 Total window size (NS-2): 10 TCP Cubic flows,sharing a common bottleneck 87 5.2 10 TCP Cubic transfers between France (I3S lab) and Amazon EC2 data
center of Oregon . . . 87 5.3 Experimental network setup . . . 88 5.4 Total window size (packets) . . . 90 5.5 Number of synchronized flow and lost packets at each congestion epoch,
TCP Cubic . . . 90 5.6 Number of synchronized flow and lost packets at each congestion epoch,
New Reno . . . 90 5.7 Total window size (packets) . . . 91 5.8 Number of synchronized flow and lost packets at each congestion epoch,
TCP Cubic, BS = 1000 packets . . . 91 5.9 Number of synchronized flow and lost packets at each congestion epoch,
New Reno, BS = 1000 packets . . . 91 5.10 Number of synchronized flow and lost packets at each congestion epoch,
Cubic, BS = 0.6 BDP . . . 92 5.11 Number of synchronized flow and lost packets at each congestion epoch,
New Reno, BS = 0.6 BDP . . . 92 5.12 Time series of window size (packets) with and without background traffic,
BS= 1 BDP . . . 93 5.13 Time series of total window size (packets) with and without FC, BS= 1
BDP . . . 94 5.14 Target Evolution . . . 95 5.15 Converge properties of the optimal congestion window (BDP + BS = 80). 96 5.16 More real Cubic congestion window evolution. . . 97 5.17 TCP Cubic leading to high synchronization . . . 98 5.18 Intra data center transfers - 10 flows, individual Congestion Window, 10
flows . . . 99 5.19 Intra data center transfers - 10 flows, aggregate Congestion Window . . . 99 5.20 Individual Congestion Window, Intra data center transfers - 100 flows . . 100 5.21 NS-2 Simulations - A single flow, With FC . . . 101 5.22 NS-2 Simulations - A single flow, Without FC . . . 101 5.23 NS-2 Simulations -100 flows, RTT=500ms, With FC . . . 102
List of Figures xiv
5.24 NS-2 Simulations -100 flows, RTT=500ms, Without FC . . . 102
6.1 RED: drop probability function [HR09] . . . 106
6.2 Simplified RED Algorithm Behavior [ed14] . . . 106
6.3 Simplified CoDel Algorithm Behavior [Whi13] . . . 107
6.4 Structure of the network . . . 111
6.5 RTT, NS-2 simulation results . . . 113
6.6 Goodput(Mbps), testbed experimental results . . . 113
6.7 RTT (ms), Codel NS-2 simulation results . . . 113
6.8 Goodput (Mbps), Codel NS-2 simulation results . . . 113
6.9 RTT (ms), PIE NS-2 simulation results . . . 114
6.10 Goodput (Mbps), PIE NS-2 simulation results . . . 114
6.11 Queuing delay (ms), NS-2 simulation results . . . 115
6.12 Goodput (Mbps), NS-2 simulation results . . . 115
6.13 Experimental network setup . . . 116
6.14 RTT(ms), 10Mbps, RTT=100ms, BS=1000 packets . . . 117
6.15 Goodput(Mbps) , 10Mbps, RTT=100ms, BS=1000 packets . . . 117
6.16 Cwnd(packets), 100Mbps, RTT=350ms, BS=1BDP . . . 118
6.17 CDFs of the congestion window, 100Mbps, RTT=350ms, BS=1BDP . . . 118
6.18 Buffer(packets) , 100Mbps, RTT=350ms, BS=1BDP . . . 119
6.19 Goodput(Mbps), 100Mbps, RTT=350ms, BS=1BDP . . . 119
6.20 Number of synchronized flows, 100Mbps, RTT=350ms, BS=1BDP . . . . 119
6.21 CDFs of the synchronized flows, 100Mbps, RTT=350ms, BS=1BDP . . . 119
6.22 Cwnd (packets), TCP New Reno 100Mbps, RTT=350ms, BS=1BDP . . . 120
6.23 Goodput(Mbps), TCP New Reno 100Mbps, RTT=350ms, BS=1BDP . . 120
6.24 Number of synchronized flows, TCP New Reno 100Mbps, RTT=350ms, BS=1BDP . . . 120 6.25 Cwnd(packets), Codel, 100Mbps, RTT=350ms, BS=1BDP . . . 121 6.26 Cwnd(packets) , PIE, 100Mbps, RTT=350ms, BS=1BDP . . . 121 6.27 Cwnd(packets) , ARED, 100Mbps, RTT=350ms, BS=1BDP . . . 121 6.28 RTT (ms) - 100Mbps, 350ms - Cubic . . . 122 6.29 Goodput (Mbps)- 100Mbps, 350ms - Cubic . . . 122 6.30 RTT (ms) - 100Mbps, 350ms - Codel . . . 122 6.31 Goodput (Mbps)- 100Mbps, 350ms - Codel . . . 122 6.32 RTT (ms) - 100Mbps, 350ms - PIE . . . 123 6.33 Goodput (Mbps)- 100Mbps, 350ms - PIE . . . 123
B.1 Time series of the window, FTTH, C = 100M bps . . . 140
B.2 Time series of queue size and average window size - FTTH scenario - Cubic141 B.3 Ns2 Simulations -100 flows, RTT=500ms, With FC . . . 143
List of Tables
2.1 Notations for the system model . . . 27
2.2 State transitions and corresponding events . . . 29
2.3 Window size at time t W(t) . . . 30
2.4 Window size when moving between states . . . 30
2.5 The sojourn time since the beginning of the cycle until completion of the state . . . 30
2.6 The number of packet sent during a transition . . . 31
4.1 Characteristics of the Cube machines . . . 59
5.1 Cloud clients scenario . . . 89
5.2 Intra-DC scenario . . . 90
5.3 Inter-DC scenario . . . 92
6.1 Default parameter values . . . 112
Acronyms
ACK Acknowledgment
ADSL Asymmetric Digital Subscriber Line AIMD Additive Increase Multiplicative Decrease API Application Programming Interface AQM Active Queue Management
ARED Adaptive Random Early Discard
ASCII American Standard Code for Information Interchange BDP Bandwidth Delay Product
CDF Cumulative Distribution Function CPU Central Processing Unit
CoDel Controlled Delay CoV Coefficient of Variation DC Data Center
EBCDIC Extended Binary Coded Decimal Interchange Code EC2 Elastic Compute Cloud
ECN Explicit Congestion Notification FC Fast Convergence
FIFO First In First Out FT France Telecom
GIN Group Intranet Network HTTP HyperText Transfer Protocol I3S Informatique, Signaux et Syst´emes IaaS Infrastructure as a Service
IETF Internet Engineering Task Force IP Internet Protocol
I/O Input/Ouput
MSS Maximum Segment Size NS-2 Network Simulator version 2 ODE Ordinary Differential Equation OLNC Orange Labs Networks and Carriers OS Operating System
PDV Packet Delay Variation
PIE Proportional Integral controller Enhanced QUIC Quick UDP Internet Connections
RAM Random Accsess Memory RDP Remote Desktop Protocol RED Random Early Discard RTT Round-Trip Time SSH Secure Shell
TCP Transmission Control Protocol UDP User Datagram Protocol US United States
for their encouragement, their support, their patience and their love.
Introduction
Context and Motivation
Transmission Control Protocol (TCP) [CK05] is the main protocol for exchange of data in Internet Protocol (IP) network. TCP is involved especially in Web page down-load, HTTP streaming and peer to peer traffic, which together account for a large volume of transfers on the Internet. According to [JD04], more than 90% of the Internet traffic is handled by the TCP protocol. Therefore, if one wants to assess the Quality of Service (QoS) perceived by the cloud services customers, it is mandatory to study the perfor-mance, stability and robustness of TCP in Data Center networks.
To meet the changing requirements of Internet networks, various strategies for con-gestion control in TCP have been designed. Among them we can mention, Bic-TCP [XHR04a], TCP Cubic [HRX08] and Compound TCP [TSZS06]. Bic-TCP and TCP Cubic are designed specifically for high bandwidth delay products (BDP) links.
TCP Cubic is implemented and used by default in the Linux kernel since version 2.6.19, and it is the most widely used version of TCP nowadays [YLX+11]. It is
char-acterized by a cubic window growth function. The purpose of TCP Cubic is to achieve fair bandwidth allocation among flows with different RTTs using a window growth rate independent of the RTT. Instead, it uses a function of the time elapsed since the last loss event. When it does not operate in a high-bandwidth product environments, TCP Cubic features a TCP mode that mimics legacy TCP (TCP New Reno [PFTK00]) but is not identical to it.
The kind of networks for which TCP Cubic (and other high-speed TCP flavors) has been designed calls for analytical models to predict performance in general cases and study the impact of various parameters. Indeed, using experimental testbeds does not usually provide enough flexibility to explore a wide range of parameter values.
Massive data transfers are common in typical cloud scenarios, either within the data center itself or between the data center and the customer premise. In such a scenario, the transport layer, namely TCP, is put under pressure and might suffer performance
Introduction 3
problem, e.g., the TCP incast problem which is observed when a large number of storage devices simultaneously send data chunks to a single machine leading to congestion at the switch servicing the machine [VPS+09a].
Cloud environments are characterized by plenty of bandwidth. Modern versions of TCP such as TCP Cubic, are designed to work efficiently in such situations as they are able to probe for available bandwidth in a non linear fashion, unlike TCP New Reno, which inflates its windows by one MSS per RTT in stationary regime. However, there is a price to pay for being more aggressive: the fairness offered by TCP Cubic and other high speed versions of TCP is not as high as legacy TCP versions [LLS07]. Several studies also pointed out the appearance of synchronization among competing TCP Cubic flows [HR08]. The latter means that TCP Cubic flows, when competing for a bottleneck, tend to loose packets at the same time instant and the resulting aggre-gated throughput time series exhibit a clear Cubic behavior as if a single flow was active.
Some studies have linked the synchronization problem with the buffer sizing issue. Buffer sizing is a key aspect for both router design and network performance. After 20 years of intense activity in the study of “buffer sizing”, no proposal seems completely satisfactory. The empirical rule of the Bandwidth Delay Product (BDP) is still widely used as it optimizes the load of the output link of a router. However, it does not guaran-tee neither the loss rate nor the delay experienced by packets. Under certain conditions of traffic, a buffer size equal to the BDP can lead to performance problems essentially a very large time (i.e., the phenomenon of “bufferbloat”). Therefore, the scientific com-munity has focused on the study of active mechanisms in the buffer in order to answer the original question in the context of buffer sizing. Among these, there are proposals of adaptive buffer and more frequently today Active Queue Management (AQM) mecha-nisms in order to ensure a quality of service to individual flows. Random early detection RED [FJ93a] is one of the early AQM disciplines. Given that it needs careful tuning of its parameters for various network conditions, most network operators do not turn RED on [Ada13]. The adaptive RED or active RED (ARED) algorithm [FGS01] infers whether to make RED more or less aggressive based on the observation of the average queue length. Recently, two new AQMs Codel [NJ12b] [NJ12a] and PIE [RPC+13] have
been proposed to control the latency in order to address bufferbloat problem.
In general, our work aim to study the performance of TCP Cubic, widely used in today’s data centers, in cloud environment.
Outline and Contributions
In Chapter 1, we review the basic concepts and motivations of works related to this thesis. First, we present research efforts to analyze performance and failures in a data center networks. Several research works have been done to: (i) explore the nature of traffic in data centers; (ii) identify and resolve performance problems; and (iii) pro-pose comparator of the performance and cost of cloud providers. Then, we review in details TCP, the dominant transport protocol in cloud networks, and studies related to congestion control, buffer sizing and active queue management (AQM) mechanisms. Furthermore, we review studies that established a performance evaluation of TCP Cu-bic, through simulations and experiments. Finally, we present analytical models for TCP.
In Chapter 2, we first present a detailed overview of TCP Cubic algorithm, then we describe the analytical model that we have developed to study the performance of an isolated long-lived TCP Cubic flow. Through this model, we reveal the differences between the published TCP Cubic specifications and its implementation in NS-2. The model was validated by comparison with NS-2 simulations.
In Chapter 3, we aim at developing an analytical model for TCP Cubic to analyze its performance in typical cloud scenarios where a large number of long-lived TCP connec-tions, e.g., HTTP streaming or back-up flows, share a bottleneck link. Specifically, we consider three scenarios: (i) an intra data-center (DC) scenario with a lot of ongoing traf-fic between physical servers (intra-DC scenario); (ii) an inter data-center scenario where highly provisioned links are used to synchronize or back up data (inter DC scenario); and (iii) a content distribution scenario where a large number of high speed clients, e.g., FTTH clients, simultaneously download content from the data center (FTTH scenario). Our contributions are twofold:
• Based on a mean-field approximation, we derive a fluid model for TCP Cubic, that allows to predict performance in terms of several metrics. We additionally prove a scaling property of the fluid model, that allows to use it in a variety of networking scenarios without prohibitive computational cost. We carefully validate this analytical model against NS-2 simulations for our cloud scenarios.
• We provide an extensive comparison of TCP Cubic and New Reno for cloud sce-narios, assessing their efficiency/fairness trade-off as well as the impact of the buffer size on their performance. In particular, we demonstrate that TCP Cubic outperforms TCP New Reno, even for cases where the BDP is low, which are often encountered in cloud scenarios. This is interesting as TCP Cubic is mostly known
Introduction 5
for its behavior on high BDP paths ; not on low BDP paths.
In Chapter 4, we study the performance of TCP in real networks using two testbeds. The first testbed, called “Cube”, is an experimental network used by Orange Lab in order to test new services provided by the France Telecom (FT) company. The second testbed consists of a few Linux machines in I3S Lab that can be booted either under a native CentOS operating system or under VMware or Xen. This chapter comprises two separate parts. In the first part, we present results obtained with benchmarking tools for disk read and write operations. We use both the dd [Ubua] and hdparm [Ubub] tools.
In the second part of Chapter 4, we report on the network measurements performed from Cube machines. We generate traffic from or to one Cube machine to one host located in Orange Labs in Sophia. Next, we report the measurements in the Sophia to Cube and then on the Cube to Sophia direction. When increasing the number of par-allel flows from Cube to Sophia, we encountered some factors limiting the performance of these transfers: (i) the disk access; (ii) the virtualization layer; and (iii) a shaper. The engineering issue in this chapter was an opportunity for us as it allowed us to rec-ognize the interaction between the system and network issues in a typical cloud solution.
In Chapter 5, we investigate the issue of synchronization among TCP Cubic sources in detail. We study the extent and the root causes of synchronization using an experimental approach with a testbed hosted in I3S Lab combined with simulations. The former enables to experiment with actual protocol implementation in a controlled environment, while the latter permits to explore a wider set of network scenarios.
Our contribution to the study of the synchronization of TCP Cubic are as follows: • We experimentally establish the relation between the existence and extent of
syn-chronization with key parameters like RTT and buffer size. We demonstrate the resilience of synchronization to background traffic, and how the Fast Convergence option, which aims at making TCP Cubic more fair to fresh connections, catalyzes synchronization. For this point and the subsequent ones, we use New Reno as a reference point.
• We demonstrate that several factors contribute to the appearance of synchroniza-tion in TCP Cubic: (i) the rate of growth of the congessynchroniza-tion window when a TCP Cubic source reaches the capacity of the network and its relation to the RTT of the connection; (ii) the way the congestion algorithm of TCP Cubic tracks the ideal cubic curve in the kernel; and (iii) the competition among the TCP Cubic sources and the aggressiveness of the sources that did not experience losses during the last loss episode.
• We propose and evaluate two approaches to reduce the level of synchronization and hence the loss rate of TCP Cubic transfers. Perhaps more importantly, we provide hints that synchronization is the price to pay to have a high-speed TCP version that needs to explore the available bandwidth in the network in a super-linear manner. It is probable that we can alleviate synchronization, as our modifications of TCP Cubic do, but eliminating it out completely will be a complex task.
In Chapter 6, we evaluate the potential impact of the queue management algorithms (i.e., CoDel [NJ12b] [NJ12a], PIE [RPC+13], and ARED [FGS01]) on synchronization. Also, we explore how the two approaches that we proposed in Chapter 5 can be combined with advanced queuing mechanisms to further reduce synchronization. We show that through the use of active queue management (AQM) mechanisms we may have smaller delays and reduce synchronization between flows, but there is a price to pay: a higher packet loss and goodput degradation. Compared to our approaches, the use of AQMs for reducing synchronization was more efficient.
Finally, the contents of this thesis are summarized and perspectives are provided in Chapter 7.
Chapter 1
State of the art
1.1
Introduction
In this chapter, we present the research efforts related to the different parts of the thesis. We revisit the most important related works and we highlight problems faced when we revisited TCP performance in a cloud environment. We also provide a high level overview of the challenges we address in this work.
1.2
Performance of data centers
In the context of this thesis, we aim at investigating some of the performance problems raised by cloud computing architectures. Those problems are related to several elements: • Computational/storage facility that generally consists of a bunch of high end
servers that are heavily virtualized.
• Interconnection network within the datacenter that connect the physical servers to the Internet gateways (of the datacenter) with whom clients interfer.
• The paths between the gateway and the end users that is not under the control of the entity which runs the cloud computing service, but is the major source of delay and can constitute the bottleneck of the overall system.
Through a set of techniques and methods researchers can extract useful information concerning the path taken by a transfer and the components involved, then by applying data analysis they can overcome limitations of each variable (i.e., device, link), and draw conclusions that lead to actions.
1.2.1 Data Analysis
[GJN11] presents the first large-scale analysis of network failure events in several of Microsoft’s data centers, that was conducted by a team from the University of Toronto
and Microsoft Research. In this study, the authors focus on characterizing failures of network links and devices, estimating their impact, and analyzing the effectiveness of network redundancy in masking failures. They developed a methodology that cor-relates network traffic logs with logs of actionable events, to filter a large volume of non-impacting failures due to spurious notifications and errors in logging software. The authors want to leverage lessons learned from this study to guide the design of future data center networks.
Nowadays, data centers house a large number of inter-connected servers. It is thus necessary to explore how to better design and manage the data center networks. Existing proposals collect the flow traces by deploying additional modules on either switches or servers in small scale data center networks. In [KSG+09], the authors investigate the
nature of data center network traffic on a single MapReduce data center and investigate whether traffic matrices can be inferred from link counters by tomographic methods. They capture several characteristics of traffic flows within data center networks (i.e., the real traffic characteristics): which server is talking to which other servers, when and for what reasons, the flow durations, the inter-arrival times.
1.2.2 Scalable Network-Application Profiler (SNAP)
In [YGM+11], the authors present SNAP, a scalable network-application profiler that
guides developers to identify and resolve performance problems. They aim to reduce the demand for developer time by automatically identifying performance issues and narrowing them down to specific times and places (e.g., send buffer, delayed ACK, or network congestion).
The SNAP’s features are :
• It has full knowledge of the network topology, and the mapping of applications to servers. This allows it to identify applications with frequent problems, as well as congested resources that affect multiple applications.
• It can instrument the network stack to observe the evolution of TCP connections directly, rather than trying to infer TCP behavior from packet traces.
• It can collect finer-grain information, compared to conventional SNMP statistics, without resorting to packet monitoring.
SNAP collects TCP statistics and socket-level logs in real time, classifies and cor-relates the data to pinpoint performance problems. The profiler quickly identifies the right location (end host, link, or switch), the right layer (application, network stack, or network), at the right time.
Chapter 1. State of the art 9
To validate the design of SNAP, the authors take two approaches: they inject a few known problems in the production data center and check if SNAP correctly catches these problems (SNAP correctly pinpointed all the labeled problems), or they evaluate the accuracy of identifying delayed ACK in SNAP by comparing its results with the packet trace.
1.2.3 Comparing Public Cloud Providers (CloudCmp)
In [LYKZ10], the authors present CloudCmp, a comparator of the performance and cost of cloud providers. They apply CloudCmp to the four most known cloud providers today, and they show that it can guide customers in selecting the best-performing provider for their applications.
CloudCmp measures the elastic computing, persistent storage, and networking ser-vices offered by a cloud along metrics that directly reflect their impact on the perfor-mance of customer applications.
The authors use three indicators to compare the performance of the compute clusters: benchmark finishing time, cost per benchmark, and scaling latency. These quantities reflect how quickly an instance can run, how profitable it is, and how quickly it can scale.
CloudCmp compares the performance and cost of cloud providers along dimensions that matter to customers. The authors consider three types of metrics :
• Computation metrics : The authors modified a set of Java-based benchmark tasks, a standard benchmark suite for Java virtual machines.
• Storage metrics: The authors wrote their Java-based client based on the reference implementations from the providers.
• Network metrics: standard tools (Iperf and ping) .
From the comparison results, the authors find that the performance and price of the four providers vary significantly with no one provider standing out.
1.2.4 The Incast Collapse problem
With the incast problem application throughput decreases when multiple senders communicate with a single receiver in high bandwidth, low delay networks using TCP. In [VPS+09b], the authors present a solution to eliminate TCP incast collapse in datacenter
environment. They propose the use of high-resolution timers to enable microsecond-granularity TCP timeouts.
The authors present and evaluate a set of system extensions to enable microsecond-granularity retransmission timeouts (RTO). They proceeded by modifying the Linux
TCP implementation to use high-resolution kernel timers. They show that for both simulation and real cluster, and for all configurations, goodput drops with increasing RTOmin above 1ms. Through a wide-area evaluation, the authors showed that these modifications remain safe for use in the wide-area, providing a general and effective improvement for TCP-based cluster communication.
1.2.5 Virtualization in cloud environments
Virtualization is the new trend of modern private and public cloud solutions. Several virtualization solutions exist on the market and rely on different principles: (1) para-virtualization; (2) full para-virtualization; and (3) container-based solutions. A key point for those solutions in a datacenter context, is the technique used to share the physical network interfaces among the virtual machines (VMs) [TIIN10].
Whatever the solution is, one ends up in a situation where a lot of VMs share the physical resources of the physical host. Virtualization is being used by an increasing number of organizations to: (i) reduce power consumption and air conditioning needs; (ii) reduce space savings resulting from decreasing the number of servers as one physical server can host many virtual machines; and (iii) create a more efficient system adminis-tration through a centralized and flexible management.
Virtualization also provides high availability for critical applications, streamlines ap-plication deployment and migrations. By simplifying operations, it allows IT organiza-tions to respond faster to quick changes in the business demands. Two examples are Amazon EC2 1 and Windows Azure2.
Several studies have investigated the impact of virtualization on performance in cloud environments. In [APU12], the authors created a testbed (hosted in the I3S lab France) and used it to evaluate three operating systems (OS) CentOS Vanilla, VMware ESX and Xen in terms of User Datagram Protocol (UDP) performance with a brief glance at TCP. They considered the Packet Delay Variation (PDV) as a metric to assess the performance of these 3 OSs. Under UDP, the authors noticed better performance of native CentOS than the virtualized machines, while the TCP performance showed that the virtualized machines behave better than the native OS in terms of fairness between the virtual machines.
In [WN10], the authors present a measurement study to characterize the impact of virtualization on the networking performance of the Amazon Elastic Cloud Computing (EC2) data center. They measure a set of properties in their experiments: the processor sharing, packet delay, throughput and packet loss among Amazon EC2 virtual machines.
1
http://aws.amazon.com/ec2/
2
Chapter 1. State of the art 11
They consider mainly Amazon EC2 small instances and high CPU medium instances. Small instances provide a small amount of CPU resources, while medium instances offer a balanced set of CPU resources, memory, and network3. The authors set up 2 types of experiments: (i) a spatial experiment to evaluate how the network performance varies on instances at different network locations; and (ii) a temporal experiment to evaluate how the network performance varies on a given instance over a long time period.
Experiments show an unstable network characteristics that are caused by virtualiza-tion and processor sharing on server hosts. First, Amazon EC2 small instance virtual machines typically receive only a 40% to 50% share of the processor. Also, processor sharing can cause very unstable throughput among Amazon EC2 small instances. Even though the data center network is not heavily congested, there are abnormally large packet delay variations among Amazon EC2 instances. And, the delay variations can be a hundred times larger than the propagation delay between two end hosts.
1.3
TCP and congestion control
1.3.1 A Protocol for Packet Network Intercommunication
The proposal of TCP laid the basis for the development of Internet. The TCP congestion control mechanism enables the sender to adjust the transmission rate and the congestion window size according to the network conditions. This protocol shows a great improvement in the utilization of the network.
In [CK05], the authors provide one of many important studies on the Internet de-velopment. In May 1974, when the paper was published, there existed many kinds of networks, that implemented packet switching in different ways. Hence the necessity of a common protocol to share resources among these networks (inter-networking protocol). Cerf and Kahn [CK05] are sometimes referred to as the “fathers of the Internet” for implementing the common protocol TCP/IP. They present a protocol design and philosophy that supports the sharing of resources existing in different packet switching networks.
Some fundamental tasks of the TCP protocol were described in this paper: • GATEWAY, a network node that acts as an interface between networks. • Mutliplexing and demultiplexing of segments among processes.
• Sequencing used for the reconstruction of messages at the TCP receiver. • Timeout and positive acknowledgment mechanism.
3
• Flow control mechanism used to manage the rate of data transmission between two nodes, and to prevent a fast sender to overwhelm a slow receiver.
1.3.2 Congestion problem
The huge growth of computer networks has produced major congestion problems. The authors in [Jac88] speculate that much of the cause lies in transport protocol im-plementations (not in the protocols themselves). In October 1986, the Internet had the first of what became a series of “congestion collapses” that were caused by congestion control in the implementation of TCP. In control system theory, this is expected since the system in that time reaches capacity exponentially but does not reduce the input by a comparable rate.
One key to prevent congestion collapse is to ensure that senders do not over-utilize links at the beginning of the transmission. Thus, to solve this problem, the authors looked for pieces of a TCP implementation that violate the conservation principle. The packet conservation principle states that a packet should only be injected into the net-work after one has been removed . If the netnet-work accomplishes this principle, it should be robust in face of congestion.
They reported three ways to violate the principle : either (1) the connection does not get to equilibrium; or (2) a sender injects a new packet before and old packet left; or (3) the equilibrium can not be reached because of resource limits along the path. To achieve the required equilibrium, the authors developed an algorithm that increases the packets that a sender sends with several rules. They add a congestion window (cwnd ) for each connection at the sender, when starting or restarting after a loss, set cwnd to one packet. On each acknowledgment the cwnd is increased by one packet, and when sending, send the minimum of the receiver’s advertised window and cwnd.
To resolve the second problem of “Conservation at equilibrium”, the authors set a RTT estimator.
Finally, to solve the resource limits problem, the authors developed a congestion avoidance algorithm that decreases the cwnd to half its current value (this is the mul-tiplicative decrease), and for each ACK for new data, increases cwnd by 1 (this is the additive increase).
The principle of congestion avoidance (Additive Increase Multiplicative Decrease AIMD) is illustrated in Figure 1.1. Paths x0x1, . . . , x2nx2n+1 represent the additive
increase part where both flows have the same increase rate of their congestion win-dows. While paths x1x2, . . . , x2n+1x2n+2 represent the multiplicative decrease for which
a flow with the larger congestion window decreases more than a flow with the smaller congestion window.
Chapter 1. State of the art 13
In the flow-control world if the offered load in an uncontrolled distributed sharing system (e.g., road traffic) exceeds the total system capacity, the effective load will go to zero (collapses) as load increases, see Figure 1.2.
Figure 1.1: Congestion avoidance (AIMD)
[ATRK10]
Figure 1.2: Effective TCP load versus offered load from TCP
senders [ATRK10]
1.3.3 Congestion control for TCP
In the last few years, through the development and evolution of the Internet, the focus of research has changed from the fundamental problem of removing the congestion collapse phenomenon to problems of the efficient use of network resources in variety of environments.
In [ATRK10], the authors presented a study of different approaches to TCP conges-tion control that do not rely on any explicit notificaconges-tion from the network. They focus on a variety of problems that TCP tried to optimize.
They devoted the first part of their study to classify and to discuss proposals that build a foundation for host-to-host congestion control principles. The first proposal is Tahoe [Jac88], the first version of TCP with congestion control, proposed by Jacobson in 1988. Tahoe introduces the basic technique of probing progressively network resources and relying on packet loss to detect that the network limit has been reached. Although this technique resolves the problem of congestion collapse, it creates a great deal of inef-ficient use of the network by straining the network with high-amplitude periodic phases. This behavior induces periodic changes in sending rate, round-trip time, and network buffer utilization, leading to variability in packet losses. To resolve the efficiency prob-lem, the authors propose algorithms that refine the core congestion control principle by making more optimistic assumptions about the network and using prediction parameters of the network congestion state (e.g., three duplicate acknowledgment (ACK), timeout).
Two proposals, BIC TCP [XHR04b] and TCP Cubic [HRX08], use packet loss to establish an approximated network resource limit, which is used as a secondary criterion to estimate the current network state. TCP Cubic uses time elapsed since last congestion to update its window size via a cubic function. Another proposal is Compound TCP [TSZS06] that relies on the estimation of queueing delay as a measure of congestion. If the queueing delay is low, Compound TCP supposes that there is no congestion and increases the rate. Compound TCP is deployed in the Windows-world, and the Linux-based OSs use TCP Cubic.
1.4
Other congestion control strategies
1.4.1 Buffer sizing
In recent years, several studies addressed the problem of how to adequately dimension router buffers for large bandwidth delay product (BDP) networks. So, to compute the “right” amount of buffering, several rules derived from these studies which are conflicting with each other.
Router buffers are sized today based on a rule-of-thumb commonly attributed to a 1994 paper by Villamizar and Song [VS94]. The authors used experimental measure-ments of at most eight TCP flows on a 40Mb/s link. Their results show that a router needs an amount of buffering equal to the average RTT per flow that passes through the router, multiplied by the capacity of the router’s network interfaces C, see Equation 1.1 .
B = C× RT T (1.1)
But, it is not easy to build routers with larger capacity. That is why other studies have derived other rules for determining an adequate buffer size B.
In [AKM04], the authors argue that with the rule-of-thumb queuing delays can be long, have high variance, may destabilize the congestion control algorithms, that make it inappropriate for backbone routers. So, they have proposed a new rule 1.2 that can be applied for both N long-lived and short-lived TCP flows. To validate this rule, the authors used two validation methods: simulation using NS-2, and a network of real Internet routers.
B = C∗ RT T /√N (1.2) In [WM05], the authors recommend using buffer sizes equal to Equation 1.3
Chapter 1. State of the art 15
By means of NS-2 simulations, the authors in [HR09] and [CB07] assert that an adequately dimensioning router buffers for links should be in the order of 10%BDP and B=20%BDP, respectively.
Other papers [Rai05] [EGG+05] claim the use of buffers of the order of a few dozen of packets.
According to what we have read above there is no consensus yet on what is a “good” dimensioning rule that allows to always achieve high utilization.
1.4.2 Active Queue Management mechanisms
Active Queue Management (AQM) mechanism is a congestion control mechanism at a router for controlling the number of packets in the router’s buffer by actively discard-ing some arrivdiscard-ing packets. It can shorten the average delays in the router’s buffer and can also achieve higher throughput.
Random Early Detection (RED) [FJ93b] is one of the AQM disciplines. It controls the queue length which would affect delay implicitly. RED requires careful tuning of their parameters in order to provide good performance.
Several modern and self-tuning AQM disciplines have been proposed, and can be run with their default parameters in most circumstances. The adaptive RED or active RED (ARED) [FGS01] algorithm infers whether to make RED more or less aggressive based on the observation of the average queue length. It changes the drop probability according to how aggressively it senses it has been discarding traffic.
More recently, some researchers designed and implemented new AQMs: (i) Con-trolled Delay (CoDel) developed by Van Jacobson [NJ12b]; and (ii) Proportional Inte-gral controller Enhanced (PIE) [RPC+13]. These AQMs control the latency to address
bufferbloat problem.
There have been some comparisons of these AQMs: in [RPC+13] the authors show
that compared to Codel and ARED, PIE can achieve better latency and higher link utilization.
In [NK13], the authors conducted a comparison of Adaptive RED, Codel and PIE through experiments in both wired and wireless networks. They show that ARED achieves better queuing delay for all RTTs, but it loses in terms of goodput for RTTs larger than 100ms.
In [HR09], the authors present an evaluation of the potential impact of the Random Early Detection queue management algorithm on loss synchronization. Their results show that for large buffers, RED strongly reduces the synchronization rate, compared
to DropTail. With medium to small buffers, the loss synchronization is roughly similar with both types of queue management strategies.
More details about active queue mechanisms will be given in chapter 6.
1.4.3 Multipath TCP
Multipath TCP protocol is a replacement for TCP. It allows creating simultaneous multiple sub-flows amongst two end hosts through multiple network interfaces where each sub-flow maintains sending data packets over a path. The coordinated congestion control moves more traffic on the less-congested paths as a load balancing mechanism.
In [WRGH11], the authors describe and evaluate the design of a multipath congestion control algorithm for multihomed servers, data centers and mobile clients. They show that their algorithm works across a wide range of scenarios and that it can be used as a drop-in replacement for TCP.
1.4.4 Transport protocol at the application layer
Google has proposed 2 new protocols to replace HTTP, SPDY [MBT12] and then QUIC (Quick UDP Internet Connections) [qui13]. These protocols require to be deployed both at the sender and the server sides. No other cloud operator than Google has claimed to use these new protocols. Facebook has proposed to launch the working group “httpbis” within the IETF to standardize the next version of HTTP, the HTTP2.0 [MB13]. HTTP2.0 aims to improve the performance of HTTP transfer using more efficiently TCP.
1.4.4.1 SPDY
In [MBT12], the authors describe SPDY (pronounced “SPeeDY”) a protocol con-ceived for the transport of contents with low latency on the World Wide Web. The most frequent browsers (Internet Explorer, Firefox, Chrome, Opera and Safari) already implement SPDY.
SPDY adds a session layer atop SSL that allows multiple concurrent, interleaved streams over a single TCP connection. Amongst the objectives of SPDY we mention:
• Target a 50% reduction in page load time.
• Minimize deployment complexity as it requires no changes to existing networking infrastructure.
• Avoid the need for any changes to content by website authors. The only changes required to support SPDY are in the client user agent and web server applications.
Chapter 1. State of the art 17
It should be noticed that some papers express doubts about the actual efficiency of SPDY. Microsoft have proposed a new HTTP, “Speed+Mobility” [Pao12].
1.4.4.2 QUIC
QUIC [qui13] is a network protocol that supports a set multiplexed connections over UDP, and was designed to provide security protection equivalent to TLS/SSL, along with reduced connection and transport latency. It combines a carefully selected collection of techniques to reduce the number of round trips needed to surf the Internet.
QUIC employs bandwidth estimation in each direction for congestion avoidance, and then pace packet transmissions evenly to reduce packet loss. It also use packet-level error correction codes to reduce the need to retransmit lost packet data. QUIC is currently only implemented in Chrome.
1.4.4.3 HTTP2.0
HTTP2.0 [MB13] is an optimized expression of the syntax of the Hypertext Transfer Protocol (HTTP). The HTTP2.0 encapsulation enables more efficient use of network resources and reduced perception of latency by allowing header field compression and multiple concurrent messages on the same connection.
1.4.4.4 Aspera FASP
In [Comb], the authors present Aspera FASP a data transport technology built to supply an optimal alternative to traditional technologies of transport based on TCP to transfer files over public and private IP networks. It represents a service proposed by Amazon4.
Aspera is implemented at the application layer, as an endpoint application protocol, avoiding change of network standard. It is designed to provide an efficient data transport over an IP network independent of network delay and packet loss.
Aspera has several major improvements:
• Bandwidth discovery : Automatically discovers the path MTU size, which may avoid packet fragmentation and improves performance.
• Optimization for small files : Introduce a file streamlining technique which elimi-nates the performance bottleneck when transferring several small files.
• Improved adaptive transfer rate : Enable users to utilize all available bandwidth along the transfer path, while fairly sharing the network capacity with other traffic.
4
• Parallel transfer : Introduces parallel transfer for server clusters or multi-core machines, enabling full leverage of computing power.
• Aggregate bandwidth management : Include the management of the aggregate bandwidth to keep the total transfer rate of all transfers below a pre-configured bandwidth.
1.5
TCP Cubic evaluation : models, simulations and
ex-periments
The focus of this thesis was on TCP Cubic [HRX08], implemented and used by default in Linux kernels since version 2.6.19. This protocol achieves some improvements on BIC TCP [XHR04b]. It performs well in wired networks with large bandwidth-delay product. TCP Cubic simplifies the BIC TCP window control and improves TCP-friendliness.
We made a thorough study about models as well as experimentations that have been elaborated in the literature about TCP Cubic protocol. We report in the next section several important works related to TCP Cubic.
TCP Cubic is a TCP-friendly high-speed variant, in which the window size is a cubic function of time since the last loss event. More details about the window evolution will be given in the next chapter.
Several studies have evaluated the performance of TCP Cubic through simulations and experiments. Analytical models for TCP Cubic with a large number of flows sharing a common bottleneck link are few. We classified these works in 2 categories: models and experimentations.
1.5.1 Evaluation through analytical models and simulations
In [BWL10], the authors propose an analytical model to analyze the performance of a single TCP Cubic connection in wireless networks. This model aims to determine the steady state throughput of TCP Cubic. It considers both congestion loss and random packet loss. Congestion loss occurs when the transmission rate reaches the maximum capacity C of the bottleneck link. However random packet loss is caused by fading, or interference on the wireless link (random poisson process with rate λ).
In order to validate the accuracy of the proposed analytical model, the authors de-velop a discrete-event simulator. They consider the root mean square (RMS) error as a performance metric. The RMS error reflects the gap between the analytical results and the simulation results. Results show that (1) as the simulation time is increased the RMS error decreases. (2) The random packet loss reduces the normalized average throughput more for end-to-end flow with large bandwidth-delay product.
Chapter 1. State of the art 19
In [PS11], the authors build an analytical model for TCP Cubic with random packet drops and constant RTT. They investigate two cases: (i) three TCP Cubic connections; and (ii) two TCP connections, one TCP Cubic and the other one TCP New Reno. The authors consider the case of random packet losses, each packet of connection i gets lost in transmission with probability pi≥ 0 independently of each other. ( This can
corre-sponds to wireless links). They use the M/GI/1 approximation to evaluate the sojourn time in the queue at the router. All connections sharing the same link are subject to the same loss rate and same propagation delay �. Through comparison with NS-2 simula-tions, the authors show that the model captures the dynamics of TCP Cubic fairly well. The results using the model closely match the results obtained through NS-2 simulations.
The authors in [BAC09] compare the performance of TCP Cubic, Compound TCP, HighSpeed TCP and Reno under a simple loss model, where each packet is dropped with probability p. They model the evolution of the congestion window with a Markov chain, and use efficient numerical algorithms to compute the average window size, the Coefficient of Variation (CoV) of the window and the average throughput. They find that, for smaller bandwidth delay products (i.e., 150 packets), TCP Cubic can have a similar throughput to Reno while for larger values (i.e., between 5000 and 7000 packets) the throughput of all new versions is similar and larger than Reno.
Also in [ARFK10], the authors compare the performance of TCP New Reno, TCP Cubic and Compound using NS-2 simulations. They consider 3 scenarios: (1) a single connection; (2) a single bottleneck with N sources sharing a 10Gbps link; and (3) wire-less link. They investigate the goodput, intra and inter-protocol fairness of these two protocols. Results show that TCP Cubic outperforms the other two variants in terms of goodput and intra-protocol fairness in high speed wired networks. In wireless networks all protocols are unable to reach a high goodput in the presence of reverse traffic. Also, the intra-protocol fairness is almost equal to 1 for all of them.
In [LGBP10], the authors proposed a new method to predict TCP throughput’s vari-ations. This method is based on the theorem of large-deviations that has been applied to a Markov-chain model of the evolution of TCP Reno’s congestion window. They used the loss probabilities imposed by the network conditions for calculating a theoretical pre-diction of the so-called large-deviations spectrum which contains detailed information on TCP performance. The resulting prediction remains perfectly accurate in complex environments and also on real Internet. This method was applied on other TCP variants: BIC TCP, HighSpeed and TCP Cubic, and the obtained results show that it permits fine performance characterization of these TCP variants.
In [LHHL12], the authors introduce an extended version of TCP Cubic, TCP multiple paths (MPCubic). MPCubic moves traffic away from congested paths to uncongested paths, and fairly share the capacity with standard TCP at common bottleneck. This protocol can achieve stability, throughput improvement, fairness, and load-balancing. Through simulation results, the authors found that the proposed protocol can outper-form MPTCP, improve throughput peroutper-formance, and can improve its traffic away from congested link, while it can preserve fairness with single-path TCP Cubic, regular TCP and MPTCP (with short RTTs). Moreover, MPCubic can quickly recover its data rate after restoration of failed links.
The goal in [CEH+09] is to compare the protocol growth functions, especially in terms of the second or higher-order stochastic behaviors of the protocols that employ these functions. They indicate that protocols having a concave-convex window growth function and using the maximum window size in the last congestion event as an inflection point, have most of the time a concave window growth profile in the steady state. These results were confirmed for both BIC TCP and TCP Cubic protocols that have this property, through NS-2 simulation and experimentation.
1.5.2 Evaluation through experiments
In [JR11], the authors present an experimental evaluation of TCP Cubic in a small buffer regime (i.e., buffers of the order of a few tens of packets). The experiments are carried out using the NetFPGA platform5.
They focus on the interaction of long-lived flows, over a variety of bandwidth-delay product environments. This work shows the following effects: (1) for small link capac-ities, there is a distinctive impact on utilization as the number of users, and the round trip times vary; and (2) for large link capacities, small buffers can induce synchronization effects.
The authors conducted experiments with two sets of capacities: 123Mbps and 946Mbps. In each of these cases, they used two sets of buffer sizes: 16, and 128 packets. The num-ber of flows is equal to 10, 100 and 200 flows.
For scenario with 123Mbps, a buffer size of 16 packets, and for a fixed population of users, as the RTT gets larger, the utilization drops. Also, for a fixed RTT, as the number of users increase, there is a visible increase in the utilization. While, with a buffer size of 128 packets, varying the number of users or the RTT did not produce a visible reduction in the utilization. For scenario with 946Mbps and a buffer size equal 128 packets, authors noted the appearance of synchronization between flows, which means that all flows loose packets simultaneously.
5
Chapter 1. State of the art 21
1.6
Analytical models: Mean-field approach
Analytical models are mathematical models which have a closed form solution. The solution of the equations used to describe the changes in a system can be expressed as a mathematical analytical function.
The initial motivation of mean-field models was to analyze the behavior of computer networks. It can be used to analyze systems with large number of objects; where each object is defined by a stochastic model while the global model can be approximated by a fluid limit.
The authors in [BtLB08] have given a results for a model of N interacting objects. They consider that the ordinary differential equation (ODE) is a good approximation of the occupancy measure of the stochastic system. The paper comprises two separate parts: a first part is devoted to the analysis of the mean field limits of a general system of interacting objects that are also interacting with a random environment. In the sec-ond part, the authors demonstrate that this approach can be applied to understand the behavior of computer networks with a large number of objects sharing resources.
In [BMM07], the authors present a generic result that allows a reduction of a large Markov chain model of interacting objects to a dynamical system whose state is the occupancy measure (i.e. the distribution of states of all objects), or, more generally, a function of the history of the occupancy measure. The resulting dynamical system is deterministic, but it can be used to study a stochastic system (with considerably smaller dimension) that reflects the state of one or several tagged objects.
There have been several mean-field models of TCP in the literature such as [BMR02]. In this paper, the authors introduced a mean-field model for a large number N of TCP Reno connections. All connections share a bottleneck queue in a router implementing RED (Random Early Discard) active queue management mechanism. The model con-verges, when the number of connections N tends to infinity, to a deterministic transport equation.
1.7
Conclusion
In this chapter, we presented an overview of the main research works in correlation with our scopes of TCP Cubic performance analysis. We have reported brief history of some TCP protocols. We also present a survey of some congestion control algorithms. We further report relevant works in (i) Mean-field theory; (ii) buffer sizing; and (iii) virtualization. And finally, we briefly review studies on AQMs mechanisms.
In the next Chapter, we focus on TCP Cubic protocol as it is used by default since 2004 in the Linux Kernel, and we summarized its main characteristics. Then we present our analytical model for a single long-lived connection.
![Figure 2.5: Trace of the sequence and acknowledgment numbers when there is no loss [Col98]](https://thumb-eu.123doks.com/thumbv2/123doknet/13175355.390843/52.918.228.699.370.686/figure-trace-sequence-acknowledgment-numbers-loss-col.webp)