HAL Id: hal-00089690
https://hal-insu.archives-ouvertes.fr/hal-00089690
Submitted on 22 Aug 2006
HAL is a multi-disciplinary open access
archive for the deposit and dissemination of sci-entific research documents, whether they are pub-lished or not. The documents may come from teaching and research institutions in France or abroad, or from public or private research centers.
L’archive ouverte pluridisciplinaire HAL, est destinée au dépôt et à la diffusion de documents scientifiques de niveau recherche, publiés ou non, émanant des établissements d’enseignement et de recherche français ou étrangers, des laboratoires publics ou privés.
Consequences of transformation of native Cerrado in
pasture land on the porosity of a clayey-sand red latosol
Luíz Carlos Balbino, Ary Bruand, Michel Brossard, M. F. Guimarães, P.
Quétin
To cite this version:
Luíz Carlos Balbino, Ary Bruand, Michel Brossard, M. F. Guimarães, P. Quétin. Consequences of transformation of native Cerrado in pasture land on the porosity of a clayey-sand red latosol. inconnu, 2000, 3p. �hal-00089690�
CONSEQUENCES OF TRANSFORMATION OF NATIVE CERRADO IN PASTURE LAND ON THE POROSITY OF A CLAYEY-SAND RED LATOSOL.
L.C. Balbino1, 2, A. Bruand1, 3, M. Brossard4, M. F. Guimarães5 and P. Quétin1
1: Science du Sol, INRA, BP 20619, 45166 Olivet cedex, France (Luiz.Balbino@orleans.inra.fr) 2: Embrapa CNPAF, BP 179, 74001-970 Goiânia, GO Brazil
3: ISTO, Université d'Orléans, Géosciences, BP 6759, 45067 Orléans cedex 2, France 4: IRD/Embrapa CPAC , BP 7091, 71619-970 Brasilia, DF Brazil
5: Universidade Estadual de Londrina, Dept. de Agrônomia, BP 6001, 86051-990 Londrina, PR Brazil Key-words: Brachiaria decumbens, structure, bulk density, mercury porosimetry, scanning electron microscopy
In the Brazilian savannah (Cerrados area), about 60 % of the surface area is used as pasture land and 30 % of the latter is cultivated pasture. Many studies have reported that pastures degrade quickly and degradation would be more intense when the soil was tilled prior pasture sowing. Pasture degradation (decrease in the pasture quality and yield, weed invasion) would be partly a consequence of the soil structure evolution (Balbino & Di Stefano, 1999). Origin of pasture degradation is still under discussion and analysis of the literature showed that there is a lack of quantitative data. The aim of this study is to perform a detailed analysis of the porosity in a low productivity cultivated pasture and to compare the results with the porosity of a similar soil still under native vegetation (Cerradão, i.e. Scierophylous forest).
Material and methods
The study site is located in the Mato Grosso do Sul state, Brasilândia county (21º 22,53' S 52º 11,73' E). Mean annual rainfall is 1600 mm. The soil is a sandy-clay latosol (Latossolo vermelho) developed on deeply weathered cretaceous materials (Bauru sandstones). Clay fraction is kaolinite mainly with iron oxi-hydroxides in small proportion. Two sites with similar soils were selected: one in native forest (cerrado) and another one in a low productivity pasture of brachiara (Brachiaria
decumbens) 20 years old. The soil was described down to 1 m depth with particular attention to
structure. Bulk density measurements were performed using cylinder 98 cm3 in volume. In the
laboratory we investigated the pore size distribution from 360 down to 0.006 µm using mercury porosimetry (Fig. 1). Thin sections of undisturbed samples were examined in scanning electron microscopy using back-scattered electron emission (Bruand et al., 1996).
Results and discussion
Under pasture, the upper horizon (0–3 cm) was massive with horizontal roots. Then from 3 to 15 cm depth, well developed and small to medium polyhedral aggregates associated with a few micro-aggregates were observed. Roots are mainly located between the polyhedral micro-aggregates. Under forest, small to medium polyhedral aggregates with lots of micro-aggregates were encountered from 0 to 15 cm depth. Roots were located between and within the polyhedral aggregates. From 15 to 100 cm depth, aggregates were micro-aggregates mainly in a closer packing under pasture than under forest. A few polyhedral aggregates were present under pasture but their number and size decreased with depth. Biological activity (termites, ants and earthworms) was smaller under pasture than under forest and located close to the surface mainly.
Under forest, the bulk density ranged from 0.80 in the first top centimetres to 1.03 at 15 cm depth when under pasture it ranged from 1.08 to 1.22 from the surface to 13 cm depth (Table). These bulk density values showed a much smaller pore volume in the topsoil under pasture. From 18 to 100 cm depth, bulk density showed also smaller porosity under pasture.
Analysis of the structure using microscopy showed the presence of polyhedral aggregates a few millimetres to one centimetre in size and micro-aggregates 50–100 µm in size (Fig. 2). These two types of aggregate were present in different proportions according to the site and horizon. Analysis of the porosity showed that pore were (Fig. 1): (i) pores larger than several hundreds of micrometers in size which resulted from biological activity (root, ants and termites channels) and polyhedral aggregate packing, (ii) pores a few micrometers to one hundred micrometers in size which resulted from micro-aggregate packing and (iii) pores which resulted from the packing of clay particles within polyhedral aggregates and micro-aggregates and which were not visible in scanning electron
microscopy because they are too small. Comparison of porosity within every profile showed a decreased in the large pores with depth and an increase in the pores corresponding to micro-aggregates packing because they are more numerous with depth.
The mercury intrusion curve enabled the identification of several classes of pores (Bruand et al., 1993; Curmi et al., 1994). Results showed the presence of two classes of pores A and B which corresponded to pores with equivalent pore diameters ranging from 0.022 to 0.025 µm and from 18 to 58 µm in equivalent diameter, respectively (Fig. 1). Class B corresponded to pores resulting from the packing of micro-aggregates. Large pores resulting from polyhedral aggregates packing and biological activity were not measured or just partially because they were too large to be studied using mercury porosimetry. Results showed that the volume of pores B was greater in the 0–3 cm layer and much smaller (from 20 to 40 % smaller) in the 3–17 cm layer under pasture than under forest (Table). Pores
B were also smaller under pasture than under forest as shown by the smaller Dm,B. Under pasture, the
greater Vp,B in the 0–3 cm layer would result from a great under-estimation of Vp,B in the 0–3 cm layer
under forest because the micro-aggregates were in a very loose packing leading to too large pores to
be measured using mercury porosimetry. From 17 to 100 cm depth, Vp,B was similar or smaller (from
5 to 25 % smaller) under pasture. This is consistent with field observation which showed a less
developed structure under pasture. This smaller Vp,B might result also from a smaller amount of
micro-aggregates because of a smaller clay content (Table). The volume of pores belonging to class A ranged
from 0.046 to 0.112 cm3 g-1 (Table). These pores resulted from the packing of clay particles within the
polyhedral and micro-aggregates. The no or very little variation of Dm,A showed no or very little
variation of both the size and packing of the elementary kaolinite particles. Such a result is consistent
with the close relationship between Vp,A and the clay content (r
2
= 0.95).
Conclusion
Our results showed a strong evolution of the structure which led to a decrease in the porosity, particularly in the topsoil layers. Except the very small pores which result from the packing of the kaolinite particles within aggregates, all the pores were less developed under pasture. Field observations showed also a structure less developed from 15 to 100 cm depth under pasture and mercury porosimetry showed that micro-aggregates would be in a closer packing under pasture than under forest. However, this will need further analysis to be confirmed.
Balbino, L.C., Di Stefano J.G., 1999. Projet PROCITROPICOS: Intégration de l'agriculture et de l'élevége par les systèmes de semis direct, pp. 409-417, In: Rasolo, F. and M. Raunet (eds), Gestion agrobiologique des sols et des systèmes de culture. Actes de l'atelier international, Antsirabe, Madagascar, 23-28 mars 1998, Cirad, Collection Colloques, 658p.
Bruand, A., D'Acqui, L.P., Nyamugafata, A P., Darthout, R., Ristori, G.G., 1993. Analysis of porosity in a tilled "crusting soil" in Zimbabwe. Geoderma, 59, 235-248.
Bruand, A., Cousin, I., Nicoullaud, B., Duval, O., Bégon J.C., 1996. Backscattered electron scanning images of soil porosity for analysing soil compaction around roots. Soil Science Society of America Journal, 60, 895-901.
Curmi, P., Kertzman, F.F., Quieroz Neto, J.P., 1994. Degradation of structure and hydraulic properties in an Oxisol under cultivation (Brazil). In: Soil Micromorphology: Studies in Management and Genesis. Developments in Soil Science 22, Elsevier, Amsterdam, 569-579.
0 0.05 0.10 0.15 0.20 0.25 0.30 0.35 0.40 0.001 0.01 0.1 1 10 100 1000 Equivalent diameter De / µm ∆ V / ∆ ( log D)
A
B
Figure 1: Pore volume distribution for the 18–30 cm layer under forest.
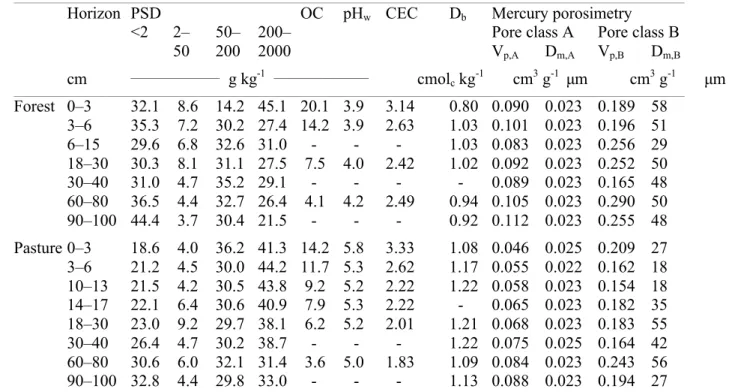
Table: Physical and chemical data for the soils studied.a
___________________________________________________________________________________________________________________________________________________________________________________
Horizon PSD OC pHw CEC Db Mercury porosimetry
<2 2– 50– 200– Pore class A Pore class B
50 200 2000 Vp,A Dm,A Vp,B Dm,B cm _________________ g kg-1 __________________ cmolc kg-1 cm3 g-1 µm cm3 g-1 µm ___________________________________________________________________________________________________________________________________________________________________________________ Forest 0–3 32.1 8.6 14.2 45.1 20.1 3.9 3.14 0.80 0.090 0.023 0.189 58 3–6 35.3 7.2 30.2 27.4 14.2 3.9 2.63 1.03 0.101 0.023 0.196 51 6–15 29.6 6.8 32.6 31.0 - - - 1.03 0.083 0.023 0.256 29 18–30 30.3 8.1 31.1 27.5 7.5 4.0 2.42 1.02 0.092 0.023 0.252 50 30–40 31.0 4.7 35.2 29.1 - - - - 0.089 0.023 0.165 48 60–80 36.5 4.4 32.7 26.4 4.1 4.2 2.49 0.94 0.105 0.023 0.290 50 90–100 44.4 3.7 30.4 21.5 - - - 0.92 0.112 0.023 0.255 48 Pasture 0–3 18.6 4.0 36.2 41.3 14.2 5.8 3.33 1.08 0.046 0.025 0.209 27 3–6 21.2 4.5 30.0 44.2 11.7 5.3 2.62 1.17 0.055 0.022 0.162 18 10–13 21.5 4.2 30.5 43.8 9.2 5.2 2.22 1.22 0.058 0.023 0.154 18 14–17 22.1 6.4 30.6 40.9 7.9 5.3 2.22 - 0.065 0.023 0.182 35 18–30 23.0 9.2 29.7 38.1 6.2 5.2 2.01 1.21 0.068 0.023 0.183 55 30–40 26.4 4.7 30.2 38.7 - - - 1.22 0.075 0.025 0.164 42 60–80 30.6 6.0 32.1 31.4 3.6 5.0 1.83 1.09 0.084 0.023 0.243 56 90–100 32.8 4.4 29.8 33.0 - - - 1.13 0.088 0.023 0.194 27 ___________________________________________________________________________________________________________________________________________________________________________________ a
PSD is particle size distribution; OC is organic carbon content; CEC is cation-exchange capacity; Db
is bulk density; Vp,A and Dm,A are the volume of pores A and their modal equivalent diameter,
respectively; Vp,B and Dm,B are the volume of pores B and their modal equivalent diameter,
respectively.
Figure 2: Back-scattered electron scanning image (x60, WD = 18 mm, 15 kV) of the 90–100 cm layer under forest (left) and of the 0–3 cm layer under pasture (right). Voids occupied by resin are black, homogeneous grey areas are quartz and heterogeneous dark grey areas are porous clayey phase.
1 mm 1 mm