Early Growth Technology Analysis:
Case Studies in Solar Energy and Geothermal Energy
by
Ayse Kaya Firat
M.Eng.
Texas A&M University, 2006
B.S.
Bogazici University, 2004
MASSACHUSETTS INSTlTUTE OF TECHNOLOGYSEP 2 0 2010
LIBRARIES
ARCHIVES
Submitted to the Engineering Systems Division
in Partial Fulfillment of the Requirements for the Degree of
Master of Science in Technology and Policy
at the
Massachusetts Institute of Technology
September 2010
C 2010 Massachusetts Institute of Technology. All rights reserved.
Signature of author:
Texfinlogy and Policy Program, Engineering Systems Division
August 27, 2010
Certified by:
Stuart Madnick
John Norris Maguire Professor of Information Technology, MIT Sloan School of
Management & Professor of Engineering Systems, MIT School of Engineering
Thesis Supervisor
Accepted by:
Dava J. Newman
Professor of Aeronautics and Astronautics and Engineering Systems
Director, Technology and Policy Program
Early Growth Technology Analysis:
Case Studies in Solar Energy and Geothermal Energy
byAyse Kaya Firat
Submitted to the Engineering Systems Division
on August 27, 2010 in Partial Fulfillment of the Requirements For the Degree of Master of Science in Technology and Policy
at the Massachusetts Institute of Technology
ABSTRACT
Public and private organizations try to forecast the future of technological developments and allocate funds accordingly. Based on our interviews with experts from MIT's Entrepreneurship Center, Sloan School of Management, and IBM, and review of literature, we found out that this important fund allocation process is dominated by reliance on expert opinions, which has important drawbacks alongside its advantages.
In this Thesis, we introduce a data-driven approach, called early growth technology analysis, to technology forecasting that utilizes diverse information sources to analyze the evolution of promising new technologies. Our approach is based on bibliometric analysis, consisting of three key steps: extraction of related keywords from online publication databases, determining the occurrence frequencies of these keywords, and identifying those exhibiting rapid growth. Our proposal goes beyond the theoretical level, and is embodied in software that collects the required inputs from the user through a visual interface, extracts data from web sites on the fly, performs an analysis on the collected data, and displays the results. Compared to earlier software within our group, the new interface offers a much improved user experience in performing the analysis.
Although these methods are applicable to any domain of study, this Thesis presents results from case studies on the fields of solar and geothermal energy. We identified emerging technologies in these specific fields to test the viability of our results. We believe that data-driven approaches, such as the one proposed in this Thesis, will increasingly be used by policy makers to complement, verify, and validate expert opinions in mapping practical goals into basic/applied research areas and coming up with technology investment decisions.
Thesis Supervisor: Stuart Madnick
John Norris Maguire Professor of Information Technology, MIT Sloan School of Management & Professor of Engineering Systems, MIT School of Engineering
ACKNOWLEDGMENTS
I am grateful to my Thesis advisor and a true leader, Prof. Stuart Madnick, for his guidance,
support, and patience as I traveled in the thorny path of scholarship. Prof. Madnick taught me how to ask the right questions, and showed immense understanding and patience during my difficult times. Thanks to Prof. Woon of Masdar Institute for Science and Technology (MIST) from whom I have received salient advice and feedback; and to Skype for making our virtual meetings possible.
The fine staff, faculty, and students of the Technology and Policy Program kept me focused and joyful during my time at MIT. Special thanks to Sydney Miller, and Ed Ballo of TPP. Thanks to my fellow students Blaine Ziegler, and Steven Camina with whom I have been able to talk about my ideas and receive helpful feedback whenever I hit a dead end. I am also thankful to Allen Moulton, Michelle Cole, and Michael Siegel from the COIN Group.
I am grateful to Prof. Howard Anderson, Prof. Bill Aulet, and Satwik Seshasai, who agreed
to interview with me, and occupied a Chapter in my Thesis.
Finally, I would like to acknowledge my inspirational parents Necla and Halil Kaya, amazing siblings Hatice and Mikail Kaya, and my compassionate husband, Aykut Firat, who encouraged me along the entire path, never showed anything but confidence in me, and taught me the most important things I know.
TABLE OF CONTENTS
ABSTRACT ... 3
ACKN OW LED GM EN TS...4
CHAPTER 1: INTRODU CTION ... I 1 1.1 M OTIVATION ... 11
1.2 EARLY GROWTH TECHNOLOGY ANALYSIS ... ... 11
1.3 PURPOSE: IDENTIFY CANDIDATE RESEARCH TOPICS TO CONSIDER ... 11
1.4 RELATION SHIP TO TRAD ITION AL M ETHOD S...12
1.5 CASE STUDIES IN SOLAR AND GEOTHERMAL ENERGY...13
1.6 THESIS STRU CTU RE...13
CHAPTER 2: POLICY M OTIV ATION ... 14
2.1 KURZW EIL AND ISRAEL'S EN ERGY POLICY ... 14
Solar To Rule in the Next 16 Years... 14
A Conversation Changing a Country's Energy Technology Roadmap ... .... 15
2.2 DIFFICULTY OF SETTING RESEARCH AND INVESTMENT PRIORITIES . ... 15
Public Institutions...16
European Commission ... 16
National Science Foundation (NSF)... 16
Private Institutions...16
N o v artis ... 16
IB M ... 1 7 G laxo S m ith K lin e ... 17
Other technology intensive companies... 18
2.3 ANALYSIS AND CRITIQUE OF THE CURRENT APPROACHES IN USE ... 20
CHAPTER 3: LITERATURE REV IEW ... 23
3.1 TECHN OLOGY FORECA STIN G ... 23
3.1.1 Forms of Technology Forecasting and Related Terminology... ... 23
3.1.2 Trend in TF Publications ... 24
3.1.3 TF and Access to Information... 26
3.1.4 TF M ethods...26
E x p ert O p in io n ... 2 7 T ren d A n aly sis ... 2 8 M onitoring and Intelligence M ethods ... 28
Statistical M ethods... 30
M odeling and Simulation... 30
S cen ario s ... 3 1 Valuing/Decision/Economics M ethods... 32
Descriptive and M atrices M ethods...32
3.1.5 How to Evaluate the Quality of TF M ethods? ... 33
Choosing a Forecasting M ethod...34
3 .1 .6 C o n c lu s io n ... 3 5 3.2 M IT/M IST APPROA CH ... 35
CHAPTER 4: EARLY GROWTH TECHNOLOGY ANALYSIS ... 37
4.1 ANALY SIS STEPS ... 37
4.1.1 Collection of Relevant Terms...37
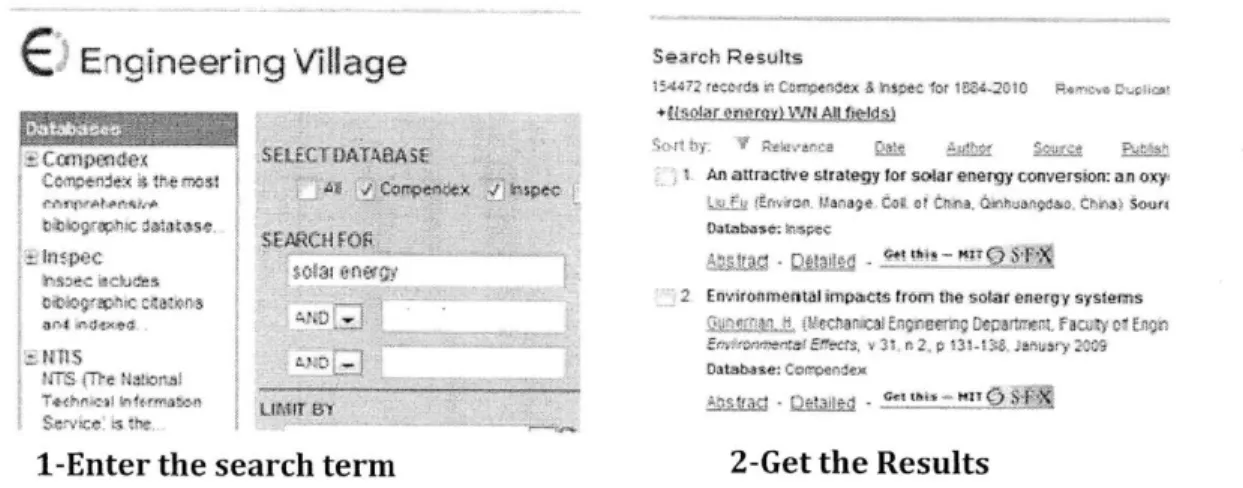
Compendex & Inspec ... 38
S ciru s... 3 9 4.1.2 Collection of H itcounts ... 40
4.1.3 Ranking Terms According To Their H itcounts ... 40
4.2 IM PLEM ENTATION APPROACH ... 41
Black-Box Approach...42
M odular Approach ... 42
Declarative Approach...44
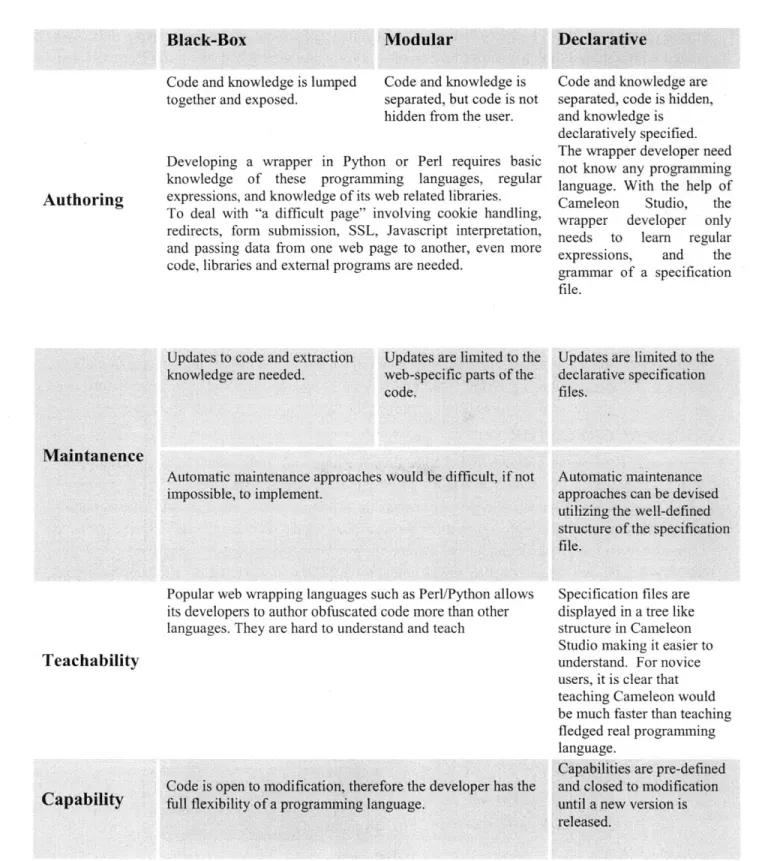
4.2.2 Comparison ... 47
A . A u th o rin g ... 4 7 Authoring wrappers for "difficult pages... 47
V isu al su p p o rt ... 4 7 Special-purpose debugging ... 47
B . M ain ten an ce... 4 8 Object-Oriented Design Principle: Encapsulate what varies... 48
C . T each ab ility ... 4 9 D . C ap ab ility ... 4 9 F lex ib ility ... 4 9 S Q L In terface ... 4 9 E x cel In tegratio n ... 5 0 E rro r H an d lin g ... 5 0 Java Script Interpretation ... 50
S u m m ary ... 5 0 CHAPTER 5: EARLY GROWTH ANALYSIS SOFTWARE TOOLS ... 52
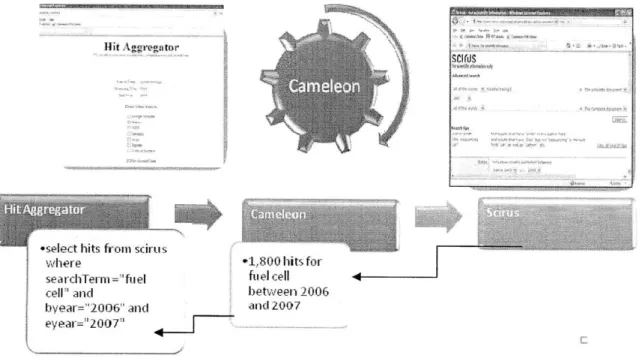
5.1 H IT A G GREGA TOR ... 52
5.2 CAM ELEON SCH EDU LER ... 53
5.2.1 M anaging Tasks... 56
5.2.2 Technical Specifications ... ... 57
5.3 THE EGTA TO OL...58
5.3.1 Software D esign D etails ... 60
5.3.2 Software Implem entation ... 61
Local vs Remote Cameleon Access... 61
Concurrency in W eb Source Access...61
Formulas for Top Term Calculation... 62
Progress Bar in W eb Application ... 62
Adding New Sources...62
CHAPTER 6: SOLAR ENERGY CASE STUDY ... 63
6.1 MANUALLY CREATED EMERGING SOLAR TECHNOLOGIES LIST ... ... 63
6.2 BACKTESTIN G ... 64
6.3 COM PARISON O F SOU RCES...65
6.4 CA SE STU D Y RESU LTS ... 67
6 .4 .1 M e ta ls ... 6 7 6.4.2 Nanotechnology ... 67
6.4.4 Formation of interm ediate band gap ... 68
6 .4 .5 T h in
fi
lm s ... 6 8 6.4.6 General solar energy related terms ... 696.5 CON CLU SION ... 69
CHAPTER 7: GEOTHERMAL CASE STUDY ... 70
7.1 CATEG ORIZA TION OF THE CA SE STU DY RESU LTS ... 70
7.2 BRIEF ANALYSIS OF THE EMERGING TECHNOLOGIES IN GEOTHERMAL ENERGY ... 73
7.3 CON CLU SION ... 75
CH APTER 8: EX PERT IN TERV IEW S ... 76
8.1 INTERV IEW TRAN SCRIPTS ... 76
CH APTER 9: CON CLU SION ... 83
9.1 CON TRIBU TION S ... 83
9.2 FUTU RE W ORK ... 83
APPENDIX 1: INFORMATION ABOUT ONLINE PUBLICATION DATA SOURCES ... 88
APPENDIX 2: HIT AGGREGATOR EXCEL VERSION ... 93
APPENDIX 3- CAMELEON SCHEDULER ... 99
APPENDIX 4 - EGTA TOOL INSTALLATION INSTRUCTIONS ... 100
APPENDIX 5 -CODE FOR THE EARLY GROWTH TECHNOLOGY ANALYSIS TOOL...101
APPENDIX 6 -COMPLETE RANKED TERM LIST FOR SOLAR CASE STUDY ... 150
TABLE OF FIGURES
Figure 1: The process decision makers go through for investment/funding allocation decisions ... 12
Figure 2: The map (left) of commercial attractiveness vs. technical strength for seven therapeutic areas the central nervous system (CNS), inflammatory disorders (INF), cardiorespiratory disorders (RD), metabolic disease (MD), cardiovascular disease (CV), gastrointestinal disease (GI), and anti-infection agents (AI)-was redrawn based on the use of scientometrics (right). GI was then dropped from the R&D program [N orling et al. 2000]...18
Figure 3: Number of hit counts for "Technology Forecasting" OR "Technological Forecasting from Web of Science betw een 1996 and 2009. ... 25
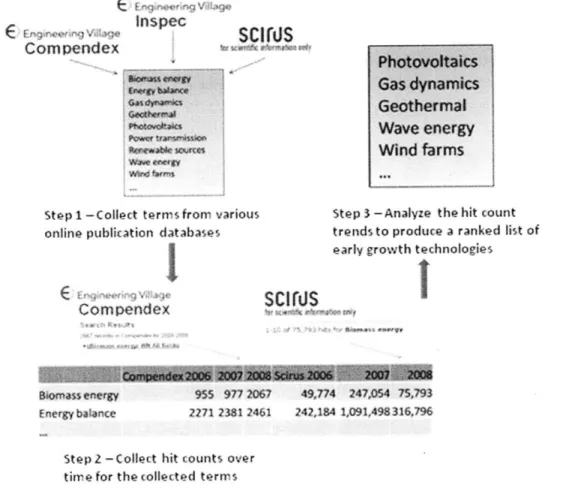
Figure 4: Three keys steps for Early Growth Technology Analysis... ... 37
Figure 5: Term Collection from Compendex & Inspec...38
Figure 6: Term C ollection from Scirus ... 39
Figure 7: Hitcount Collection from Scirus, Compendex & Inspec ... ... 40
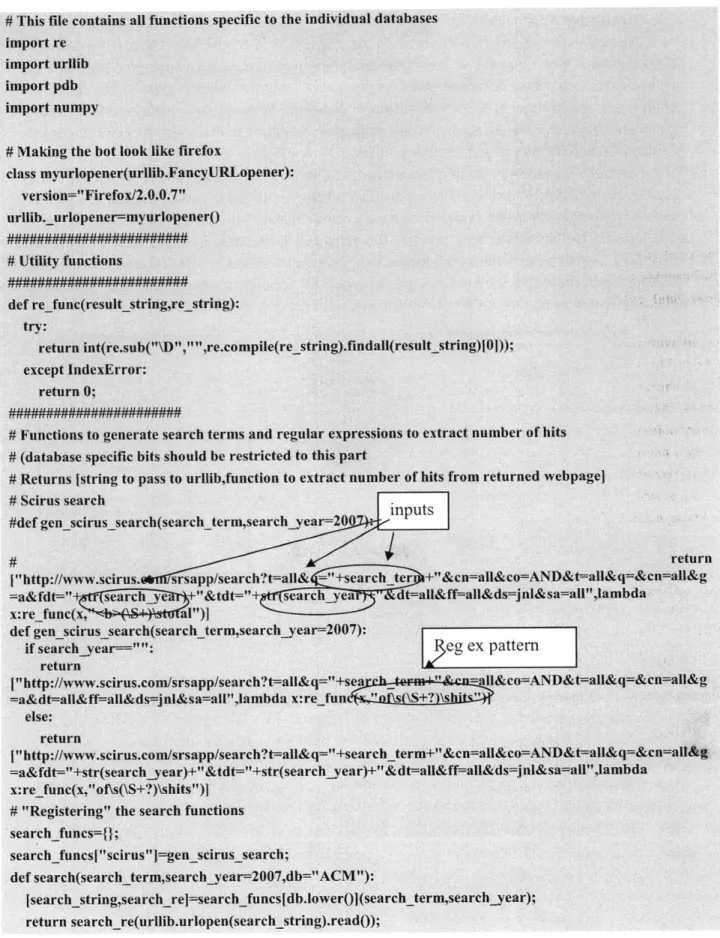
Figure 8: An example wrapper in Python is shown for the Scirus online database...43
Figure 9: Simple SQL query against the wrapped Scirus Search Engine...44
Figure 10: Cameleon# Spec File for Scirus Database ... 45
Figure 11: Hit Aggregator we developed for our technology forecasting project...46
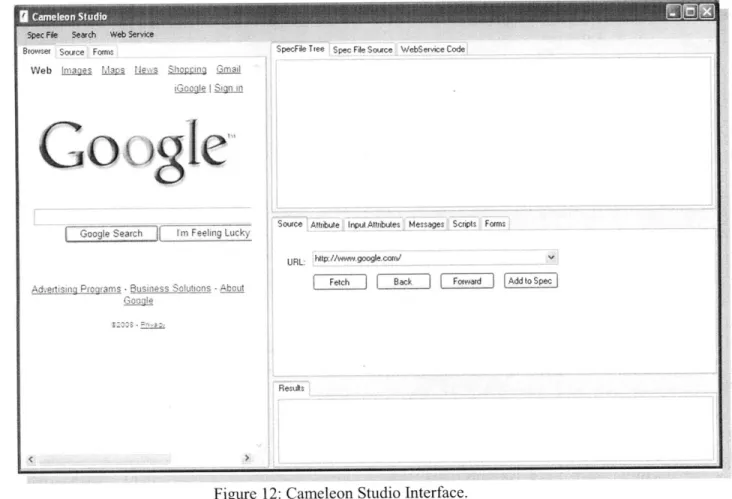
Figure 12: C am eleon Studio Interface...48
F igure 13: H it A ggregator in E xcel...52
Figure 14: H it A ggregator W eb V ersion ... 53
F ig ure 15: L o g in P ag e ... 5 3 Figure 16: Main Cameleon Scheduler Web Interface ... 54
Figure 17: Execution results for the CIA Factbook example ... 56
F igure 18: M anage T asks L ink ... 56
Figure 19: Task M anagem ent Interface... 57
Figure 20: Data model for Cameleon Scheduler ... ... 57
F igure 2 1: E G T A tool w eb version ... 58
Figure 22: EG TA tool desktop version ... 59
Figure 23: T he M V C design pattern -... 60
F igure 24: T he M odel C lasses...6 1 Figure 25: RFID Hitcount Growth between 1996-2009...64
Figure 26: Hit counts for twelve emerging technologies from Google Scholar for the last ten years...66
Figure 27: RFID Popularity/Adoption vs. Time Curve ... ... 77
Figure Al.1: Excel allows users to pull data from Access, Web, Text & other sources. ... 93
Figure Al.2: Importing data into Excel from Yahoo Finance...93
Figure A1.3: Retrieving data that is in tables or preformatted areas... 94
Figure A1.4: A user can also make queries against XML files. ... 94
F igure A 1.5: C am eleon .i y ... 95
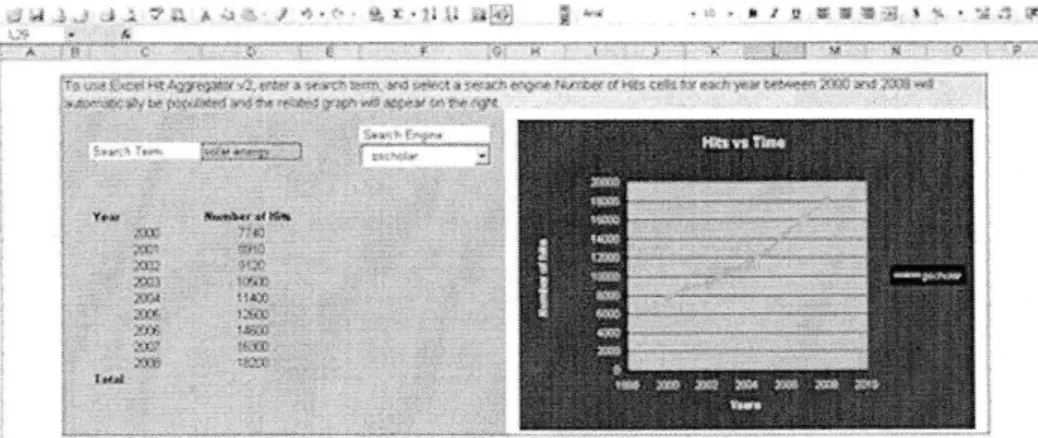
Figure Al.6: Excel Hit Aggregator vl and its query sheet...95
Figure A1.7: Calling Cameleon from Excel ... ... 96
Figure A1.8: Using Form Controls in Excel Developer ... 97
Figure A 1.9: E xcel H it A ggregator v2 ... ... 97
Figure Al.10: Excel Hit Aggregator v2 query sheet ... ... 98
Figure A l.11: Excel H it A ggregator vO ... 98
Figure Al.12: Changing Registry Directory ... ... 98
LIST OF TABLES Table 1: The companies included in "Technology Intelligence Processes in Leading European and North American M ultinationals." study [Lichtenthaler 2004b]... 19
Table 2: Intensity of use of different information sources in the industries studied [Lichtenthaler 2004b].. 19
Table 3: Leading Authoring Organizations by Sector [Porter 2007]...25
Table 4: Leading FTA Journals [Porter 2007] ... 25
Table 5: Forecasting methods for particular situations ... ... ... ... ... 34
Table 6: A summary of the comparison of between black-box, modular, and declarative approaches...51
Table 7: Overlap percentage of results for seed terms "Photovoltaics", "Solar energy", and "Renewable energy" with different term sizes between Compendex, Scirus and Inspec...65
Table 8: Overlap percentage of results from Compendex, Inspec and Scirus for term size 2100 for pairs with similar or same meaning (e.g. Gasoline and Petrol)... 67
CHAPTER 1: INTRODUCTION
1.1 MOTIVATION
Identifying novel technologies that have the potential to generate high commercial returns at an early stage is critical to venture capital firms, entrepreneurs, and policy makers alike. Decision makers and strategy setters have to track current state of research by sifting through volumes of data, and weigh future scenarios by seeking in-depth expert opinions. The Internet is both a friend and foe in this process, as it offers ever-growing amounts of information for richer yet more time-consuming analysis. Clearly, new automated methods are needed to aid decision makers in this challenging process.
1.2 EARLY GROWTH TECHNOLOGY ANALYSIS
In this study, we investigate the efficacy of one such automated method in identifying potentially promising set of technologies in a given area of interest using online databases of scientific publications. We provide a set of software tools that implement this method, and we present two case studies by applying the methodology to the fields of solar and geothermal energy. We evaluate the utility of this automated approach by conducting interviews with subject-area experts and noting their reactions.
We call the method used in this Thesis, Early Growth Technology Analysis (EGTA), since we try to locate technologies that are in the early, low-prevalence phase of their life cycle and are likely to exhibit high growth. With EGTA, we take advantage of the knowledge buried in online
scientific publications to perform bibliometric analysis, consisting of three key steps:
1. Term collection by extracting related keywords from articles for a given area of interest
2. Determining the occurrence frequencies of these keywords (hit counts)
3. Identifying those exhibiting rapid growth, particularly if starting from a low base
Term collection starts with a seed term such as "solar energy" that acts as a proxy for the general technology area of interest. We then utilize online publication databases such as Compendex, Inspec, and Scirus to find terms relevant to this seed term. Some of these online databases are freely available (e.g. Scirus), some require subscription (e.g. Compendex and
Inspec), and yet others require permission for programmatic access (e.g. Google Scholar) (See
Appendix 1 for a detailed description of these sources).
After collecting the related terms from a set of sources, the next step is to find out hit counts of each term over a number of years. For this task, we use the hit counts returned by a set of data
sources, which in our case are the same sources we use for collecting terms. Finally, we narrow
down our original list to a subset of terms that seem to fit the early growth description by ranking
our list using these hit counts.
1.3 PURPOSE: IDENTIFY CANDIDATE RESEARCH TOPICS TO CONSIDER
The top technologies produced by this method are not necessarily "the best" of their kind or "the answer" to a particular question, but merely are interesting emerging directions for decision makers to consider. To be more concrete, our algorithm is not going to help organizations like Masdar or IBM, sponsors of our research, to decide which specific projects to fund, which is Phase 3 of the overall funding process as shown towards the right in Figure 1. Both Masdar and
IBM have their own decision criteria to work on this step such as quality of research, past track record of the researchers/employees, cost-benefit analysis, expert opinions, and fit with organizational goals. Our goal is to help the decision makers in the former step, Phase 2 (see Figure 1, Left), that involves going from a broad area of interest such as energy or photovoltaics to a few possible themes that are believed hold a lot of promise. With the help of EGTA, decision makers will only face a modest list of promising ideas, or in other terms, options to consider. The decision makers may already have their own 'promising ideas' list, and may use our results to add to that list or validate their options. After this initial step, these decision makers may use criteria of their choice to make their final decision.
Phase 1
Phase 2
Phase 3
Options Decision
(Themes) to Criteria
Broad Area of Consider for (Differs from
Interest funding one
e.g.
e-.g
organization toRenewable Renewable B) Dye solar cells Quantum wells another)oante) Phase 4
Energy C) ...
Decisions
(with hundreds of e.g.
thousands of H) ...
articl1s A) and H)
" EGTA Expert Opinion,
.mu m uA . Market Research, etc.
Figure 1: The process decision makers go through for investment/funding allocation decisions
1.4 RELATIONSHIP TO TRADITIONAL METHODS
Our interviews with entrepreneurs and venture capitalists, and the review of literature on technology investments reveal that decision makers widely rely on the subject area experts' predictions in both of the decision steps discussed in Figure 1. The first of these two steps (narrowing down a broad area of interest to a few promising options) requires an in-depth knowledge of the area as well as its relationship with other fields. Although experts in a field could have a detailed understanding of their field, it would be unreasonable to expect them to have exhaustive knowledge of every facet of their field. Emerging technologies, in particular, are unfortunately the ones of which they are most likely unaware. With this project, our main contribution is to help decision makers and experts identify emerging technologies in a field they are interested in; ensure that they do not miss an important development; augment and validate their already established ideas on options to consider for investment and fund allocation.
Apart from this contribution, we also advance the state of data collection within our group with a new set of software tools. Although effective in producing results, earlier software developed in our group by fellow researchers were not initially designed with "user friendliness" or ease of extendibility in mind. The new set of tools, including the Hit Aggregator, Cameleon Scheduler and Early Growth Technology Analysis (EGTA) tool, all have visual interfaces.
Moreover, extending the analysis with new publication databases can be done without any coding. The most significant software, EGTA tool, was built using the Model-View-Controller (MVC) design pattern, which makes further development much easier.
1.5 CASE STUDIES IN SOLAR AND GEOTHERMAL ENERGY
To provide a focus for subsequent discussions and evaluations, we conducted two case studies in solar and geothermal energy by using our set of software tools. These two case studies and our interviews with subject area experts indicate that our proposed approach can be an important decision aid for policy makers.
We believe that data-driven approaches, such as the one proposed in this Thesis, will increasingly be used by policy makers to complement, verify, and validate expert opinions in mapping practical goals into basic/applied research areas and coming up with funding allocation
and technology investment decisions.
1.6 THESIS STRUCTURE
This chapter has presented a brief overview and the objective of our project, along with a brief description of the methods and tools used to achieve these objectives. Chapter 2 explains the policy motivation for the project followed by a Literature Review in Chapter 3, which presents a review of the research and literature in the fields of technology forecasting, and bibliometrics.
Chapter 4, Early Growth Technology Analysis, describes how we extract keywords from online publication search engines, how the associated publication counts are extracted, and how we use these counts to identify fast-growing technologies. It also provides a comparison of the data gathering approaches adopted within our research group, and why we believe the approach presented in this Thesis is superior.
Chapter 5, Tool Development, describes the software tools we created to make our approach more "user friendly" in detail.
Chapter 6 and 7, Solar Energy and Geothermal Energy Case Study Results, presents results of our software to analyze the fields of solar and geothermal energies.
In Chapter 8, we discuss our interviews with subject-area experts and how they view the method we outlined in this Thesis, before concluding in Chapter 9, with a summary of the main findings of the project and areas left for future research.
CHAPTER 2: POLICY MOTIVATION
Technology policy makers widely rely on subject area experts in making their funding allocation decisions. Experts, with their experience and domain knowledge, are invaluable resources in helping decision makers, but even they may not be fully aware of all the promising developments in broad and complex fields of technology. In the fast paced Internet age, it is no longer possible for a human to wake up every morning and read every blog post, news and journal article in their domain of interest and not miss an important development before it becomes a headline. There is an obvious need for a computer to process vast amounts of relevant information out there, and present a summary in human digestible format.
One of our primary goals in this thesis is to create and experiment with an automated data-driven method that helps experts acquire a more complete understanding of their area of expertise. The promise of this goal can be better understood, if the reader is first told how these decisions are currently made in policy circles. We start with an anecdote, and continue with a background on the policy making process in the rest of this chapter.
2.1 KURZWEIL AND ISRAEL'S ENERGY POLICY
I am at "The VC Portfolio in 2030", a panel discussion organized by the MIT Sloan Venture
Capital Club. World-renowned futurist, author, and inventor, Ray Kurzweil, is discussing his controversial views of the immediate future and its dramatic implications to our everyday life and taking questions from two technology investors to determine the best way to deploy capital in a
future that we can't yet imagine.
Kurzweil is an avid proponent of regularity in technological progress, a hard core techno-determinist. According to Kurzweil, the biggest problem today is that people do not recognize this regularity in technological progress enough. But if they did, if they had a sense and vision to recognize the power of technologies, this would eliminate impediments to further development, adoption and diffusion. Not recognizing these changes prevents harvesting the benefits rapidly and adequately.
In today's discussion, Kurzweil talks about investing in renewable energy. He says the field of energy is being transformed by exponential growth, just like information technology (IT) has been for several decades. In IT, most of us are familiar with the Moore's law that describes a long-term trend in the history of computing hardware, in which the number of transistors that can be placed inexpensively on an integrated circuit has doubled approximately every two years. Energy is currently a field dominated by fossil fuels, which is a 19th century technology. Kurzweil's claim on doubling the performance of clean energy technologies every two years, as the semiconductor industry has seen with Moore's Law, seems like a tough goal to hit.
Solar To Rule in the Next 16 Years
Kurzweil mentions a recent study where a panel of experts including Google Co-Founder Larry Page and Kurzweil himself convened by the National Academy of Engineering. The panel investigated all the emerging energy technologies and picked solar as having the most potential because of its applicability to nanotechnology. The reason why solar energy technologies will advance exponentially, Kurzweil says, is because it is an "information technology" (one for which we can measure the information content), and thereby subject to the "Law of Accelerating
Returns". Solar and wind power currently supply about one percent of the world's energy needs, but advances in technology are about to expand with the introduction of nano-engineered materials for solar panels, making them far more efficient, lighter and easier to install.
"We also see an exponential progression in the use of solar energy," he says. "It is doubling now every two years. Doubling every two years means multiplying by 1000 in 20 years. At that rate we'll meet 100 percent of our energy needs in the next 16 years."
A Conversation Changing a Country's Energy Technology Roadmap
Right after these statements, comes the most interesting part of the Kurzweil speech. Kurzweil says he shared his views on solar energy with the Prime Minister of Israel a couple of months ago at the Israeli Presidential Conference. He reports that the Prime Minister said "Well, that's great. Is there enough sun light to double eight more times?" Kurzweil explained to him that there is 10,000 times more sunlight than we need to meet 100 percent of our energy needs: "We could place the efficient solar panels 16 years from now on just a couple percent of the world's unused lands and meet all of the world's energy needs"
Based on their conversation, Kurzweil says, the Prime Minister announced a day later a
10-year-plan harvesting the best scientists and engineers in Israel to completely replace fossil fuels with solar energy not just for Israel but for the world. Kurzweil said he told the Prime Minister afterwards that this was overly optimistic as it is going to take at least 16 years.
As a student of Technology Policy, I am quite surprised by the power and consequences of a single conversation. Even Kurzweil himself confesses that he was surprised. This anecdote is a vivid example of the enormous role expert opinions play in guiding decision makers in public and private organizations.
Next, we explore why policy makers rely so much on unstructured processes by understanding the difficulty of setting research and investment priorities.
2.2 DIFFICULTY OF SETTING RESEARCH AND INVESTMENT PRIORITIES
Policy makers at public and private organizations try to forecast the future of technological developments and are instructed to allocate funds to different areas of research using "practical objectives or goals serving as a motivation" (Government Performance and Results Act, GPRA of
1993). In research and development, however, "practical objectives or goals" can be very
ambiguous. How exactly do these decision makers and organizations, then, go about mapping practical goals into applied research topics?
According to Ken Oye, MIT Professor of Political Science and Engineering Systems, such mapping decisions drive policy makers insane more than anything else. Oye mentions the struggle of Larry McCray, currently at MIT's Program On Emerging Technologies (POET), with such mapping decisions when he was heading the Policy Division of the National Research Council (NRC). As part of his job, McCray was asked to instruct and guide federal activity on shaping research priorities at the NRC. He had to provide objective guidance on the processes through which American research priorities should be set. Larry McCray was bothered because he concluded he did not have much in the way of good guidance to offer to the federal government on how to set research priorities with reference to practical objectives.
The National Science and Technology Council (NSTC) guidance or Government Performance and Results Act (GPRA) of 1993 are all these bits and pieces of regulation that are results oriented. Decision makers look at a program or a broad field and try to see what results
would follow from it to give more money to promising programs or emerging technologies in a broad field.
Companies face a similar challenge like governments. How are corporate decisions, such as investing millions of dollars to a new technology in the field solar energy, being made? Are funding allocation decisions based on "objective, repeatable, and quantifiable" decision parameters? As Jerome C. Glenn, the director of the Millennium Project indicates in his reply to the above-mentioned questions, "Corporations tend not to share that information." Alan Porter, a leading figure in technology forecasting (TF), states that "These decisions are most often based on 'tacit knowledge' without much systematic TF or competitive technical intelligence (CTI) being utilized."
Let us briefly look into some public and private organizations such as European Commission, National Science Foundation, IBM and Novartis to understand how they set their research and investment priorities.
Public Institutions European Commission
The European Commission determines research priorities by sending a questionnaire to a panel of about 1300 experts in all countries of the enlarged Europe. These experts represent the totality of European countries and the science and technology fields. Two thirds of the experts interviewed are from public research while the remaining one third comes from the private sector. Most of the participants are high level experts and more than two thirds of the experts interviewed are directors / heads of department in their organization [European Commission 2006].
European commission faces several difficulties in this process. The directors in the participating organizations might have prior interests and be inclined to advancing the technologies they are interested in. Timelines projected by directors may be very different from what the people working underneath the director are thinking. Furthermore, the composition of experts because of country quota reasons may diminish the quality of the panel.
National Science Foundation (NSF)
NSF apportions its funds by creating panels of reviewers. What follows is a description of
going from Phase 3 to Phase 4 mentioned earlier in Figure 1. We believe, based on informal talks,
NSF uses a similar procedure in going from Phase 1 to Phase 2 of the funding process.
First, fund seekers complete proposals and send them back to NSF. NSF creates a panel from a list of reviewer applicants to assess the proposals. To understand the potential difficulties of this process, we need to look at the composition of expert reviewers in these panels. Are people that seek out the reviewing positions necessarily the people that are most oriented towards the latest advances? The ones who volunteer might have prior interests, and be inclined to interpret knowledge to make projections and evaluate risks to benefit themselves. Consequently, claims of interpretative authority may influence fund allocation decisions possibly in a non-optimal way when there is no data-driven mechanism to substantiate expert claims [National Science Foundation 2010].
Private Institutions Novartis
Novartis' approach to setting research priorities and investments at the corporate level is a good example of the strong trend in systematic technology intelligence (TI) undertaken in many technology-intensive large companies [Lichtenthaler 2004a], [Lichtenthaler 2004b]. Novartis
uses 180 globally distributed participants, including specialist teams, informal discussion groups and several fulltime technology intelligence specialists, to communicate during the year via intranet, where new trends are discussed. Furthermore, three to four times a year they meet physically in order to integrate the information gathered into a holistic and shared picture and in order to create an atmosphere of trust with their colleagues. This process somewhat resembles IBM's Horizon Watch.
IBM
HorizonWatchl is an internal IBM 'Grass-Roots' community that has been in place for over nine years. HorizonWatch Community was started to provide executive, strategy, and marketing teams with an early warning identification system of new, emerging opportunities, threats and trends in the marketplace. The community has over 1800 members from all types of functions, all divisions, and all geographies in IBM. Within IBM, and HorizonWatch, there are also employees whose full time job is to research, analyze, and write about emerging topics that will have an impact on IBM's ability to grow.
HorizonWatch community members are interested in learning, and collaborating on emerging business issues, trends and technologies. They meet via conference calls. Topics are presented to the community by subject matter experts. In between conference calls, they collaborate via the HorizonWatch blog, which is open to IBM employees only. The community has evolved into a collaborative network of people who are interested in hearing about and discussing emerging technology topics.
GlaxoSmithKline
GlaxoSmithKline faced the research priority and investment setting problem immediately after the merger of SmithKline & French with Beecham (1990) [Norling et al. 2000]. The new corporate senior management faced the challenge of reallocating the combined $1 billion R&D budget.
After the merger, a team from R&D and central marketing was assembled to look at the company's existing portfolio of therapeutic area research. The goal was to assess the viability of each research area and to explore new areas of unmet medical conditions or needs that could be profitably explored. A consulting firm, which had also been called upon, proposed locating the various therapeutic areas within a typical positional map of commercial attractiveness vs. technical feasibility or strength (see Figure 2, left). The firm was unwilling to recommend the discontinuation of work in any one of the therapeutic areas.
The head of R&D, however, was not satisfied, and asked the small, four-person intelligence group in the R&D section to look at another tool to guide the company in refocusing its R&D resources. That led to the application of scientometrics2 or science mapping, a technique of using computer algorithms to identify connection patterns within the recently published scientific literature.Based on these patterns, a structural map of the scientific community can be created, showing the interrelationships between disciplines and the distribution of research communities.
'http://horizonwatching.typepad.com/horizonwatching/2007/04/thehorizonwatc.html
2 Scientometrics is concerned with the quantitative features and characteristics of science. Emphasis is
placed on investigations in which the development and mechanism of science are studied by statistical mathematical methods. In practice, as in the SmithKline Beecham case, scientometrics is often done by measurement of (scientific) publications using bibliometrics. For purposes of this report, scientometrics and bibliometrics are used interchangeably.
A scientometric or knowledge map can identify the structure of a particular area of scientific
research and measure its performance: How "hot" is this research area? How quickly are new discoveries being made? Is the field growing, or imploding upon itself? Maps can be drawn for each level in the hierarchy and color-coded according to performance measures.
SmithKline Beecham used this technique as one element in the redirection of its R&D resources. After generating scientometric maps of the seven research-based universes (or therapeutic areas) in which the merged company was active, they concluded that the field of gastrointestinal disease research in particular was not generating a significant amount of high-performance research. The positional map was redrawn (Figure 2, right). The company decided to close its research activities in this area, and to focus on research in the remaining six: the central nervous system, inflammatory disorders, cardiorespiratory disorders, metabolic disease, cardiovascular disease and anti-infection agents. The company then turned its attention to research platform (technology) areas, identifying networks of research communities common to the seven therapeutic areas. One such network constituted a technology universe working in the broad area of genomics, an interesting but uncertain field in the early 1990s.
Through scientometrics, it identified several university groups and small companies that were conducting high-momentum research in the genomics area. Further investigation of these high-momentum groups led to the first genomics agreement in the industry between SmithKline Beecham and Human Genome Sciences. Scientometrics also helped SmithKline Beecham to locate a multimillion-dollar research facility focusing on the central nervous system. Maps showed that centers of excellence in CNS research were located on the east and west coasts of the
U.S. and in France, which was where the company ultimately built one of its research satellites.
In short, scientometric technology gave the company an important intelligence perspective that enabled it to reshape its research portfolio for greater productivity, and to define a number of promising technology opportunities.
Expert Opinion
Knowledge Mapping
KINF - C Al /( G ap (R Al R o I) N(MD~/ Strength
-Strength-Figure 2: The map (left) of commercial attractiveness vs. technical strength for seven therapeutic areas - the central nervous system (CNS), inflammatory disorders (INF), cardiorespiratory disorders (RD), metabolic disease (MD), cardiovascular disease (CV), gastrointestinal disease
(GI), and anti-infection agents (AI)-was redrawn based on the use of scientometrics (right). GI
was then dropped from the R&D program [Norling et al. 2000].
Other technology intensive companies
In a recent study by [Lichtenthaler 2004b], a total of 147 interviews were performed, in 26
specialists of the technology intelligence units and the technology acquisition intelligence units, as well as customers of these intelligence units from top management including in each case: the head of research or the chief technology officer, a member of middle management and a few individual researchers. Companies from the pharmaceutical, telecommunication equipment and automotive/machinery industries were examined with the goal of exploring industry differences in the management of technology intelligence processes.
Pharmaceuticals Telecommunications equipment Automobile Machinery Total Europe Novartis
Roche Bayer Zeneca
Boehringer Ingelheim Hoechst Marion Roussel
USA Pfizer Merck Glaxo Wellcome* SmithKline Beecham DuPont Nokia Ascom Siemens Swisscom Philipps Lucent Tcehnologies Nortel Networks Cisco Sulzer DaimlerChrysler Hilti Schindler Landis & Gyr Bosch Ford
Total 11 8 7 26
Table 1: The companies included in "Technology Intelligence Processes in Leading European and North American Multinationals." study [Lichtenthaler 2004b]
According to this study, the selection of the TF methods in a company were influenced by the objective of individual or organizational learning sought, time horizon of planning, and industry. Table 2 shows the intensity of different information source use in the industries studied.
Publication frequency analyses Publication citation analyses
Quantitative conference analyses Patent frequency analyses Patent citation analyses S-curve analyses Benchmarking studies Portfolios
Delphi studies Expert panels
Flexible expert interviews Technology roadmaps Product technology roadmaps Product roadnaps
Experience curves Simulations
Option pricing models Scenario analyses Lead user analyses
Quality function deployment
. . . =often used * . =someimes. us.ed
Pharmaceuticals 0 0 ...... e 00 e0a e*e *0 a * ae *sed Electronics * * S.. S.. * + *0* e 0*0 0 0 Auto Machinery * *0 * C* 0 * CO 00 * CC not uscd
Table 2: Intensity of use of different information sources in the industries studied [Lichtenthaler 2004b].
Take the science-driven pharmaceutical industry as an example. Starting from fixed customer needs, which can be determined in the form of long-term epidemiological studies, the scientific environment is scanned for most promising innovations. New scientific research results
are often of high competitive relevance and are immediately used. Publication citation analyses are therefore quite important in the pharmaceutical industry.
Many pharmaceutical companies combine publication citation analyses with an iterative marketing process of ideal product identification.. As the projects move forward in the product pipeline, techno-economic, time and competitive aspects especially start to dominate assessments. Quantitative assessments are increasingly used. Pharmaceutical companies try to handle the technological uncertainty and the high failure rate of R&D projects by using options pricing methods. The large R&D budgets and the rising pressure to increase effectiveness in the selection of R&D projects are the root cause of the use of expensive and complex methods, such as simulations and publication citation analyses.
On the other hand, the telecommunications equipment industry is a market-driven industry. Technological progress and market development are closely coupled. This is reflected by the importance of lead user analyses, technology product roadmaps and scenario analyses. The integrated technology and market planning is seen as necessary because of the high rate of technological and market change. In the automotive industry in contrast, there is a slow rate of technological and market change.
In the telecommunications equipment industry, normally several technologies compete to become a standard and often imply different markets. At the same time, these technologies are only unstable dominant designs, which are substituted after a comparably short time. Besides the identification of innovation impulses from science, monitoring of the changing techno-economic importance in order to select the right technology and the right time to invest in a technology is of great importance. The importance of the monitoring of the techno-economic changes is mirrored
by the intensive use of quantitative monitoring of conferences, experience curves and patent
frequency analyses. Publication citation analyses and patent citation analyses are not used because scientific advances often take many years to become competitively relevant and the rate of change is too fast.
The automobile and machinery industries are more mature and less dynamic industries than the pharmaceutical and telecommunications equipment industries. Technological as well as market uncertainty are comparably low. The main focus is on the integration of customer needs in products and incremental innovations. Radical innovations are mainly triggered by the regulatory environment. Very often, therefore, scenario analyses, quality function deployment and lead user analyses are used. Changes in the scientific environment are perceived to be of less competitive importance compared to the telecommunications equipment and pharmaceutical industries. Patent citation analyses are mainly used to scan for new technologies.
2.3 ANALYSIS AND CRITIQUE OF THE CURRENT APPROACHES IN USE
Although there are advanced data driven approaches undertaken especially in the private industry to determine research priorities and investment decisions, our interviews with subject-matter experts reveal that entrepreneurs angl investment makers often employ similar approaches to organizations like European Commission, IBM and Novartis. When making investment decisions, they tend to rely on a small number of data sources, experts and friends. As discussed before, an expert may not be fully aware of all the promising developments in broad and complex
fields of technology. It is hard to imagine an expert who can remain up to date in all relevant areas, process all the information out there and ensure not to miss an important development.
Furthermore, such decisions are prone to confirmation bias. Confirmation bias (also called confirmatory bias) is a tendency for people to favor information that confirms their preconceptions or hypotheses, independent of their truth. This results in people selectively collecting new evidence, interpreting evidence in a biased way, or selectively recalling information from memory. Instead of investigating in a neutral, scientific way, people tend to test hypotheses in a one-sided way, focusing on one possibility and neglecting alternatives. Wishful thinking and information processing limitations also contribute to the overall issue. Confirmation bias and overconfidence in personal beliefs strengthen beliefs in the face of contrary evidence, and can lead to disastrous decisions, especially in organizational, military and political contexts.
In policy making, we even have critiques who question the good will of experts and thus, the validity of expert opinions. Techno-constructivism is a school of thought composed of techno-constructivists exemplified by Paul Rabinow of University of California, Berkeley, an extremely distinguished anthropologist who has studied with the famous post-modernist critic, Michel Foucault. Rabinow sees these debates on technological forecasting, and efforts on prioritization of research and cost benefit analyzes as fundamentally corrupt. He argues that the claims of expertise are often amplified, exaggerated, and manipulated to claim power in debates [Rabinow 2004].
Availability of data is also an important factor in technological forecasting. Levary and Han [Levary and Han 1995] argues that given a small amount of low or medium validity data, and no similarity between proposed technology and existing technologies, a reasonable choice is a method based on information obtained from a panel of experts (i.e., Delphi method or interviews). Given a moderate to large amount of medium to high validity data and a high degree of similarity between proposed technology and existing technologies, they propose using correlation analysis. When there is medium or large amount of high validity data, trend analysis is the most appropriate method. Yet, in practice, independent of these factors, expert opinion affects funding allocation decisions more than any other method.
Time horizon is also a critical factor in how organizations go about setting research priorities and funding allocation. According to [Lichtenthaler 2004b], the longer the time horizons, the more the studied companies try not to forecast the development of a technology as precisely as possible, but rather tend to determine a commonly shared and supported, partly normative future, starting from an intensive analysis of the environment.
Organizational attempts to base funding allocation decisions on "objective, repeatable, and quantifiable" decision parameters are usually unsuccessful. In a 2001 study, [Reger 2001] made interviews in 25 multinational companies. More than half the firms investigated emphasized that
3
Fifteen of the companies interviewed were in the fields of computers, electronics, energy, or aviation, and four companies in the automobile industry. The telecommunication/network operators sector was represented by four companies and the chemical industry by three. Sixteen of the corporations in the survey have their headquarters in Western Europe, five in Japan and five in the United States. The following persons were interviewed within the companies:- The head of technology foresight, or those responsible for technology foresight processes, - Heads of the technology planning/technology strategy group or department,
technology intelligence is an unstructured and unsystematic process - which illustrates the opportunity for improvement.
Our goal with this thesis is not to reshape the process of setting research priorities and investment decisions, but to offer a method that complements an expert's ability to predict the future of technological developments. With the tools we developed, experts will acquire a more complete and up to date understanding of their area of expertise. Our data-driven tools will help decision makers and experts identify emerging technologies in a field they are interested in, and ensure that they do not miss an important development in its early stage.
- Customers' such as, e. g. the head of an R&D/technology centre or the head of corporate research, the
head of technology development in a business field or a member of a strategic committee.
Most interviews were conducted with senior managers responsible for the technology foresight process or for corporate R&D/technology strategy. All companies interviewed described their competitive environment as highly dynamic. The budget for research and development (R&D) in the interviewed firms was between 80 million and 4. 5 billion Euro.
CHAPTER 3: LITERATURE REVIEW
Our research is part of the "Technology Forecasting using Data Mining and Semantics" (TFDMS) [Woon & Madnick 2008(2] project undertaken collaboratively by Massachusetts Institute of Technology (MIT) and Masdar Institute of Science and Technology (MIST). The methods we use in our research are derived from the field of technology forecasting (TF) and data mining, also known as tech mining. We, thus, first provide a review of the literature surrounding the field of technology forecasting in this chapter.
3.1 TECHNOLOGY FORECASTING
TF, in general, applies to all purposeful and systematic attempts to anticipate and understand the potential direction, rate, characteristics, and effects of technological change. It especially focuses on invention, innovation, adoption, and use of technology. One imperfect yet useful analogy for TF is weather forecasting: TF enables better plans and decisions. A good forecast can help maximize gain and minimize loss from future conditions. Additionally, TF is no more avoidable than weather forecasting. All people implicitly forecast the weather, for example, by choosing to wear a raincoat, or carry an umbrella. Any individual, organization, or nation that can
be affected by technological change, inevitably engages in forecasting technology, explicitly or
implicitly, with every decision that allocates resources to particular purposes.
Ability to forecast emerging technologies inform critical choices at organizations of all sizes, from large multinational unions, such as the European Union, to small start-up companies. Large organizations need TF to:
" Prioritize R&D,
" Plan new product development,
" Make strategic decisions on technology licensing, joint ventures, and so forth.
Small organizations depend on technological innovation for their existence. In these companies, TF methods are used to forecast adoption or diffusion of innovations, where parameters such as rate of imitation by other adopters or rate of response to advertising can be measured. TF studies in companies are often called Competitive Technological Intelligence (CTI or TI).
In addition to mapping out commercially viable roadmaps for technological development, the TF field includes more social and diffuse measurements as well. For example, governments use national foresight studies to assess the course and impact of technological change for the purposes of effecting public policy. This includes what is known as technology assessment (TA) or social impact analysis, which examines the likely long-term effects of technological development as its impact spreads throughout society.
Furthermore, technology foresight studies are used as an awareness-raising tool, alerting industrialists to opportunities emerging in science and technology, and alerting researchers to the social or commercial significance and potential of their work [Coates et al. 2001].
3.1.1 Forms of Technology Forecasting and Related Terminology
There are many overlapping forms of forecasting technological developments, such as technology intelligence, forecasting, roadmapping, assessment, and foresight. There has been little systematic attention to the conceptual development of the field as a whole. Since 2003, the Technology Futures Analysis Methods Working Group (TFAMWG) has sought to lay a
framework from which to advance the processes and the methods. They combined different forms of technology forecasting studies under the term technology futures analysis (TFA) and classified different forms as follows [TFAMWG 2004]:
* Gathering and interpreting information: Technology monitoring, technology watch,
technology alerts.
" Converting that information into actionable intelligence: Technical intelligence and
competitive intelligence.
* Anticipating the direction and pace of changes: Technology forecasting.
" Relating anticipated advances in technologies and products to generate plans:
Technology roadmapping.
* Anticipating the unintended, indirect, and delayed effects of technological changes:
Technology assessment, and forms of impact assessment, including strategic environmental assessment.
e Effecting development strategy, often involving participatory mechanisms:
Technology foresight, also national and regional foresight.
Many of these forms of forecasting use similar tools to accomplish similar ends. But there is a general tendency in government to use phrases that separate thought from action, such as "assessment" and "foresight," while in industry there is a tendency to use phrases that link thought and action, such as "roadmapping" and "competitive technological intelligence." There are cross-national differences as well, propelled by the differences of societal expectations from markets and governments. Industrial roadmapping, a largely private sector led initiative, originated and became prevalent in the United States, while foresight, a government sponsored activity, became the preferred alternative in Europe. These forms of forecasting-national technology foresight, roadmapping, and competitive technological intelligence-came into prominence at different times, and with relatively little effort to clarify their similarities and differences.
TF usually focuses on specific technologies, but sometimes the scope is more encompassing.
A firm might roadmap a set of related technologies and products; an industry association might
roadmap the gamut of emerging technologies potentially affecting its sector; or a nation could roadmap technologies across its economic base. For example, a U.S. semiconductor industry association roadmap, regularly updated to support industry planning, had as its early objective as regaining global market share in semiconductors. If semiconductor technologies were addressed in a national foresight study, the scope might also include the needs and capabilities of the relevant sciences at the input end, and the possible societal costs and benefits at the outcome end.
Methodologically, both national foresight studies and roadmapping usually bring together people representing different expertise and interests, and use instruments and procedures that allow participants to simultaneously adopt a micro view of their own disciplines and a systems view of overriding or shared objectives [TFAMWG 2004].
In this thesis, we use TF in its broadest sense covering all of the activities mentioned in the framework mentioned above.
3.1.2 Trend in TF Publications
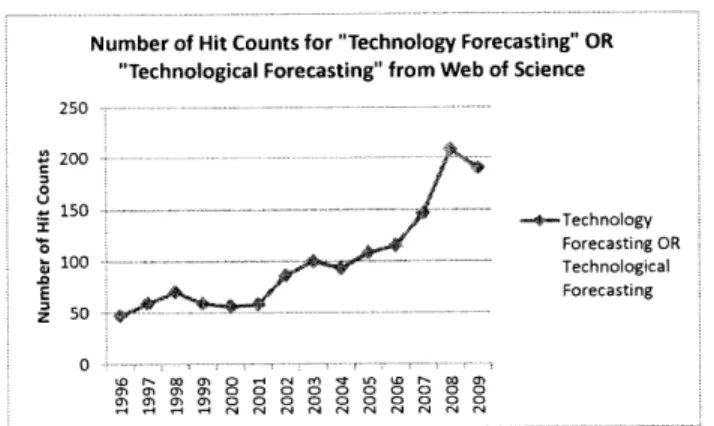
How much TF research publication is out there? Figure 3 shows the results of querying Web of Science for "Technological forecasting" or "Technology forecasting". The activity seems encouraging for TF.
Number of Hit Counts for "Technology Forecasting" OR "Technological Forecasting" from Web of Science 250 200 0 -+-Technology 0 Forecasting OR Technological E Forecasting 0 -- - -LDr 0 Q. oL~n Mc '4 k r- 00 a) (n O 0)OC 0 0 0 0 0 0 0 0 0 0 Mca sc 0 0 0 0 0 0 0 0 0 0
Figure 3: Number of hit counts for "Technology Forecasting" OR "Technological Forecasting from Web of Science between 1996 and 2009.
In 2006, Alan Porter prepared a literature profile of the TF domain helping to characterize the growing body of knowledge [Zhu and Porter 2002], [Porter 2007]. This study shows that the number of scholarly articles relating to TF is increasing. The study also examines the sectoral mix of institutions involved in TF as shown in Table 3 below. Note that the second grouping consolidates several difficult to distinguish types - governmental and non-governmental organizations, and other such institutes. Not surprisingly, publication of TF articles is strongly led
by the academic community--which has the greatest stake in such publication-- but the substantial
participation by government and industry is also notable.
Type # of Articles # of Authorships % of Articles
Academic 567 779 58%
Gov't/NGO's/Institutes 174 210 18%
Industry 109 142 11%
Other 128 - 13%
Table 3: Leading Authoring Organizations by Sector [Porter 2007]
Where is TF work being published? Alan Porter's study lists 11 journals with 10 or more publications, where "Technological Forecasting & Social Change" is the leader, amidst strong representation from leading technology management journals (Table 4). The "Journal of Cleaner Production" focuses on sustainable development, while "Solid State Technology" shows a number of technology roadmapping articles.
Leading FTA Journals (# of Articles)
Technological Forecasting & Social Change (114)
International Journal of Technology Management (52) Futures (49)
Research--Technology Management (26)
Abstracts of Papers, American Chemical Society (14) Technovation (13)
Journal of Cleaner Production (12) Journal of Forecasting (12) R & D Management (11) Solid State Technology (11)
Technology Analysis & Strategic Management (11)
3.1.3 TF and Access to Information
Forecasters have long had complex algorithmic approaches at their disposal, but their ability to effectively execute those approaches has been limited by the availability of information and costs of manual information manipulation and analysis.
A defining characteristic of the Internet age has been the tremendously enhanced access to
information. This offers particular promise to improve TF. There are many web sites that provide useful information, including projects, research opportunities, publications, citations, and patents.
Worldwide research and development activity results in explosive growth in the amount of scientific and engineering literature. For instance, Science Citation Index contains almost 15 million abstracts of journal and conference papers published since 1987. US, Japanese, and European patents are searchable online [Zhu & Porter 2002]. More importantly, many organizations license diverse R&D databases for unlimited searching, e.g., universities for their students and faculty.
3.1.4 TF Methods
There are hundreds of TF Methods, which can be fit into 9 families [Coates et al. 2001], [Gordon and Glenn 2003] as follows (areas marked with * show where our research fits in):
1) Expert Opinion
* Delphi [iterative survey]
* Focus Groups [panels, workshops] * Interviews
e Participatory Techniques 2) Trend Analysis
* Trend Extrapolation [Growth Curve Fitting]* * Trend Impact Analysis
* Precursor Analysis
e Long Wave Analysis
3) Monitoring and Intelligence Methods
e Monitoring [environmental scanning, technology watch]
e Bibliometrics [research profiling; patent analysis, text mining]*
4) Statistical Methods
* Correlation Analysis
e Demographics
e Cross Impact Analysis e Risk Analysis
* Bibliometrics [research profiling; patent analysis, text mining]*
5) Modeling and Simulation
* Agent Modeling
e Cross Impact Analysis
e Sustainability Analysis [life cycle analysis] e Causal Models
* Diffusion Modeling
e Complex Adaptive System Modeling (CAS) [Chaos] * Systems Simulation [System Dynamics, KSIM]