HAL Id: hal-01353305
https://hal.archives-ouvertes.fr/hal-01353305
Submitted on 11 Aug 2016HAL is a multi-disciplinary open access archive for the deposit and dissemination of sci-entific research documents, whether they are pub-lished or not. The documents may come from teaching and research institutions in France or abroad, or from public or private research centers.
L’archive ouverte pluridisciplinaire HAL, est destinée au dépôt et à la diffusion de documents scientifiques de niveau recherche, publiés ou non, émanant des établissements d’enseignement et de recherche français ou étrangers, des laboratoires publics ou privés.
Molecular dynamics simulations of ternary PtxPdyAuz
fuel cell nanocatalyst growth
Pascal Brault, Christophe Coutanceau, Paul Jennings, Tejs Vegge, Johannes
Berndt, Amaël Caillard, Steve Baranton, Styven Lankiang
To cite this version:
Pascal Brault, Christophe Coutanceau, Paul Jennings, Tejs Vegge, Johannes Berndt, et al.. Molecular dynamics simulations of ternary PtxPdyAuz fuel cell nanocatalyst growth. International Journal of Hydrogen Energy, Elsevier, 2016, 41 (47), pp.22589-22597. �10.1016/j.ijhydene.2016.08.035�. �hal-01353305�
Molecular dynamics simulations of ternary PtxPdyAuz fuel cell nanocatalyst growth
P. Brault1,*, C. Coutanceau2, P. C. Jennings3, T. Vegge3, J. Berndt1, A. Caillard1, S. Baranton2,
S. Lankiang2
1
GREMI, UMR 7344, CNRs-Université d’Orléans, BP6744, 45067 Orléans cedex 2, France
2
Université de Poitiers, IC2MP, Equipe « Catalyse et Milieux Non-Conventionnels »,4 rue Michel Brunet, B37, TSA 51106, 86073 Poitiers cedex 9, France
3
Technical University of Denmark, Department of Energy Conversion and Storage, DK-2800 Kgs. Lyngby
(*) Corresponding author: pascal.brault@univ-orleans.fr
Abstract: Molecular dynamics simulation of PEMFC cathodes based on ternary Pt70Pd15Au15
and Pt50Pd25Au25 nanocatalysts dispersed on carbon indicate systematic Au segregation from
the particle bulk to the surface, leading to an Au layer coating the cluster surface and to the spontaneous formation of a Pt@Pd@Au core-shell structure. For Au content below 25at%, surface PtxPdy active sites are available for efficient oxygen reduction reaction, in agreement
with DFT calculations and experimental data. Simulations of direct core@shell system prepared in conditions mimicking those of plasma sputtering deposition pointed out an increase of the number of accessible PtxPdy surface active sites. Core-shell nanocatalyst
morphology changes occur due to impinging Pt kinetic energy confinement and dissipation.
Keywords: Molecular dynamics simulations; ternary nanocatalyst; PEMFC; fuel cell electrode; core-shell; alloy
1. Introduction
Improving design and/or reducing noble metal content in electrocatalysts for fuel cell
electrodes while maintaining and/or increasing proton exchange membrane fuel cell (PEMFC) performance in terms of durability and power density are crucial challenges for PEMFC mass market applications [1-4]. A possible way consists in combining noble metals (Pt, Pd, Au ...) [5-11] and non-noble metals for preparing binary and ternary nanocatalysts. While non-noble metals are interesting from a cost reduction point of view, they may lead to reduced stability compared to pure platinum due to their dissolution capability [12-17]. PtxPd1-x. binary
catalysts have been proposed as possible candidates for both PEMFC electrodes, the anode for the hydrogen oxidation reaction and the cathode for improved oxygen reduction reaction (ORR) compared with pure platinum [18-22]. At the same time, Au addition was proposed to improve durability of the nanocatalysts [23-27]. On the other hand, the atomic structure and morphology [28] also play very important roles in the electrocatalytic efficiency for ORR. Beside experimental investigations, molecular simulations in conditions matching
experiments are also of particular interest [4, 29]. While density functional theory (DFT) simulations are able to predict both structure and composition of nanocatalysts leading to higher ORR efficiency, molecular dynamics (MD) simulations are able to predict their growth mode and the final possible structure when simulations are carried out with initial conditions consistent with experimental ones [30, 31]. This is of interest for comparing structure
predictions and consistency with ORR efficiency and cyclic voltammetry results. The present work is devoted to MD simulations applied to the synthesis of PtPdAu ternary catalysts by both a wet chemical method at room temperature and a plasma sputtering co-deposition, based on the availability of recent detailed experimental [32] and DFT results [27].
Molecular dynamics simulation is a simple way to calculate at every times the trajectory of an ensemble of atoms subjected to forces, by solving the Newton equations of motion [33-37]. Growth of ternary catalysts is a typical situation, where MD simulations can be called for [32]. The required input parameters are only a relevant choice of initial conditions, especially the velocities that should be selected from velocity distributions as close as possible to those of experimental context studied.
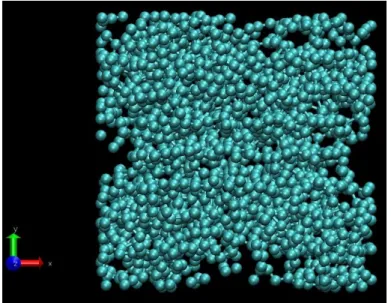
In the present study, Pt, Pd and Au atoms are deposited on a model porous carbon issued from microscopy analysis [38], and thus expected to closely match carbon morphology of a
PEMFC active layer. The dimensions of the model porous carbon substrate are 6 × 6 × 6 nm3,
containing 17,040 atoms, corresponding to a density of 1.57 g cm−3 and to a porosity of 48%.
A picture of this substrate is shown in Figure 1.
Figure 1. Snapshot of the model porous carbon substrate.
Periodic boundaries are applied in the lateral directions, thus exposing the top of the structure as a free surface. 10,000 metal atoms are thrown toward the carbon substrate every delay time of 4 ps. The final simulated loading roughly corresponds to an experimental 10 µg cm-2
catalyst loading. The time step for integrating the equation of motion is 1 fs. The initial position of the atoms is 8Å above the substrate and with randomly chosen {x,y} coordinates.
The elemental type is randomly selected between Pt, Pd, Au before each atom injection, mimicking random deposition of elements, one after the other. Pt, Pd, Au atoms interact with one another and with the atoms of the nanostructured carbon substrate atoms within a cut-off distance of 8 Å. The initial velocities of the incoming Pt, Pd, Au atoms are sampled from a Maxwell-Boltzmann distribution with mean kinetic energies <EPt> = 3.20 eV, <EPd> = 3.15
eV and <EAu> = 2.62 eV as most probable values in the case of plasma sputtering, and mean
kinetic energies <EPt> = <EPd> = <EAu> = 0.026 eV as most probable values for chemical
synthesis at room temperature (or for high pressure plasma sputtering). The temperature of the substrate in all simulations is assumed to be 300 K. The substrate temperature is controlled by applying a Berendsen heat bath, employing a relaxation time of 1 ps. This allow the system to relax in a realistic way between two successive atom depositions. The carbon–carbon
interactions in the substrate are modeled by a Tersoff potential [31, 39]. The noble metal interactions are treated by the Embedded Atom Method (EAM) potential [30, 31, 40, 41]. Such many-body potentials have been validated in conditions of sputtering deposition [40, 42,43]. The metal–carbon interactions are estimated using a 12–6 Lennard–Jones (LJ) potential [44]. The simulations are carried out using LAMMPS software [37,45].
3. Results and discussion
3.1 MD simulations for a chemical synthesis at room temperature of Pt50Pd25Au25 and
Pt70Pd15Au15.
Previous experimental results [32] and DFT calculations [27] have proven that Pt50Pd25Au25
and Pt70Pd15Au15 lead to improved catalytic activity towards ORR and that gold could be
responsible for improved catalyst stability. The choice for gold content below 25% was dictated by the necessity to obtain a good compromise between catalytic activity and stability, due to gold segregation to nanocatalyst surface [27, 32]. Similar trends in chemical ordering were revealed when more comprehensive searches were performed, utilizing genetic
algorithms to elucidate stable structures of PtAu and PtPdAu nanoparticles, though these searches were performed at 0K in vacuum [46,47].
Metal deposition is the first dynamical step leading to the nanocatalyst structure and composition. Figures 2 and 3 display growth steps of the Pt50Pd25Au25 and Pt70Pd15Au15
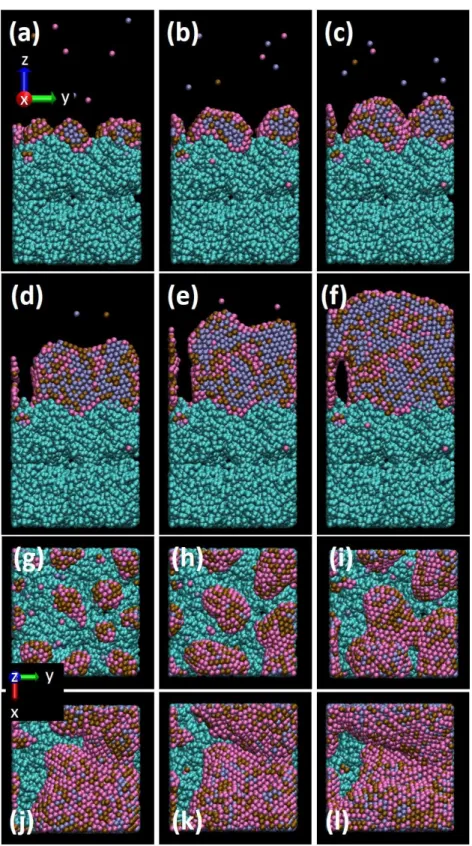
Figure 2. Snapshots of the Pt50Pd25Au25 nanocatalyst growth on porous carbon. Total number
of injected atoms is: side view (a) 1000 (b) 2000 (c) 3000 (d) 5000 (e) 7000 (f) 10000, top view (g) 1000 (h) 2000 (i) 3000 (j) 5000 (k) 7000 (l) 10000. ● C, ● Pt, ● Pd, ● Au.
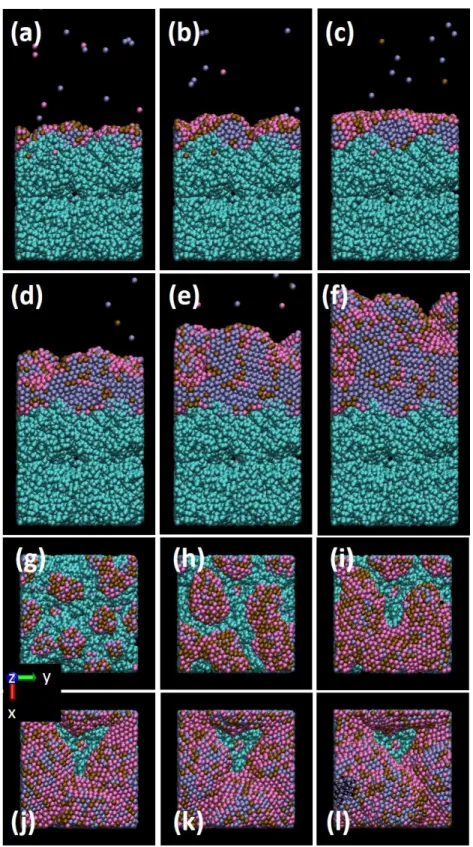
Figure 3. Snapshots of the Pt70Pd15Au15 nanocatalyst growth on porous carbon. Total number
of injected atoms is: side view (a) 1000 (b) 2000 (c) 3000 (d) 5000 (e) 7000 (f) 10000, top view (g) 1000 (h) 2000 (i) 3000 (j) 5000 (k) 7000 (l) 10000. ● C, ● Pt, ● Pd, ● Au.
Side views at lower Pt contents show cluster growth as core-shell structure in the early deposition time (Figures 2(a,b)): a core of Pt atoms is growing surrounded by a Pd
monoatomic shell and an outer Au shell. This is consistent with the hierarchy of surface energies deduced from the EAM parametrization. Table 1 gives the surface energies of the low index facets for Pt, Pd, Au compared to the experimental ones [41]. Although the calculated values from EAM differ from the average experimental values by ca. 40%, the order of the experimental values EsPt > EsPd > EsAu is conserved, albeit a moderately enhanced
propensity for structures with higher surface may be expected.
Table 1. EAM and average experimental surface energies of the low index faces of Pt, Pd, Au
in Jm-2 [40]. Pt Pd Au (111) 1.44 1.22 0.79 (100) 1.65 1.37 0.92 (110) 1.75 1.49 0.98 Experimental, face averaged 2.49 2.00 1.5
Increasing the atom number results in the coalescence of small aggregates (Figure 2(c)). With a higher number of atoms deposited, the Au atoms always stay on the surface, meaning that in the course of cluster growth, segregation of Au always occurs. DFT-level calculations (see calculational details in Ref [48, 49]) performed on 1-2 nm icosahedral Pt nanoclusters show low activation energies for Au-surface segregation, which would be negligible under
experimental deposition conditions. Inthese calculations, the Au atom was initially placed in the subsurface layer of the particle and the nudged elastic band pathway calculated for Au moving to the surface. This revealed negligible energy barriers for the particle reconstruction allowing for exposure of Au to the surface. Compared to this low activation barrier, there was significantly greater stabilization of the particle when Au occupied surface compared to subsurface positions. Nevertheless, some Au atoms are present inside big clusters (Figures 2(d,e,f)). This occurs for Au atoms far enough from the outer surface. This means that
segregation is only possible when a small number of atom exchanges are involved. When the Au atom is too deeply inside the cluster core, it can’t move towards the surface. Figures 2(c-f) also show that, even if a number of the Pd atoms segregate to the outer surface with Au atoms, when increasing the cluster size Pd and Pt atoms are mixed. Top views in Figures 2(g-l) indicate a low Pt surface ratio. Actually, at the final stage of metal deposition (Figures 2(f,l)), the cluster skin has a composition close to Pt10Pd45Au45 while the core has a
composition of ca. Pt60Pd20Au20.
Figure 3 displays snapshots illustrating the growth of Pt70Pd15Au15 prepared by a room
temperature chemical method. As for the Pt50Pd25Au25, the cluster growth starts by forming a
Pt core surrounded by Pd and Au atoms, which finally cover almost completely the Pt core (Figures 3(a,b,c) and Figures 3(g,h)). When increasing the number of deposited atoms, clusters coalesce, keeping the memory of the initial clusters with the appearance of Pd boundaries inside the Pt core (Figures 3(d,e,f)). For further increasing cluster size in the course of deposition, platinum is occupying the surface skin to an increasing extent (Figure 3(j,k,l)). In the final stage, the surface composition Pt33Pd33Au33, offers more efficient
catalytic sites for ORR, while the core composition is Pt60Pd20Au20.
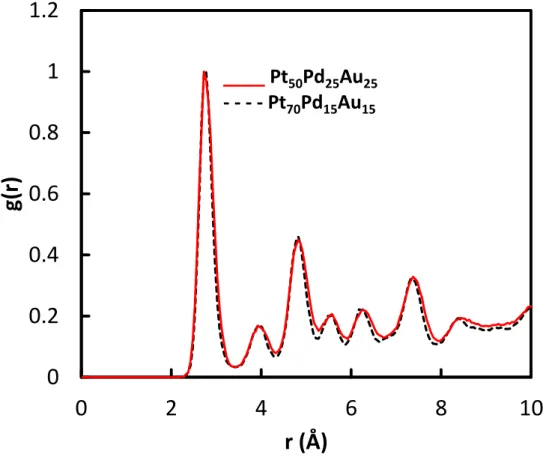
In both cases, when increasing atom deposition numbers, clusters are polycrystalline as it is clearly shown on the side views of Figures 2(f) and 3(f). Crystallinity of model catalysts from MD simulations can be established by calculating the radial density function (RDF) g(r), which provides the nearest-neighbor (NN) distribution. Narrow peaks mean that the layer is very organized due to well-defined nearest-neighbor distances. Figure 4 displays the total RDF corresponding to figures 2(l) and 3(l).
Figure 4. Normalized total RDF g(r) of final configuration corresponding to Figures 2(l) and
3(l).
In addition, Table 2 gives nearest-neighbor distances (up to the 7th) issued from ternary
nanocatalysts RDF compared to theoretical face centered cubic crystal nearest-neighbor distances from single Pt, Pd and Au.
Table 2. NN distances (in Å) determined from RDF of figures 2(l) and 3(l), from theoretical
fcc crystal Pt, Pd and Au. a0 is the lattice parameter.
1st NN 2nd NN 3rd NN 4th NN 5th NN 6th NN 7th NN distance 2 1 a0 a0 2 3 a0 2a0 2 5 a0 3 a0 2 7 a0 Pt 2.77 3.92 4.80 5.54 6.2 6.79 7.33 Pd 2.75 3.89 4.76 5.50 6.15 6.74 7.28 Au 2.88 4.08 5.00 5.77 6.45 7.06 7.63 Simulated 2.72 3.92 4.82 5.57 6.27 - 7.37
The RDF of both ternary catalysts are very similar. The peak positions are close to Pt and Pd values, while Au values are slightly higher. One should notice that Au does not contribute significantly to the RDF except to the 1st NN because Au atoms are mainly located at the
0
0.2
0.4
0.6
0.8
1
1.2
0
2
4
6
8
10
g(
r)
r (Å)
____ Pt
50Pd
25Au
25- - - - Pt
70Pd
15Au
15surface, forming a monolayer. Moreover, the existence of the 2nd NN is due to parallel atomic
planes. Indeed, 2nd NN always only lies in planes above and below the reference atom plane.
There is no 2nd NN atom in a single fcc atomic plane. So, well defined NN peaks and the
presence of 2nd NN demonstrate the crystalline state of the model ternary nanocatalysts from
MD simulations. The very slight differences between the two RDF plots indicate that Pt50Pd25Au25 is slightly less ordered than Pt75Pd15Au15. This is mainly due to the lower Pt
content, which, as the predominant element, is driving the crystallinity of the sample. The simulation results presented above are in very good agreement with those obtained experimentally for the ORR activity of Pt50Pd25Au25 and Pt70Pd15Au15 catalysts prepared by a
room temperature chemical method (water in oil microemulsion) [32]: the low Pt surface composition in Pt50Pd25Au25 compared with Pt70Pd15Au15 is responsible of the lower activity
of the former catalyst compared to that of the latter one. It is also worth to note that the surface enrichment by Au of the ternary catalysts after ageing tests was observed [32], confirming experimentally the propensity of gold atom to segregate towards the surface.
3.2 Simulation of plasma sputtering deposition and growth of Pd25Au25@Pt50 core@shell
ternary nanocatalysts
As it is necessary to enrich the nanocatalyst surface by Pt in order to increase the ORR activity, a possible way is to use alternate plasma sputtering deposition, firstly of the core element(s) and secondly the shell element(s) [31]. For comparison to the Pt50Pd25Au25 ternary
nanocatalyst grown in conditions matching chemical synthesis (but also plasma sputtering with high pressure-target to substrate distance product [31]), we are considering the growth of the Pd25Au25@Pt50 nanocatalyst.
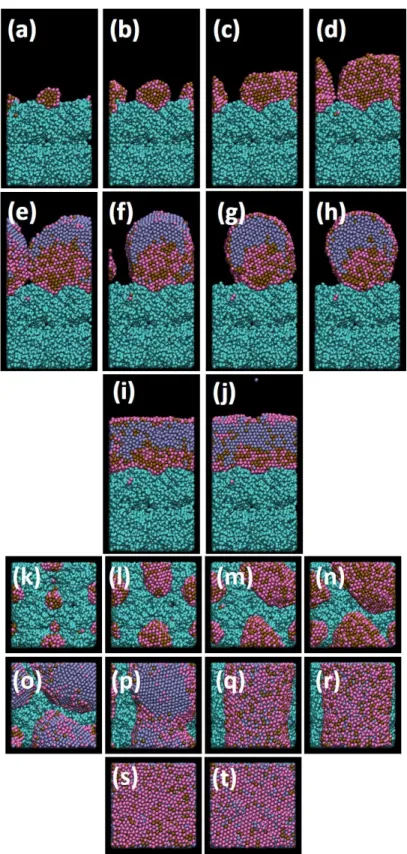
Figure 5 displays the evolution of the Pd25Au25@Pt50 nanocatalyst growth on the previous
Figure 5. Snapshots of the deposited core@shell ternary nanocatalyst Pd25Au25@Pt50. Total
number of injected atoms is: side view (a) 1000 (b) 2000 (c) 3000 (d) 5000 (e) 7500 (f) 8000, (g) 9000 (h) 9500 (i) 9600 (j) 10000; top view (k) 1000 (l) 2000 (m) 3000 (n) 5000 (o) 7500 (p) 8000, (q) 9000 (r) 9500 (s) 9600 (t) 10000.
In the AuPd core deposition step, the nanocatalyst is growing to form clusters. It should be noticed that initial clusters grow on the carbon pore entrance (Figure 5(k)), as a result of the
Au and Pd diffusion. This diffusion is due to the mean high kinetic energies involved in the present sputtering simulations: around 3 eV for Pd and Au (see Section 2). When first 5000 atoms, randomly selected as being either Pd or Au, have been released to the carbon substrate, the deposition of 5000 Pt atoms starts and the Pd-Au deposition is stopped. Figure 5(e) shows a well-defined core shell PdAu@Pt nanocatalyst with a very low surface Au content (Figure 5(o)). These snapshots are taken close before the starting of a cluster coalescence mechanism. When the clusters have coalesced, the nanocatalyst morphology changes to that of a nanowire, and for further Pt deposition, the nanowire is continuously enriched by segregating Au atoms (Figure 5(p-r)). When continuing Pt deposition, the Au coated nanowire suddenly transforms into nanofilm morphology (Figure 5(h-i and r-s)), for which the outermost surface is coated by an almost complete Au monolayer. It should be noted that the film interface with carbon is also coated by an Au monolayer. This shows the strong propensity of Au to diffuse outside the nanocatalyst. A small quantity remains in the Pd phase, as the difference in surface energies is lower than for Pt. While the final nanofilm is almost completely covered by an Au atom monolayer, the efficiency of the catalyst for ORR will be affected. Though by
controlling the sputtering process, suitable morphologies and surface compositions can be tuned to the desired one, which is relevant for the targeted catalysis efficiency.
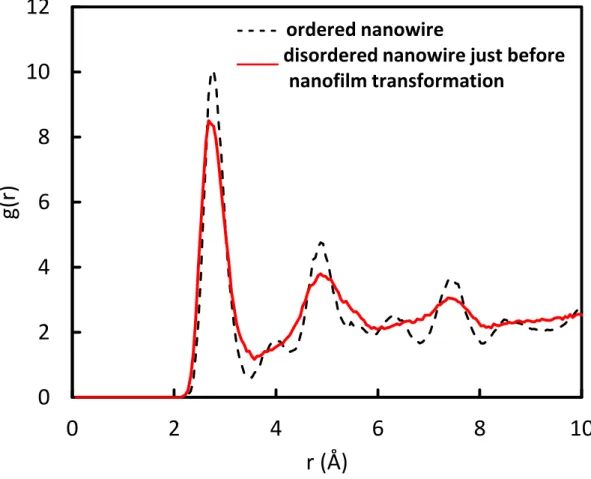
For the nanowire phase, where Pt is still released to the surface, the structure evolved from crystalline to disordered, just before the transformation into nanofilm morphology. This can be seen on the side view of Figure 5(g, h); the corresponding RDF plot is displayed in Figure 6, where the structure change from crystalline one to disordered one is depicted by the broadening of 1st, 3rd and 5th NN peaks and wiping out of 2nd, 4th and 6th NN peaks.
Figure 6. Total RDF of the ordered and disordered Pd25Au25@Pt50 nanowire corresponding to
Figure 5 (g and h)
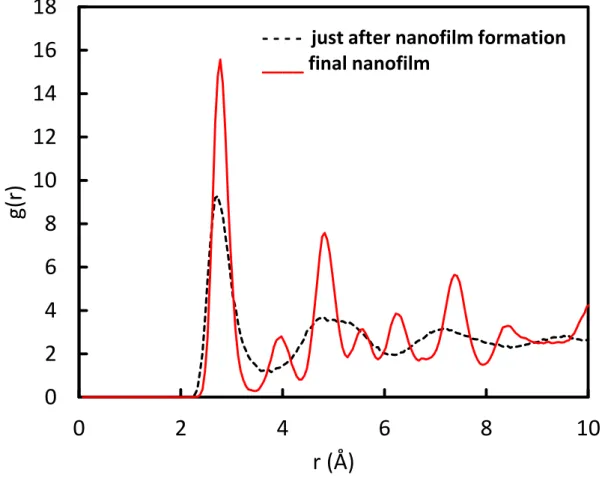
The nanofilm formed just after the transition is also disordered with the same effects on the RDF plots, i.e. broadening and wiping out of peaks. Further deposition of Pt atoms leads to complete crystallization of the nanofilm (Figure 5(i-j). This is supported by the total RDF plots (Figure 7) just after the nanowire to nanofilm transformation and at the end of the simulated deposition.
0
2
4
6
8
10
12
0
2
4
6
8
10
g(r)
r (Å)
- - - - ordered nanowire
____
disordered nanowire just before
nanofilm transformation
Figure 7. Total RDF plot of the initial and final Pd25Au25@Pt50 nanofilm corresponding to
Figure 5(i and j).
Figure 7 gives a clear account of the crystallization of the nanofilm for the further Pt deposition. The final nanofilm exhibits an almost perfectly crystallized structure.
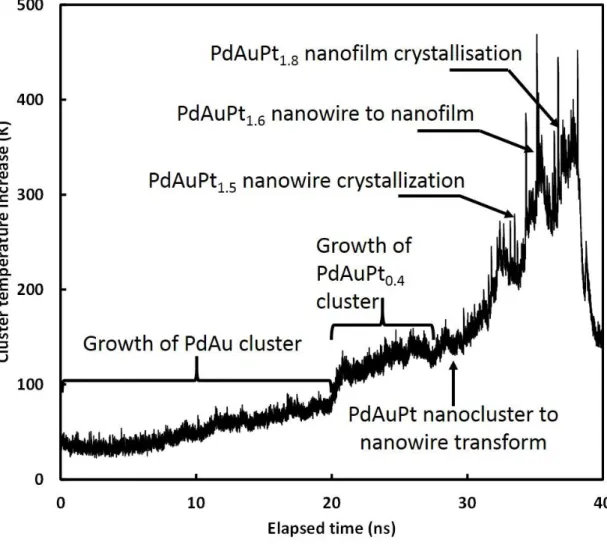
One can further notice that the RDF of the non-crystallized film is similar to the RDF of a liquid. Indeed when checking nanocatalyst temperature increase above the thermostated substrate at 300K (Figure 8), temperature peaks correspond to phase transformation from cluster to nanowire, nanowire crystallization, nanowire to nanofilm transformation and nanofilm crystallization, followed by temperature relaxation into the substrate. This means that the energy delivered by Pt impact on the existing nanocatalyst is confined into the nanostructure and when it increases due to Pt deposition, it leads to various transformations. The nanofilm morphology allows completely dissipating the energy into the substrate due to the highest nanocatalyst contact area with the carbon substrate. One should recall that the only
0
2
4
6
8
10
12
14
16
18
0
2
4
6
8
10
g(r)
r (Å)
- - - - just after nanofilm formation
____
final nanofilm
way to dissipate energy of the cluster is through interaction with the thermostated substrate. The maximum temperature rise is 350 K leading to a catalyst film temperature of 650 K. Supported Pt nanoclusters are known to fuse below 650 K [50]. Transition to nanofilm in a fused state is expected to have higher wettability and thus the nanofilm can relax to a crystalline state when cooling down.
Figure 8. Nanocatalyst temperature increase during the deposition. The various phase
changes are indicated.
4. Conclusion
Molecular Dynamics simulations are carried out for describing the growth of carbon supported Pt50Pd25Au25 and Pt70Pd15Au15 in conditions matching chemical synthesis or soft
plasma sputtering deposition at high pressure. Comparison with DFT prediction and
electrochemical analysis highlights the role of spontaneous upward diffusion of gold atoms. Moreover, measured ORR decreasing activity on chemically synthetized PtxPdyAuz above
25% atomic Au content is consistent with the surface Au content increase, and in turn with the lowering of the surface PdPt active site number predicted by MD simulations.
An alternative to chemical synthesis is the plasma sputtering method that allows versatile deposition of nanocatalyst. MD simulations matching conditions of such a technique show possible tuning of the composition, structure and morphology of the cluster. High surface active site content is possible when considering core@shell structure growth. MD simulations show that morphology transformation, occurring during such a growth process, is driven by the kinetic energy transferred by Pt atoms on the already deposited PdAu core. This
transferred kinetic energy is thus confined in the nanostructure for a while, allowing successive transformation from cluster to nanowire and nanofilm due to nanocalyst temperature increase. These transformations allow final thermal relaxation of the nanocatalyst.
Acknowledgments
The research leading to these results has received funding from the European Union's Seventh Framework Programme (FP7/2007-2013) for the Fuel Cells and Hydrogen Joint Technology Initiative under grant agreement #325327 (SMARTCat project).
References.
[1] A. Chen, and P. Holt-Hindle, Platinum-based nanostructured materials: synthesis, properties, and applications, Chem. Rev. 110 (2010) 3767-3804.
[2] Brian C. H. Steele, Angelika Heinzel, Materials for fuel-cell technologies, Nature 414, 345-352
[3] H. A. Gasteiger, S. S. Kocha, B. Sompalli, F. T. Wagner, Activity benchmarks and requirements for Pt, Pt-alloy, and non-Pt oxygen reduction catalysts for PEMFCs, Applied Catalysis B: Environmental 56 (2005) 9–35
[4] Nørskov, J. K., Bligaard, T., Rossmeisl, J. Christensen, C. H. Towards the computational design of solid catalysts. Nature Chem. 1 (2009) 37-46
[5] S. Chen, H. A. Gasteiger, K. Hayakawac, T. Tadac and Y. Shao-Horn, Platinum-Alloy Cathode Catalyst Degradation in Proton Exchange Membrane Fuel Cells: Nanometer-Scale Compositional and Morphological Changes, J. Electrochem. Soc. 57 (2010) A82-A97
[6] J. Greeley, I. E. L. Stephens, A. S. Bondarenko, T. P. Johansson, H. A. Hansen, T. F. Jaramillo, J. Rossmeis, I. Chorkendorff & J. K. Nørskov, Alloys of platinum and early transition metals as oxygen reduction electrocatalysts, Nature Chemistry 1 (2009) 552 - 556 [7] C. Wang, N. M. Markovic, and V. R. Stamenkovic, Advanced Platinum Alloy Electrocatalysts for the Oxygen Reduction Reaction, ACS Catal., (2012), 891–898
[8] J. Wu, L. Qi, H. You, A. Gross, J. Li, and H. Yang, Icosahedral Platinum Alloy Nanocrystals with Enhanced Electrocatalytic Activities, J. Am. Chem. Soc., 134 (2012), 11880–11883
[9] Z. Peng, H. Yang, Designer platinum nanoparticles: Control of shape, composition in alloy, nanostructure and electrocatalytic property, Nano Today 4 (2009) 143-164
[10] S. Guo, E. Wang, Noble metal nanomaterials: Controllable synthesis and application in fuel cells and analytical sensors, Nano Today 6, (2011) 240–264
[11] M. K. Debe, Electrocatalyst approaches and challenges for automotive fuel cells, Nature 486 (2012) 43–51
[12] L Xiong, A.M Kannan, A Manthiram, Pt–M (M=Fe, Co, Ni and Cu) electrocatalysts synthesized by an aqueous route for proton exchange membrane fuel cells, Electrochemistry Communications 4 (2002) 898–903
[13] L. Xiong and A. Manthiram, Effect of Atomic Ordering on the Catalytic Activity of Carbon Supported PtM (M = Fe, Co, Ni, and Cu) Alloys for Oxygen Reduction in PEMFCs, J. Electrochem. Soc. 152 (2005) A697-A703
[14] P. Mania, R. Srivastavaa, P. Strasser, Dealloyed binary PtM3 (M = Cu, Co, Ni) and ternary PtNi3M (M = Cu, Co, Fe, Cr) electrocatalysts for the oxygen reduction reaction: Performance in polymer electrolyte membrane fuel cells, Journal of Power Sources, 196 (2011) 666–673
[15] R Srivastava, P Mani, N Hahn, and P Strasser, Efficient Oxygen Reduction Fuel Cell Electrocatalysis on Voltammetrically Dealloyed Pt–Cu–Co Nanoparticles, Angew. Chem. Int. Ed., 46 (2007) 8988 –8991
[16] M. Watanabe, K. Tsurumi, T. Mizukami, T. Nakamura, P. Stonehart, Activity and Stability of Ordered and Disordered Co‐Pt Alloys for Phosphoric Acid Fuel Cells, J. Electrochem. Soc. 141 (1994) 2659 - 2668.
[17] C. F. Yu, S. Koh, J. E. Leisch, M. F. Toney, P. Strasser, Size and composition
distribution dynamics of alloy nanoparticle electrocatalysts probed by anomalous small angle X-ray scattering (ASAXS), Faraday Discuss. 140 (2009) 283 - 296.
[18] Wu Y-N, Liao S-J, Liang Z-X, Yang L-J, Wang R-F. High performance Core-shell PdPt@Pt/C catalysts via decorating PdPt alloy cores with Pt, J Power Sources 194 (2009) 805-810.
[19] Garcia AC, Paganin VA, Ticianelli EA, CO tolerance of PdPt/C and PdPtRu/C anodes for PEMFC. Electrochemica Acta 53 (2008) 4309-4315.
[20] Cho Y-H, Choi B, Cho Y-H, Park H-S, Sung Y-E. Pd-based PdPt (19: 1)/C
electrocatalyst as an electrode in PEM fuel cell, Electrochem Comm 9 (2007) 378-381. [21] Alcaide F, Alvarez G, Cabot PL, Miguel O, Querejeta A. Performance of carbon-supported PtPd as catalyst for hydrogen oxidation in the anodes of proton exchange membrane fuel Cell, Int. J. Hydrogen Energy 9 (2010) 11634-11641
[22] M. Mougenot, A. Caillard, P. Brault, S. Baranton, C. Coutanceau, High Performance Plasma Sputtered PdPt Fuel Cell Electrodes with Ultra Low Loading, Int. J. Hydrogen Energy 36 (2011) 8429-8434
[23] P. Hernández-Fernández, S. Rojas, P. Ocón, J. L. G. Fuente, J. S. Fabián, J. Sanza, M. A. Peña, F. J. Carcía-García, P. Terreros, J. L. G. Fierro, Influence of the Preparation Route of Bimetallic Pt-Au Nanoparticle Electrocatalysts for the Oxygen Reduction Reaction, J. Phys. Chem. C 111 (2007) 2913 - 2923.
[24] D. F. Yancey, E. V. Carino, R. M. Crooks, Electrochemical Synthesis and
Electrocatalytic Properties of Au@Pt Dendrimer-Encapsulated Nanoparticles, J. Am. Chem. Soc. 132 (2010) 10988 - 10989.
[25] J. Zhang, K. Sasaki, E. Sutter, R. R. Adzic, Stabilization of platinum oxygen-reduction electrocatalysts using gold clusters, Science 315 (2007) 220 - 222.
[26] K. Sasaki, H. Naohara, Y. Cai, Y. M. Choi, P. Liu, M. B. Vukmirovic, J. X. Wang, R. R. Adzic, Core-Protected Platinum Monolayer Shell High-Stability Electrocatalysts for Fuel-Cell Cathodes, Angew. Chem. Int. Ed. 49 (2010) 8602 - 8607.
[27] V.Tripkovic, H. A. Hansen, J. Rossmeisl and T. Vegge, First principles investigation of the activity of thin film Pt, Pd and Au surface alloys for oxygen reduction, Phys. Chem. Chem. Phys., 2015, 17, 11647-11657
[29] P. Strasser, Q. Fan, Ma. Devenney, and W. H. Weinberg, Ping Liu and Jens K. Nørskov High Throughput Experimental and Theoretical Predictive Screening of Materials – A
Comparative Study of Search Strategies for New Fuel Cell Anode Catalysts, J. Phys. Chem. B 2003, 107, 11013 – 11021
[30] L. Xie, P. Brault, C. Coutanceau, A. Caillard, J. Berndt, E. Neyts, Efficient amorphous platinum catalyst cluster growth on porous carbon: A combined Molecular Dynamics and experimental study, Appl. Cat. B, 62 (2015) 21 – 26
[31] P. Brault and E. Neyts, Molecular dynamics simulations of supported metal nanocatalyst formation by plasma sputtering, Catalysis Today 256 (2015) 3-12
[32] S. Lankiang, M. Chiwata, S. Baranton, H. Uchida, C. Coutanceau, Oxygen reduction reaction at binary and ternary nanocatalysts based on Pt, Pd, Au, Electrochim. Acta 182 (2015) 131-142.
[33] J. M. Haile, Molecular Dynamics Simulations, New-York: Wiley; 1997
[34] M.P. Allen, D.J. Tildesley, Computer Simulations of Liquids, Oxford: Clarendon Press; 1987
[35] D. Frenkel, B. Smit, Understanding Molecular Simulations, New-York: Academic Press; 1996.
[36] D.C. Rapaport, The Art of Molecular Dynamics Simulation, Cambridge: Cambridge University Press; 1998.
[37] S. Plimpton, Fast Parallel Algorithms for Short-Range Molecular Dynamics, J Comp Phys, 117 (1995) 1-19
[38] J. Pikunic, C. Clinard, N. Cohaut, K.E. Gubbins, J.M. Guet, R.J.M. Pellenq, I. Rannou, J.N. Rouzaud, Structural Modeling of Porous Carbons: Constrained Reverse Monte Carlo Method, Langmuir 19 (2003) 8565.
[39] J. Tersoff, Modeling solid-state chemistry: Interatomic potentials for multicomponent systems, Phys. Rev. B 39 (1989) 5566-5568; ERRATUM Phys. Rev. B 41 (1990) 3248 [40] X. W. Zhou, R. A. Johnson, and H. N. G. Wadley, Misfit-energy-increasing dislocations in vapor-deposited CoFe/NiFe multilayers, Phys. Rev. B 69 (2004) 144113
[41] S. Foiles, M. Baskes, M. Daw, Embedded-atom-method functions for the fcc metals Cu, Ag, Au, Ni, Pd, Pt, and their alloys, Phys. Rev. B 33 (1986) 7983-7991.
[42] R. A. Johnson, Alloy models with the embedded-atom method, Phys. Rev. B 39 (1989) 12554-12559
[43] X. W. Zhou, H. N. G. Wadley, R. A. Johnson, D. J. Larson, N. Tabat, A. Cerezo, A. K. Petford-Long, G. D. W. Smith, P. H. Clifton, R. L.
Martens and T. F. Kelly, Atomic scale structure of sputtered metal multilayers, Acta mater. 49 (2001) 4005–4015
[44] D. B. Graves, P. Brault, Molecular dynamics for low temperature plasma-surface interaction studies, J. Phys. D 42 (2009) 194011
[45] http://lammps.sandia.gov
[46] A. Logsdail, L. O. Paz-Borbón, R. L. Johnston, Structures and Stabilities of Platinum– Gold Nanoclusters, Journal of Computational and Theoretical Nanoscience, 6 (2009) 857-866 [47] X. Wu, Y. Dong, Theoretical studies of structures and energies of Pd, Au–Pd, and Au– Pd–Pt clusters, New J. Chem.38 (2014) 4893-4900
[48] S. Lysgaard, J. S. G. Mýrdal, H. A. Hansen and T. Vegge, A DFT-based genetic
algorithm search for AuCu nanoalloy electrocatalysts for CO2 reduction, Phys. Chem. Chem. Phys. 17 (2015) 28270-28276
[49] S. Smidstrup, A. Pedersen, K. Stokbro1, H Jónsson, Improved initial guess for minimum energy path calculations, J. Chem. Phys. 140 (2014) 214106
[50] R. Sellin, C. Grolleau, S. Arrii-Clacens, S. Pronier, J.-M. Clacens, C. Coutanceau, J.-M. Leger, Effects of Temperature and Atmosphere on Carbon-Supported Platinum Fuel Cell Catalysts, J. Phys. Chem. C 113 (2009) 21735–21744
![Table 1. EAM and average experimental surface energies of the low index faces of Pt, Pd, Au in Jm -2 [40]](https://thumb-eu.123doks.com/thumbv2/123doknet/14760084.584599/9.893.94.783.393.651/table-eam-average-experimental-surface-energies-index-faces.webp)