HAL Id: hal-00317214
https://hal.archives-ouvertes.fr/hal-00317214
Submitted on 1 Jan 2004
HAL is a multi-disciplinary open access
archive for the deposit and dissemination of
sci-entific research documents, whether they are
pub-lished or not. The documents may come from
teaching and research institutions in France or
abroad, or from public or private research centers.
L’archive ouverte pluridisciplinaire HAL, est
destinée au dépôt et à la diffusion de documents
scientifiques de niveau recherche, publiés ou non,
émanant des établissements d’enseignement et de
recherche français ou étrangers, des laboratoires
publics ou privés.
High resolution observations of spectral width features
associatedwith ULF wave signatures in artificial HF
radar backscatter
D. M. Wright, T. K. Yeoman, L. J. Baddeley, J. A. Davies, R. S. Dhillon, M.
Lester, S. E. Milan, E. E. Woodfield
To cite this version:
D. M. Wright, T. K. Yeoman, L. J. Baddeley, J. A. Davies, R. S. Dhillon, et al.. High resolution
observations of spectral width features associatedwith ULF wave signatures in artificial HF radar
backscatter. Annales Geophysicae, European Geosciences Union, 2004, 22 (1), pp.169-182.
�hal-00317214�
Annales Geophysicae (2004) 22: 169–182 © European Geosciences Union 2004
Annales
Geophysicae
High resolution observations of spectral width features associated
with ULF wave signatures in artificial HF radar backscatter
D. M. Wright1, T. K. Yeoman1, L. J. Baddeley1, J. A. Davies1,2, R. S. Dhillon1, M. Lester1, S. E. Milan1, and E. E. Woodfield1,3
1Department of Physics and Astronomy, University of Leicester, University Road, Leicester LE1 7RH, UK
2now at: Space Science and Technology Dept., Rutherford Appleton Laboratory, Chilton, Didcot, Oxon,OX11 0QX, UK 3now at: National Center for Atmospheric Research/High Altitude Observatory, P.O. Box 3000, Boulder, Colorado,
80307-3000, USA
Received: 10 December 2002 – Revised: 16 May 2003 – Accepted: 21 May 2003 – Published: 1 January 2004
Abstract. The EISCAT high power heating facility at Tromsø, northern Norway, has been utilised to generate arti-ficial radar backscatter in the fields of view of the CUTLASS HF radars. It has been demonstrated that this technique of-fers a means of making very accurate and high resolution ob-servations of naturally occurring ULF waves. During such experiments, the usually narrow radar spectral widths as-sociated with artificial irregularities increase at times when small scale-sized (high m-number) ULF waves are observed. Possible mechanisms by which these particle-driven high-m waves may modify the observed spectral widths have been investigated. The results are found to be consistent with Pc1 (ion-cyclotron) wave activity, causing aliasing of the radar spectra, in agreement with previous modelling work. The observations also support recent suggestions that Pc1 waves may be modulated by the action of longer period ULF stand-ing waves, which are simultaneously detected on the magne-tospheric field lines. Drifting ring current protons with ener-gies of ∼ 10 keV are indicated as a common plasma source population for both wave types.
Key words. Magnetospheric physics (MHD waves and in-stabilities) – Space plasma physics (wave-particle interac-tions) – Ionosphere (active experiments)
1 Introduction
The use of ground-based radars for making observations of the terrestrial ionosphere and the subsequent diagnosis of dynamic magnetospheric regions and processes is well founded. The Super Dual Auroral Radar Network (Super-DARN; Greenwald et al., 1995) of HF coherent radars is pri-marily designed to monitor the global ionospheric
convec-Correspondence to: D. M. Wright
(Darren.Wright@ion.le.ac.uk)
tion pattern, which traces the motion of magnetospheric field lines under the influence of solar-terrestrial coupling. How-ever, such radars have also been utilised in the study of many more localised phenomena. This paper describes their ap-plication to the study of the ionospheric signatures of ULF waves. A bistatic pair of these radars called CUTLASS (Co-operative UK Twin Located Auroral Sounding System; Mi-lan et al., 1997) have overlapping fields of view, which, in their standard operational mode, encompass the ionosphere over northern Scandinavia and the northern polar cap region at higher latitudes (Fig. 1). The EISCAT (European Inco-herent Scatter) Scientific Association operates a high power HF facility or “Heater” (Rietveld et al., 1993) in the vicinity of Tromsø, Norway, which is also in the CUTLASS field of view. A coordinated CUTLASS-EISCAT experiment, desig-nated OUCH (Observations of ULF waves with CUTLASS and the Heater; e.g. Wright and Yeoman, 1999a), was specif-ically designed to make high spatial and temporal resolution measurements of these geophysical phenomena in HF radar backscatter from ionospheric irregularities artificially gener-ated by the heater (e.g. Yeoman et al., 1997).
The artificial backscatter technique has made particular progress in the study of ULF waves – magnetohydrodynamic (MHD) waves of magnetospheric origin – with small spatial scale sizes and, consequently, large azimuthal wave num-bers, m (Yeoman et al., 1997; Wright and Yeoman, 1999a, b; Yeoman and Wright, 2001; Baddeley et al., 2002). The azimuthal wave number, m, is a measure of the scale size of a wave. It is defined as the number of degrees of phase change of the wave per degree of longitude on the Earth. A high-m wave has a smaller azimuthal scale size (or wave-length) than a low-m wave. Such waves have their energy source in the drifting plasma which constitutes the Earth’s ring current and are generated by resonant wave-particle in-teractions. Non-Maxwellian particle distributions can exist in this plasma (for example, following plasma injections
dur-170 D. M. Wright et al.: Spectral width features associated with ULF wave signatures in artificial HF radar backscatter BJN NUR 20° 0° GEOGRAPHIC 60° 80°
C U T L A S S
vi e w i n g a r e a s Hankasalmi PykkvibærGG G TRO OUJ IMAGE Magnetometer Stations SOD HAN G G G Tromsø Heater Figure 1Fig. 1. The CUTLASS HF radar fields of view during their
stan-dard (common) mode of operation. The bistatic system consists of radars located at Pykkvibær, Iceland and Hankasalmi, Finland. Also indicated are a number of magnetometers in the IMAGE network. The shaded area indicates the extent of the high spatial and tem-poral resolution beam 5 of the Finland radar in the special OUCH experimental mode. Data included in this study were exclusively measured on this beam, which overlays the high power heating fa-cility in Tromsø, Norway.
ing substorms), availing free energy which can feed into field line eigenmodes when a resonance condition is satisfied (e.g. Hughes, 1983). The electric field perturbations associated with these waves drive ionospheric flows which can be de-tected by radars such as CUTLASS. The resulting energy dissipation, via Joule heating in the ionospheric plasma, rep-resents a major energy sink for the collisionless plasma in the inner magnetosphere (Baddeley et al., 2002).
At high latitudes, waves with frequencies in the Pc1 range (0.2–5 Hz) include both electrostatic ion cyclotron (ESIC) and electromagnetic ion cyclotron (EMIC) waves. In con-trast to ground magnetometers, which measure the magnetic signatures, radars detect changes in electric fields. Thus, a ground magnetometer will only detect EMIC waves and those ESIC waves that are associated with current systems (and therefore have a magnetic signature). Technically then, Pc1 waves are those detected on the ground by magnetome-ters.
The SuperDARN radars transmit a multipulse code and the received signals for each range gate are converted into an autocorrelation function (ACF). Parameters such as the backscatter power (relating to irregularity intensity), line of sight velocity of the scattering irregularities and the spectral width can be extracted from the ACF after it is processed using the fitacf fitting routine (e.g. Villain et al., 1987). It is well known that the spectral width of coherent HF radar returns is sensitive to the various regions of the ionosphere and the dynamic processes in the coupled magnetosphere-ionosphere system (e.g. Baker et al., 1995; Lester et al., 2001; Woodfield et al., 2002). It has been suggested that the increased spectral widths associated with radar backscat-ter from the cusp are the result of ion-cyclotron wave activity. Andr´e et al. (1999, 2000a, b) modelled the effects of broad-band ESIC waves and narrow-broad-band EMIC waves on HF radar observations and showed that they are likely to be responsi-ble for enhancing spectral widths as a result of the fast tem-poral changes they cause inside the relatively slowly sampled radar range cells. However, a recent paper by Ponomarenko and Waters (2002) states that the modelling code employed by Andr´e et al. (1999, 2000a, b) fails to account for time-dependent velocity variations and as a result, overestimates the effects of ion-cyclotron waves on HF radar observations. As a consequence, Ponomarenko and Waters (2002) favour small-scale spatio-temporal structures due to particle precip-itation inside a radar range cell, as the cause of the observed large spectral widths in the cusp regions.
For over 30 years the generally accepted generation mech-anism for ion-cyclotron waves was the Bouncing Wave Packet (BWP) model (Obayashi, 1965; Cornwall, 1965; Kennel and Petschek, 1966). Recently, however, evidence has been emerging that supports an alternative view to this model. There are ground-based observations (Plyasova-Bakounina et al., 1996) and combined ground-satellite obser-vations (e.g. Mursula et al., 1997, 1999, 2001; Rasinkangas and Mursula, 1998) supporting Pc1 growth by long period ULF waves. These papers refer to observations of EMIC waves occurring at high latitudes. In each case, the repeti-tion rate of the Pc1 wave packets correlated with the periods of ULF waves in the Pc3-5 frequency range was detected si-multaneously in space and on the ground. This is in strong contrast to the BWP model, which dictates that the repeti-tion period of the Pc1 wave packets equates to their bounce period along the local field line.
Although the relationship between Pc1 activity and spec-tral width has been applied to cusp observations, this pa-per will show that a similar phenomenon occurs at lower latitudes in high resolution observations of naturally occur-ring ULF waves, utilising the artificial backscatter technique. Specifically, increases in spectral width have been detected in association with particle-driven Pc4 waves (possessing peri-ods in the range 45–150 s). These observations indicate that at L∼6 − 7, the Pc1 and Pc4 waves have a common energy source in non-Maxwellian plasma distributions in the Earth’s ring current.
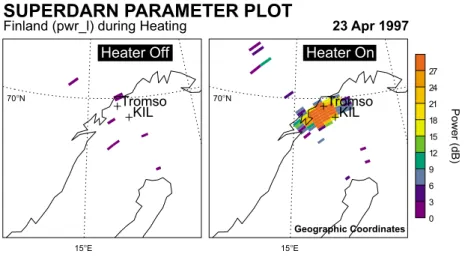
D. M. Wright et al.: Spectral width features associated with ULF wave signatures in artificial HF radar backscatter 171 23 Apr 1997 15°E KIL Tromso 0 3 6 9 12 15 18 21 24 27 Power (dB) 70°N 15°E KIL Tromso 70°N
Heater Off Heater On
SUPERDARN PARAMETER PLOT
Finland (pwr_l) during HeatingFigure 2
Geographic Coordinates
Fig. 2. Scans of CUTLASS Finland
backscatter power indicating the effect of activating the heater. A large patch of artificial backscatter is generated in the radar’s field of view above Tromsø which would not otherwise have been present. Backscatter powers often ex-ceed 30 dB above the noise. The loca-tion of the Kilpisj¨arvi pulsaloca-tion magne-tometer (KIL) is also shown.
2 Instrumentation 2.1 The CUTLASS radars
The global SuperDARN network (Greenwald et al., 1995) currently consists of 15 HF coherent radars, 9 of which oper-ate in the Northern Hemisphere. The ionospheric convection velocities presented in this paper were measured by the CUT-LASS bistatic HF radar (Milan et al., 1997). It is a frequency agile system which operates in the range 8–20 MHz and con-sists of stations at Pykkvibær, Iceland and Hankasalmi, Fin-land (Fig. 1). The signals returned to the radars have under-gone a Bragg-like backscattering process from field-aligned electron density irregularities in the ionosphere. There is an aspect angle dependence for scattering, which requires that the radio wave k vector is close to orthogonal to the mag-netic field. The current experiment utilises the EISCAT high power HF Heating facility (see below) at Tromsø, which can generate artificial field-aligned irregularities and thus pro-vide a region of backscatter in the CUTLASS fields of view (e.g. Robinson et al., 1997) when backscatter may not al-ready be present. This effect is illustrated in Fig. 2, which shows the portion of the CUTLASS field of view affected by the Tromsø heater, superimposed on a map of northern Scandinavia. The technique thus provides a powerful way of diagnosing plasma dynamics and, as in this case, observing geophysical phenomena, such as ULF wave activity. In the OUCH mode, the CUTLASS radars do not sound on all of their 16 beams. Typically, the Finland radar makes measure-ments on only 6 of its 15 beams (2–7), dwelling on each for 1 s, and Iceland operates on beams 13–15 with a dwell time of 2 s. Thus, data are available from any given beam with a 6-s resolution. The high backscatter powers produced us-ing the Heater make it possible to integrate data over such short dwell times, since the signal to noise levels are high. The OUCH mode also utilises a range cell length of 15 km, shorter than the 45 km gates employed in common mode op-erations. The Finland and Iceland radars have lags to a first range of 480 km and 1470 km, respectively, in the OUCH
mode. In this paper only data from the northward directed beam 5 of the Finland radar have been employed, as this beam overlays Tromsø, the location of the EISCAT Heater. The fields of view of the CUTLASS radars shown in Fig. 1 represent those during common mode operations. Beam 5 in OUCH mode is shown as the black region centred approxi-mately over Tromsø.
2.2 The EISCAT high power heating facility
The high power HF heating facility located near Tromsø transmits up to 1 MW of power with an effective radiated power of 280 MW. It is radiated through one of three 6 × 6 phased arrays of rhombically broadened crossed dipole an-tennas. Different radiated frequencies can be achieved by selection of an appropriate array. Currently, the Heater can operate in the range 4–8 MHz. However, all of the data pre-sented in this paper were measured for Heater frequencies in the range 4.54–7.1 MHz. Harmonics of the local electron gy-rofrequency were not employed as Heater frequencies, since this could potentially have reduced the heater’s ability to gen-erate artificial irregularities. It has been suggested that close to a gyroharmonic an unmodulated heater can cause spectral broadening in the ULF range, which could, in turn, broaden the received HF radar spectra (Ponomarenko et al., 1999). Each of the 12 high power transmitters are configured to drive a row of 6 of the dipole antennas. When the transmit-ted frequency is less than the local ionospheric critical fre-quency (foF2), then the high power wave energy may gener-ate field-aligned electron density striations (or irregularities) when the high power electromagnetic heater wave couples to upper hybrid waves in a relatively narrow altitude range at the so-called upper hybrid height (e.g. Robinson, 1989). During the experiments described here (designated EISCAT special programme SP-UK-OUCH), only half of the trans-mitters and antennas were employed. This had the advantage of increasing the heater beam width and, therefore, the size of the patch of artificial scatter detected by the CUTLASS radars. This maximises the observing area for geophysical
172 D. M. Wright et al.: Spectral width features associated with ULF wave signatures in artificial HF radar backscatter 20 25 30 35 40 45 Range gate 20 25 30 35 40 45 200 400 600 800 1000 1200 Velocity (m s -1) 12:00 12:30 13:00 13:30 14:00 14:30 15:00 15:30 UT 15 20 25 30 35 40 45 Range gate 12:30 13:00 13:30 14:30 15:30 UT 15 20 25 30 35 40 45 -35 -20 -5 10 25 40 55 70 85 Velocity (m s -1 ) 0 5 10 15 20 25 30 35 40 45 Width (m s -1 )
SUPERDARN PARAMETER PLOT
Hankasalmi: vel and width_l 15 Oct 1998
Figur e 3 (Increment=150) A A D C B E E D B C (a) (b) (c)
Fig. 3. High spatial and temporal
res-olution CUTLASS Finland radar mea-surements of artificially induced irreg-ularities during the OUCH experiment on 15 October 1998. Panels include:
(a) colour-coded line of sight velocity
along beam 5 (positive velocities are towards the radar); (b) stacked veloc-ity time series taken from range gates 26–34 as shown in (a); (c) colour-coded spectral width associated with the backscattered signals derived us-ing the ACF fittus-ing routine fitacf. The dashed lines, A-E, indicated common spatial boundaries apparent in panels (b) and (c). Data in all these panels have a 10 s and 15 km resolution.
processes. Further technical information on the EISCAT high power HF heating facility is given by Rietveld et al. (1993). 2.3 The Kilpisj¨arvi pulsation magnetometer
Data from the induction-coil (or pulsation) magnetometer lo-cated at Kilpisj¨arvi, Finland, are also included in this study. Such a system is sensitive to temporal changes in the Earth’s magnetic field, dB/dt. As the field fluctuates a current is induced in the magnetometer coil. This has the advantage of being able to detect relatively rapid changes in the field which occur over intervals of the order of tenths of a second. Some of the data employed here were sampled at 10 Hz and some at 20 Hz. Such instruments generally have a resolu-tion of a few picoTeslas at frequencies of a few Hertz and are ideally suited to observing Pc1 waves. During the OUCH experiments, this pulsation magnetometer was the one op-erating closest to the location of the heater at a distance of about 90 km southeast of Tromsø (see Fig. 2).
3 Observations
An important feature of the artificial backscatter technique, and the one most relevant to this study, is that HF radar backscatter artificially generated by the heater has very nar-row spectral widths associated with it. This is due to the fact that the artificial irregularities are very coherent and have a long decorrelation time in the ionosphere. Yeoman and Wright (2001) showed a comparison between CUTLASS fit-ted spectra for backscatter from natural and artificial irregu-larities (see their Figs. 1b and c). Due to the highly coherent nature of heater-induced irregularities, the measured velocity spectra are narrow, typically having widths not greater than 10 m s−1. In contrast, spectra associated with natural scatter
generally have widths > 100 m s−1due the reduced coher-ence of these structures. The artificial irregularities follow the convection path imposed upon them by magnetospheric dynamics in the same way as natural irregularities. How-ever, on occasions when small-scale-sized ULF waves are modulating the flows (e.g. Wright et al., 1999a, b; Yeoman and Wright, 2001; Baddeley et al., 2002), increases in the observed spectral width of the artificial scatter are appar-ent. This can be seen in Fig. 3, which displays data from beam 5 of the CUTLASS Finland radar from the OUCH run of 15 October 1998. The Range-Time-Velocity data repro-duced in the upper panel, as a function of radar range gate and time, clearly shows a brightly coloured band of scat-ter. This represents the irregularities artificially generated by the heater. Had the high power facility not been used, then no useful scatter would have been detected and only noise would have been recorded, such as in those regions immedi-ately above and below the region of artificial scatter in this panel. Within the band of scatter a lot of fine structure is apparent, which indicates the modulation of the background line of sight velocity of the artificial irregularities by ULF waves. The waves are perhaps more evident in the middle panel of Fig. 3, which offers an alternative to colour coding the velocities in the form of a set of stacked time series rep-resenting range gates 26–34 of the line of sight velocity data in the upper panel. The data from successive range gates have been offset by 150m s−1 in this plot. Both short pe-riod (∼100 s; most notably in the interval 13:30–14:00 UT) and long period (∼250 s; detected prior to 12:30 UT and intermittently after 14:00 UT) waves are apparent in these time series. The higher frequency waves, whose amplitude maximises in the interval 13:30 UT and 14:00 UT, are the signatures of particle-driven ULF waves with small spatial scale sizes (Wright et al., 1999a, b; Yeoman and Wright,
D. M. Wright et al.: Spectral width features associated with ULF wave signatures in artificial HF radar backscatter 173 12:00 12:30 13:00 13:30 14:00 14:30 15:00 15:30 UT 0 100 200 300 400 500 Width (m s -1) 200 400 600 800 Velocity (m s -1)
SUPERDARN PARAMETER PLOT
Hankasalmi: vel & width_l (level=5 ms-1) 15 Oct 1998
(increment = 50)
(increment = 100)
Figure 4
(a)
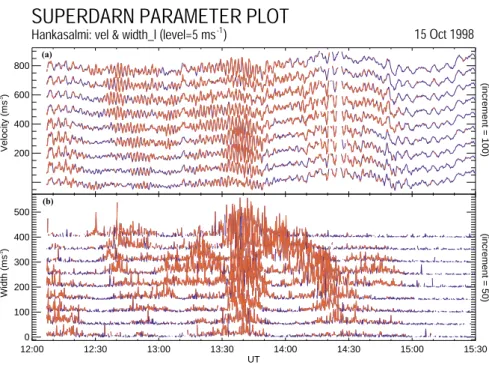
(b) Fig. 4. Stacked time series for (a) line
of sight velocity and (b) spectral width for range gates 26–34 along beam 5 of the CUTLASS Finland radar for the in-terval shown in Fig. 3. An arbitrary increment is applied to sequential time series for clarity. The data are colour coded such that spectral width above 5m s−1appear red and the velocities at those times are also red.
2001; Baddeley et al. 2002), whereas the longer period sig-natures are those of a large-scale field line resonance. The lower panel of Fig. 3 presents the spectral width of the CUT-LASS radar observations. The dark blue regions, repre-senting widths less than 10m s−1, are the norm for artificial backscatter such as this. However, in the interval ∼12:30– 15:00 UT a range of increased spectral widths are observed, which peaks at about 200m s−1, (although, for clarity, the
colour scale has been selected such that spectral widths satu-rate at 50m s−1) coinciding with the maximum amplitude of the high frequency ULF wave observed in the velocity (mid-dle) panel.
Another significant feature of this data set is that both the wave activity and spectral width enhancements observed us-ing CUTLASS follow common spatial boundaries. Bands of wave activity are localised within (i.e. enclosed by) the re-gion of artificial scatter. Some of the boundaries between the low spectral widths associated with heater-induced ir-regularities and the increased spectral widths are marked in the lower panel of Fig. 3. They appear as the dashed lines labelled A-E. These same boundaries have also been trans-posed onto the velocity time series in the middle panel of the same figure. It can be seen that these boundaries also sepa-rate the main regions of high frequency ULF wave signatures from those with longer periods. These demarcators also in-dicate that the small-scale waves are, at times, confined to a relatively narrow latitudinal region certainly less than the extent of the patch of artificial scatter which is ∼ 180 km (12×15 km range gates) at its widest on this occasion. Longi-tudinally, the high-m wave and the coincidence of enhanced spectral widths extend over the whole region, of artificial scatter, which appeared in beams 3–7 of the Finland radar. Thus, the spatial extent of the wave was at least 250 km at
L∼6 − 7.
Figure 4 offers an alternative way of looking at the data in Fig. 3. In this case the two panels show line of sight velocities (upper panel) and spectral width (lower) stacked time series for ranges 26–34, with the data from subsequent ranges being arbitrarily offset. The spectral width data are colour coded such that widths greater than 5m s−1 appear red and below
that level they are blue. Data spikes were avoided by only se-lecting intervals where more than one consecutive measure-ment had an enhanced spectral width. The velocity data are colour coded to match the widths, i.e. the velocities are given the same colour as the equivalent spectral widths at the same range gate and time. The purpose of this is to highlight more clearly that the increased spectral widths are coincident with the high frequency (∼ 10 mHz) waves. In contrast, the long period waves (signatures of large scale waves) almost exclu-sively appear blue. This interval of data has been selected to demonstrate this relationship since it has the largest change in spectral width and exhibits some of the best examples of small scale waves in the OUCH data set.
The ACF fitting routine, fitacf, employed by SuperDARN radars is an essential part of the data processing performed on the data they collect. They fit model ACFs under a series of constraints to those measured by the radars. Both expo-nential and Gaussian fits are applied to the data, which relate to different decorrelation times of the observed irregularities (e.g. Villain et al., 1987, 1996 and references therein). In general, if the mechanism generating or modulating the ob-served irregularities has a scale size comparable to that of the wavelength of the diagnostic HF radio wave, then the radar makes a more accurate measurement of the velocity distribu-tion of the irregularities. Under these condidistribu-tions a Gaussian fit is appropriate. However, where structures with correla-tion lengths considerably less than the HF wave are measured (equivalent to a type of spatial aliasing), then Lorentzian
pro-174 D. M. Wright et al.: Spectral width features associated with ULF wave signatures in artificial HF radar backscatter -400 -200 0 200 400 Velocity (ms-1) 0.2 0.4 0.6 0.8 1.0 Normailsed Power 13:41:48 UT Beam 5, Range 28 Width_l: 88.0 ms Vel: 35.2 ms pwr_l: 39.85 dB -1 -1 -400 -200 0 200 400 Velocity (ms-1) 0.2 0.4 0.6 0.8 1.0 Normailsed Power 15:15:06 UT Beam 5, Range 28 Width_l: 2.5 ms Vel: 3.8 ms pwr_l: 33.07 dB -1 -1 (a) (b)
SUPERDARN PARAMETER PLOT
Hankasalmi: ACF Power Spectra [981015]Figure 5
Fig. 5. CUTLASS velocity spectra for range 28 of beam 5 of the
Finland radar 15 October 1998: (a) Normal narrow spectral widths associated with artificial scatter taken at 15:15:06 UT and (b) in-creased spectral widths coincident with Pc4 wave activity observed inside the patch of artificial scatter at 13:41:48 UT. The solid lines represent the low resolution spectrum derived from the FFT of the measured ACF and the dashed curves are Lorentzian profiles gener-ated using the parameters calculgener-ated by the ACF fitting programme, fitacf.
files are fit to the radar data. It is well known that the power spectrum of the received data is simply the Fourier transform of the measured ACF. However, since a common mode Su-perDARN ACF is made up of only 17 lags, then this leads to a very low resolution in the power spectrum. The low resolu-tion of the spectra produced in this manner causes power to “leak” from the central spectral component into adjacent ve-locity (equivalent to frequency) bins. Figure 5 demonstrates this; Fig. 5a and b are, respectively, derived from data in the regions of low and high spectral width (at range 28 of beam 5) in the CUTLASS Finland data in Fig. 3. Plotted are the power spectra, in velocity space, of the CUTLASS observa-tions, as derived by the direct FFT of the ACF. In each case these would indicate a spectral width (full width at half max-imum) of 100–200m s−1. Superimposed on these are spec-tra (dotted lines) generated from the parameters derived us-ing fitacf. These smooth curves represent Lorentzian profiles
(the Fourier transform of an exponential ACF fit) of the fit-ted data. They now demonstrate the stark difference between the narrow fitted spectra derived from normal heater-induced scatter (Fig. 5a) and the broadened fitted spectra observed during the particle driven wave activity (Fig. 5b). Despite the similarity between the directly transformed (low resolu-tion) spectra in Figs. 5a and b, the actual measured ACFs were very different. The ACF associated with the spectra in Fig. 5a hardly decays at all as a function of lag time, as com-pared to the ACF used to derive the spectra in Fig. 5b. The fitacf fitting process is sensitive to this decay, which is related to the decorrelation time of the irregularities. This is why the fitted spectra look so different for the two types of scatter.
Data from the Kilpisj¨arvi pulsation magnetometer (KIL) are presented next. Unfortunately, the data set from the magnetometer for 15 October 1998 (as shown in Fig. 3) was incomplete. However, data covering the OUCH run on 26 October 1999 are reproduced in Fig. 6 to illustrate the ob-served features. The figure displays the H -component (from the HDZ magnetic coordinate system) dynamic power spec-trum derived from the KIL data. The measurements, which were sampled at 20 Hz in this case, had a sliding FFT ap-plied to them with a window size of 51.2 s and sequential FFTs were slipped by 25.6 s. All KIL data employed for this study were processed in this way. Figure 6 shows the thresh-old spectral information over the range 0–2 Hz. Most Pc1 waves occur in the range 0.2–2 Hz and so these are the limits we have imposed on the data in this study. What is immedi-ately apparent in the dynamic spectrum are the two bursts of enhanced spectral power which lie in a band below 1 Hz and occur from 07:10–07:40 UT and 08:00–08:30 UT. These are indicators of Pc1 wave activity.
Figures 7 and 8 are now respectively employed to dis-tinguish between observations made during intervals when particle-driven waves were detected from those occasions when such activity was absent. Shown in both figures are simultaneous CUTLASS and KIL data. Figure 7 presents data from 26 October 1999, the same interval as in Fig. 6. The CUTLASS line of sight velocity and spectral width data in Figs. 7a–c are in the same format as Fig. 3. The inter-val in Fig. 7 has been selected for two reasons. First, it is another occasion (compare Fig. 3) on which Pc4 wave signa-tures were observed in the patch of artificial radar backscat-ter. In addition, on this day KIL magnetometer data were available for comparison, which was not the case for the in-terval shown in Fig. 3. During the inin-terval presented in Fig. 7, the region of CUTLASS backscatter was rather more patchy than for that in Fig. 3, due to the prevailing ionospheric con-ditions. The two time series in Figs. 7d and e, respectively, represent the H - and D-component total spectral power, de-rived from the dynamic spectral analysis, summed over the frequency range 0.2–2 Hz. This acts as a general indicator of wave activity in the Pc1 frequency band. For this in-terval, as with that on 15 October 1998, small-scale-sized particle driven waves are clearly visible modulating the line of sight flow of the artificial irregularities. These manifest themselves as the relatively high frequency wave cycles with
D. M. Wright et al.: Spectral width features associated with ULF wave signatures in artificial HF radar backscatter 175
H-Component, Threshold:50%
Kilpisjärvi Dynamic Spectral Power [991026]
Figure 6 -3.0 -2.7 -2.4 -2.1 -1.8 -1.5 -1.2 -0.9 -0.6 -0.3 Normailised Power (dB)
Fig. 6. A dynamic power spectrum
de-rived from H -component data recorded by the Kilpisj¨arvi pulsation magne-tometer (KIL) on 26 October 1999. Bursts of Pc1 activity are apparent at frequencies below 1 Hz. The data pre-sented here was analysed using a 51.2 s spectral window with a slip of 25.6 s.
periods in the range 60–70 s. Baddeley et al. (2002) have pre-sented a detailed investigation into the nature of the waves in this interval and concluded that they were the result of a drift-bounce resonant interaction between drifting ring cur-rent protons, with energies of around 10 keV, and a field line eigenmode. The azimuthal wave number (m) of these waves was shown to be −45. It can again be seen that enhanced spectral widths appear coincident with the occurrence of the high-m waves in the velocity data. What is even more signif-icant though is the fact that simultaneous with these features in the CUTLASS data are large increases in Pc1 power de-tected by the KIL magnetometer.
In contrast, Fig. 8 displays an interval of data from 21 October 1999 when high-m particle driven waves were not present. The panels in Fig. 8 are in the same format as those in Fig. 7. In this case only the weak signatures of longer period and large-scale-sized field line resonances are observed. There are no significant increases in radar spec-tral width and the measured spectra maintained widths of less than 10m s−1. This time the summed KIL H - and D-component Pc1 powers are very low and unchanging. This again supports our suggestion of a relationship between Pc1 activity and particle driven wave occurrence.
4 Discussion
Since it was first run in 1998 the OUCH experiment has made significant advances in ULF wave research. CUTLASS measurements taken during runs of the OUCH experiment have already demonstrated that ULF wave activity is contin-uously ongoing but that often waves with small-scale sizes in the magnetosphere and ionosphere cannot be detected on the ground, due to the relatively low spatial resolution of the instruments traditionally employed to observe them. Ground magnetometers generally integrate their data over a region which is of the order of the height of the E-region (∼100 km; Hughes and Southwood, 1976). Thus,
small-scale waves of the type reported by Yeoman et al. (1997), Wright et al. (1999a, b), Yeoman and Wright (2001), Bad-deley et al. (2002), as well as in this paper are invisible to standard instruments. In fact, the data measured using the ar-tificial backscatter technique are amongst the highest spatial and temporal resolution electric fields associated with ULF waves ever recorded in solar-terrestrial physics. They are also the most accurate ULF wave electric fields ever observed on account of the extremely narrow spectral widths normally associated with artificially induced radar backscatter. Due to the bistatic nature of CUTLASS, polarisation hodograms can also be derived for the ULF waves. Wright et al. (1999b) also examined the polarisations of waves measured with this technique and demonstrated that they exhibit similar charac-teristics to the VHF radar observations of such high-m waves reported by Allan et al. (1982).
From examination of the CUTLASS and KIL data pre-sented here, it seems clear that a relationship exists between the occurrence of the particle-driven Pc4 waves apparent in CUTLASS velocity data and increases in Pc1 activity de-tected on the ground. The nature of this relationship will be explored below.
4.1 Ion-cyclotron wave generation
This paper is concerned with two types of ion cyclotron waves: electrostatic ion cyclotron (ESIC) waves and electro-magnetic ion cyclotron (EMIC) waves. Both can be gener-ated by wave-particle interactions in the magnetosphere. At
L ≈6 energy exchange can occur from the drifting protons (along with He+and heavier ions), which constitute the ring current if they possess a non-maxwellian energy distribution. For example, it is known that such wave activity is enhanced in the recovery phase after geomagnetic storms and sub-storms. For over 30 years the generally accepted generation mechanism for these waves was the Bouncing Wave Packet (BWP) model (Obayashi, 1965; Cornwall, 1965; Kennel and Petschek, 1966). In this scenario, ion cyclotron wave modes
176 D. M. Wright et al.: Spectral width features associated with ULF wave signatures in artificial HF radar backscatter 30 35 40 Range gate 30 35 40 -85 -70 -55 -40 -25 -10 5 20 35 Velocity (ms -1 ) 200 400 600 800 Velocity (ms -1) 30 35 40 Range gate 30 35 40 0 5 10 15 20 25 30 35 40 45 Width (ms -1 ) 0.2 0.4 0.6 0.8 1.0 H Power 07:00 07:20 07:40 08:00 08:20 UT 0.0 0.2 0.4 0.6 0.8 1.0 D Power
SUPERDARN PARAMETER PLOT
Hanksalmi: vel and width_l with KIL Pc1 Power
26 Oct 1999( increment = 100) Figure 7 (a) (b) (c) (d) (e)
Fig. 7. OUCH measurements from
07:00–08:30 UT on 26 October 1999. Panels (a–c) present the same CUT-LASS parameters as given in Fig. 3, namely (a) colour-coded line of sight velocity, (b) stacked velocity time series for range gates 26–34 and (c) colour-coded radar spectral width, all from beam 5 of the Finland radar. Also shown are time series of (d) H - and (e) D-component KIL Pc1 power summed over the frequency range 0.2–2 Hz, fol-lowing the same dynamic spectral anal-ysis as shown in Fig. 6.
are amplified by a resonant interaction between the wave packets, which are bouncing along field lines and undergoing reflection at ionospheric altitudes, and the protons each time the wave packet passes through the ring current in the mag-netic equatorial plane. Inside the plasmasphere, protons with energies of several hundred keV are believed to be responsi-ble for the generation of these waves. Beyond the plasma-pause however, at L ≈ 6 proton energies of ∼ 10 keV can resonate with the ion cyclotron wave modes (e.g. Cornwall, 1965; Thorne, 1972).
ESIC waves are most commonly polarised with k⊥ kk.
In contrast to the EMIC waves, which propagate, in gen-eral, parallel to the magnetic field, ESIC waves occur pre-dominantly in the equatorial plane around the source region. However, some ESIC waves can propagate along the field in
the slow magnetosonic mode. EMIC waves are restricted to frequencies, with a narrow-band spectrum, below the local ion cyclotron frequency, ωc, whereas ESIC waves are
gen-erally separated into narrow-and broad-band spectral types. Narrow-band ESIC waves typically exhibit frequencies just above the proton cyclotron frequency and its harmonics (e.g. Thorne, 1983; Gurnett, 1991). Broad-band ESIC waves (of-ten called broad-band electrostatic noise) exhibit frequencies ranging from a few Hz to tens of kHz and have long been known to occur in the auroral regions, although their origins are still not fully understood. The estimated carrier frequency of the waves, ω, is given by ω ∼ ωc(VA/v), where VAis the
Alfv´en velocity and v is the velocity of the resonant protons. In general, electrostatic waves dominate at higher latitudes (outside the plasmapause), and these are considered to be
re-D. M. Wright et al.: Spectral width features associated with ULF wave signatures in artificial HF radar backscatter 177 25 30 35 40 25 30 35 40 200 300 25 30 35 40 25 30 35 40 0.2 0.4 0.6 0.8 1.0 09:30 09:40 09:50 10:00 10:10 10:20 10:30 UT 0.0 0.2 0.4 0.6 0.8 1.0 -10 0 10 20 30 40 50 60 70 Velocity (ms -1 ) 0 5 10 15 20 25 30 35 40 45 Width (ms -1 ) (increment = 50) Range gate Range gate KIL H Pc1 Power KIL D Pc1 Power Velocity (ms -1 ) 100
SUPERDARN PARAMETER PLOT
Hanksalmi: vel and width_l with KIL Pc1 Power
21 Oct 1999Figure 8 (e) (d) (c) (b) (a)
Fig. 8. Data in the same format as
Fig. 7 from 09:30–10:30 UT on 21 Oc-tober 1999.
sponsible for the broad-band spectrum of waves encountered in the cusp region (e.g. Curtis et al., 1982; Maynard, 1985). It has also been noted that EMIC wave occurrence tends to maximise around the plasmapause (e.g. Roth and Orr, 1975), although they are also commonly observed at higher latitudes (e.g. Mursula et al., 1991).
More recently, evidence has been emerging that supports an alternative view to the bouncing wave packet model. There are ground-based (Plyasova-Bakounina et al., 1996) and combined ground-satellite (e.g. Mursula et al., 1997, 1999, 2001; Rasinkangas and Mursula, 1998) observations supporting Pc1 growth by long-period ULF waves. These papers refer to observations of EMIC waves occurring at high latitudes. In each case, the repetition rate of the Pc1
wave packets correlated with the periods of ULF waves in the Pc3-5 frequency range detected simultaneously in space and on the ground. This is in strong contrast to the BWP model, which dictates that the repetition period of the Pc1 wave packets equates to their bounce period along the local field line. These authors have suggested that the long-period ULF waves modulate the plasma parameters, in particular, the plasma density, in the equatorial growth region of the EMIC waves. This supports the model of cyclotron wave growth by Gail (1990), which indicates that even small rel-ative variations in critical plasma parameters could modify the rate of EMIC wave growth close to marginal instability by periodically forcing the plasma into an unstable state in terms of the ion cyclotron instability. Mursula et al. (2001)
178 D. M. Wright et al.: Spectral width features associated with ULF wave signatures in artificial HF radar backscatter also noted that the latitudinal extent of the EMIC waves was
essentially the same as that for the long-period ULF waves, both of which, in their case study, were restricted to about 1◦of latitude. The BWP model has been discounted by these authors for the events they describe, since the combination of the calculated group velocity for the observed wave packets and the repetition period of the Pc1 bursts cannot be recon-ciled within the model.
4.2 HF radar spectral widths
The measured spectral widths associated with HF radar ob-servations are known to exhibit characteristics related to the ionospheric irregularities being diagnosed and to the mech-anism responsible for creating them. The spectral width of a backscattered signal can, for example, permit the distinc-tion between various types of irregularities (e.g. Haldoupis, 1989; Milan and Lester, 2001). Pinnock et al. (1995) has shown that HF radar spectral widths provide a useful way of identifying the location of the ionospheric signature of the magnetospheric cusp. The spectral widths associated with cusp scatter are generally high and variable, and are accompanied by variable line of sight velocities. Baker et al. (1995) also reported that these high spectral widths are in reality multicomponent spectra which are not resolved by the fitacf routine. They suggested that the multicomponent spectra were caused by highly variable and turbulent electric fields. Such fields have been identified in the cusp in satellite data in association with strong particle precipitation (Baker et al., 1990). It has also been suggested that the observed cusp spectra may relate to strong variations that have a discrete nature (Hanuise et al., 1991). That implies that the observed spectra could be due to spatial structures, such as velocity shears, with scale sizes less than the size of the radar range cell. Small-scale vortical structures generated by filamentary field-aligned currents (FACs) have also been hypothesised as a potential mechanism for producing multiple velocity com-ponents inside a radar range cell (Andr´e et al., 2000a). In this case the vortex would be maintained by a current, the result of a diverging electric field at the bottom of the field-aligned components of the FAC. Under these conditions, the irreg-ularities required for radar backscatter may be generated by the current convective instability (Ossakow and Chaturvedi, 1979).
Fast temporal changes inside a radar range cell can also cause high spectral widths. This is a result of aliasing, where a structure is changing faster than can be sampled by the radar. Currently, SuperDARN radars have a pulse repetition rate of approximately 0.1 s, and these data generally are inte-grated up to at least 1 s. With this in mind Andr´e et al. (1999, 2000a, b) modelled the possible causes of the high spectral widths observed in the cusp. They compared simulations of micro-scale turbulence, velocity shears due to, for example, small-scale vortices and high frequency Pc1 wave activity. They concluded that although any of the mechanisms could result in increased spectral widths, only Pc1 wave activity would be able to generate the very high spectral widths
(typ-ically > 350m s−1) observed in the cusp. They also found
their modelling results to be consistent with spacecraft and ground magnetometer observations of wave activity inside the cusp. The modelling indicated that although a threshold wave amplitude, which is frequency dependent (see Plate 1 of Andr´e et al., 1999), must be exceeded to affect the radar data, this threshold was much lower than the wave ampli-tudes observed by spacecraft. However, Ponomarenko and Waters (2002) have identified a potential weakness in the modelling code employed by Andr´e et al. (1999). Pono-marenko and Waters (2002) state that the time-independent velocity utilised in the model causes a nonlinear growth of the wave amplitude with time. This leads to the large spec-tral widths associated with the model results. By assuming a time-dependent (e.g. a sinusoidal) velocity variation associ-ated with the ion-cyclotron waves, an upper limit of around 100m s−1is imposed on the observed radar spectral widths.
This implies that the high spectral widths (> 350m s−1)
as-sociated with cusp scatter are not related to Pc1 wave activity. Instead, Ponomarenko and Waters (2002) suggest that short scale spatio-temporal structures, caused by particle precipi-tation inside a radar range cell, are more likely to produce the observed effects. However, both phenomena remain pos-sible candidates for the observations presented in this paper, since the spectral widths enhancements reported here do not exceed 100m s−1.
4.3 The OUCH experiments
Data from three OUCH experimental campaigns occurring in the interval 1998-9, representing approximately 50 h of ex-periments, have been employed in this study. Examination of these data clearly indicates numerous intervals when high-m particle-driven waves in the Pc4-5 frequency range are de-tected by the CUTLASS radars in the ionosphere, while op-erating in a high spatial and temporal resolution mode. In-creases in the radar spectral width parameter and Pc1 (ion-cyclotron) wave power measured at the ground are also si-multaneously observed. These features are coincident in time, as is apparent in Figs. 3 and 7. In addition, there is a correlation between the region of increased spectral width and Pc4 wave modulation of the flows inside the heated re-gion. In the same sense as common spatial boundaries have been identified in the data, marked A-E in Fig. 3, such bound-aries are also evident in Fig. 7. For example, both effects are restricted to the lower half of the region of artificial scat-ter from 07:15–07:40 UT. This relationship is commonly ob-served throughout the OUCH data set. A comparison of Pc1 spectral power measured on the ground in Kilpisj¨arvi as a function of the spectral widths of CUTLASS Finland data during OUCH experiments is reproduced in Fig. 9. All use-ful data from 1998-9 have been employed in the plot – that is to say all data where both KIL and CUTLASS measure-ments exist. The KIL data are presented as the sum of both the H - and D-component powers, totalled over the frequency range 0.2–2 Hz. The spectral widths indicate the mean value of all available range gates along beam 5 sampling artificial
D. M. Wright et al.: Spectral width features associated with ULF wave signatures in artificial HF radar backscatter 179 irregularities. One-minute averages of the data are plotted on
Fig. 9. Overlaid on this plot are the data points derived ex-clusively from the intervals shown in Figs. 3, 7 and 8. These points have been colour coded such that known CUTLASS data intervals where there is no particle-driven wave activ-ity are coloured blue, and red points represent obvious inter-vals when high-m waves were observed in CUTLASS line of sight velocities. For the most part the “quiet time” data (blue) are clustered around the low Pc1 power-low widths’ part of the plot. The “active” data (red), on the other hand, are not confined to this region of the plot and are spread such that there are more points at higher spectral widths and Pc1 powers. However, the broader picture, provided by the total data set shown in Fig. 9, is clearly more randomly spread. Figure 9, therefore, does not provide a clear case in support of the hypothesis that increased spectral widths generally oc-cur when there are also enhancements in Pc1 wave activity. There are a number of possible explanations that a defini-tive relationship is not apparent. It is likely that some of the radar observations may be contaminated not only by other unrelated phenomena which increase the spectral width, but also by noise. In addition, the pulsation magnetometer is not ideally located for this study. Its position, some 90 km south-east of Tromsø and right at the edge of the ground projected heated region (see Fig. 2), suggests that it might not detect all Pc1 waves even if they did occur simultaneously with Pc4 activity detected by the radar inside the region of artifi-cial irregularities. The location of KIL could be particularly detrimental for intervals of Pc4 wave activity localised to the poleward edge of the patch of artificial CUTLASS backscat-ter (e.g. 12:20–12:45 UT on 15 October 1998; see Fig. 3). Pc1 waves are also known to duct away from their source regions inside ionospheric waves guides (Duong and Fraser, 1976; Altman and Fijalkow, 1980; Fraser et al., 1989) and so the Pc1 energy may never actually reach the ground at Kilpisj¨arvi. In an attempt to resolve this issue, another pul-sation magnetometer has recently been deployed in Tromsø for use in future experiments. Data from this instrument will be the subject of a future paper.
Mursula et al. (1999, 2001) reported a Pc1 “pearl” event (a structured Pc1 wave appearing as repetitive bursts of wave energy) which occurred simultaneously with Pc4 wave ac-tivity. The Pc1 burst repetition period closely matched the Pc4 wave period. Examination of electric and magnetic field and plasma data from the Polar spacecraft indicated that the Pc1 source region was localised to about 1◦of latitude in the
vicinity of the plasmapause. This was supported by observa-tions from pulsation magnetometers on the ground, includ-ing KIL. They suggested that the narrowness of the region over which Pc1s were observed may have been the result of either a narrow wave source region or the waves remaining relatively field guided as they propagate towards the Earth. The latter would require the existence of appropriate plasma gradients. Simultaneously, the IMAGE network of magne-tometers detected a Pc4 event, the latitudinal amplitude pro-file of which indicated a similarly narrow source region at about the same latitude. The Pc4 wave contained a mixture
0 20 40 60 80 100 0 1 2 3 4 5 Power (x10 -4) 1030 points 0 20 40 60 80 100 Spectral Width (m s-1) 0 1 2 3 4 5
SUPERDARN PARAMETER PLOT
Hankasalmi: Spectral Width vs Summed H+D Pc1 PowerFigure 9
Fig. 9. A comparison of summed H -and D-component Pc1 power
measured by KIL and the mean spectral width measured by CUT-LASS across the region of artificial scatter observed along beam 5 of the Finland radar. The total data set (black pluses) were de-rived from all OUCH experiments in the years 1998–9 and rep-resent 1-min averaged values (1030 points in total) on all occa-sions when data were available. Also highlighted are the data com-piled from Figs. 3, 7 and 8 when the spectral widths were very low (blue pluses) and increased coincident with Pc4 wave activity (red pluses).
of toroidal and poloidal modes. The findings of these au-thors are in agreement with those presented here. The radar data clearly show Pc4 signatures and spectral width features which are of the order of 1◦of latitude or less (Fig. 3). This localisation would also be expected to affect the KIL mea-surements, as discussed earlier.
Although the papers by Mursula et al. (1999, 2001) de-scribe observations of EMIC waves around the plasma-pause, the ULF wave model of EMIC wave modulation has also been applied to high latitude observations (Plyasova-Bakounina et al., 1996). It is believed that the longer period ULF waves modulate the plasma parameters in the magne-tosphere, and this is the key to coupling the two-wave types. In particular, there is evidence which indicates that it is the oscillation of the plasma density which is principally impor-tant. Mursula et al. (2001) state that plasma density varia-tions at the ULF wave frequency were also detected by Polar during their event. These authors suggest that an E × B drift driven by the azimuthal component of the electric field is likely to cause radial plasma density variations. Gradi-ents in plasma density are also known to be important in Pc1 propagation, which is why they are reported to occur most commonly around the plasmapause.
Recent studies of particle-driven ULF waves (Wright et al., 2001; Yeoman and Wright, 2001; Baddeley et al., 2002) have demonstrated that the types of Pc4 waves observed by the artificial backscatter technique (see Figs. 3 and 7) are the result of a drift-bounce resonant interaction between the drifting energetic protons, which constitute part of the ring current, and suitable field line eigenmodes or one of their
180 D. M. Wright et al.: Spectral width features associated with ULF wave signatures in artificial HF radar backscatter harmonics. In such cases the drifting plasma must exhibit a
non-Maxwellian ion energy distribution, in order to provide the free energy for wave growth. Such unstable ion distri-bution functions occur commonly in the collisionless plasma of the ring current. For all of the events reported by these authors, it has been demonstrated that protons with energies around 10 keV were involved in the resonant interactions. It is not unreasonable to suggest, therefore, that those same par-ticles are also the energy source for the Pc1 waves. It is al-ready well known that such particle energies are responsible for Pc1 generation beyond the plasmapause at L ≈ 6 (e.g. Cornwall, 1965; Thorne, 1972).
5 Summary
The data presented in this paper indicate a link between the observed occurrence of drift-bounce resonant Pc4 waves and relatively high frequency Pc1 waves at high latitudes. This study has identified the following points to support this:
1. Increased spectral widths frequently coincide with ob-servations of particle-driven Pc4 waves.
2. The regions of Pc4 activity and enhanced spectral widths share common spatial boundaries.
3. Simultaneous enhancements in Pc1 power are detected on the ground, by magnetometers, during the observed Pc4 events.
4. Both Pc1 waves detected in space and on the ground, and the Pc4 waves observed in the OUCH experiments are spatially localised, sometimes to 1◦of latitude. 5. Modelling results demonstrate that Pc1 waves are a
potential candidate for causing high HF radar spectral widths at high latitudes.
6. The energies of drifting ring current protons required to generate both Pc1s and Pc4s at high latitudes are the same.
7. Recent modelling work suggests that Pc4 waves may also be intimately involved in the generation of Pc1 bursts.
It seems likely that the events presented in the current pa-per are best described by the action of long-pa-period (Pc4/5) ULF waves on the ion-cyclotron wave source region in the magnetosphere, and that the current observations are related to those reported by Plyasova-Bakounina et al. (1996), sula et al. (1997, 1999, 2001) and Rasinkangas and Mur-sula (1998). This study presents multiple occurrences of Pc4 waves driven by wave-particle interactions in the magneto-sphere, simultaneously with broadened spectral widths and increases in Pc1 activity.
In accordance with the modelling work of Andr´e et al. (1999, 2000a, b) and Ponomarenko and Waters (2002), the most likely explanation for the spectral width observations
during the Pc4 events presented here is that Pc1 waves, in the form of both broad-band ESIC and narrower-band EMIC waves, are responsible for increasing the spectral width of the radar returns. This is a result of temporal aliasing effects caused by the Pc1 activity inside the relatively long sample period of the radar range cells. The magnetospheric cusp region, which is an area of intensive research at present, is often identified by its large and variable spectral widths, as observed by coherent HF radars. It is commonly believed that this is the result of Pc1 waves (mainly broad-band ESIC noise) inside the magnetospheric cusp. However, Pono-marenko and Waters (2002) indicate that spatio-temporal ef-fects relating to particle precipitation localised inside a radar range cell could also cause the observed increases in spectral width. If the source mechanism for wave activity inside the cusp is similar to that for Pc1s observed at lower latitudes, then experiments such as the one described here, which ap-ply the artificial backscatter technique, could be invaluable to the investigation of cusp-type phenomena. This study would seem to support the hypothesis that Pc1 waves play an active role in increasing HF radar spectral widths, since such wave activity is detected simultaneously on the ground. However, spatial effects inside the radar range cells may also be im-portant. The deployment of a new high power HF facility called SPEAR (Space Plasma Exploration by Active Radar; Wright et al., 2000) on Svalbard, which will spend a signif-icant amount of its time underneath the cusp, will hopefully offer an opportunity to employ this technique directly and answer some of the long-standing questions about the cusp.
Acknowledgements. The authors would like to thank the Particle
Physics and Astronomy Research Council (PPARC) for support during this research. We are also grateful to Tilmann Bsinger of the University of Oulu and J. Manninen at the Sod¨ankyl¨a Geophys-ical Observatory for providing Kilpisj¨arvi pulsation magnetome-ter data. CUTLASS operations are supported by PPARC grant PPA/R/R/1997/00256. The EISCAT heater is part of the EISCAT Scientific Association which is supported by research agencies of Finland, France, Germany, Japan, Norway, Sweden and the UK.
Topical Editor T. Pulkkinen thanks T.-B. Leyser and another ref-eree for their help in evaluating this paper.
References
Allan, W., Poulter, E. M., and Nielsen, E.: STARE observations of a Pc5 pulsation with large azimuthal wave number, J. Geophys. Res., 87, 6163, 1982.
Altman, C. and Fijalkow, E.: The horizontal propagation of Pc1 pulsations in the ionosphere, Planet. Space Sci., 28, 61, 1980. Andr´e, R., Pinnock, M., and Rodger, A. S.: On the SuperDARN
autocorrelation function observed in the ionospheric cusp, Geo-phys. Res. Lett., 26, 3353, 1999.
Andr´e, R., Pinnock, M., and Rodger, A. S.: Identification of the low-altitude cusp by Super Dual Auroral Radar Network radars: A physical explanation for the empirically derived signature, J. Geophys. Res., 105, 27 081, 2000a.
Andr´e, R., Pinnock, M., Villain, J.-P., and Hanuise, C.: On the factors conditioning the Doppler spectral width determined from SuperDARN HF radars, Int. J. Geomag. Aeron., 2, 77, 2000b.
D. M. Wright et al.: Spectral width features associated with ULF wave signatures in artificial HF radar backscatter 181 Baddeley, L. J., Yeoman, T. K., Wright, D. M., Davies, J. A.,
Trat-tner, K. J., and Roeder, J. L.: Morning sector drift-bounce res-onance driven ULF waves observed in artificially-induced HF radar backscatter, Ann. Geophysicae, 20, 1487, 2002.
Baker, K. B., Greenwald, R. A., Ruohoniemi, J. M., Dudeney, J. R., Pinnock, M., Newell, P. T., Greenspan, M. E., and Meng, C.-I.: Simultaneous HF-radar and DMSP observations of the cusp, Geophys. Res. Lett., 17, 1869, 1990.
Baker, K. B., Dudeney, J. R., Greenwald, R. A., Pinnock, M., Newell, P. T., Rodger, A. S., Mattin, N., and Meng, C.-I.: HF radar signatures of the cusp and low-latitude boundary layer, J. Geophys. Res., 100, 7671, 1995.
Cornwall, J. M.: Cyclotron instabilities and electromagnetic emis-sion in the ultra low frequency and very low frequency ranges, J. Geophys. Res., 70, 61, 1965.
Curtis, S. A., Hoegy, W. R., Brace, L. H., Maynard, N. C., Sugiura, M., and Winningham, J. D.: DE-2 cusp observations: role of plasma instabilities in topside ionospheric heating and density fluctuations, Geophys. Res. Lett., 9, 997, 1982.
Duong, M. D. and Fraser, B. J.: Ducted propagation of hydromag-netic waves in the upper ionosphere, Planet. Space Sci., 24, 1195, 1976.
Fraser, B. J., Kemp, W. J., and Webster, D. J.: Ground-satellite study of a Pc 1 ion cyclotron wave event, J. Geophys. Res., 94, 11 855, 1989.
Gail, W. B.: Theory of electromagnetic cyclotron wave growth in a time-varying magnetoplasma, J. Geophys. Res., 95, 19 089, 1990.
Greenwald, R. A., Baker, K. B., Dudeney, J. R., Pinnock, M., Jones, T. B., Thomas, E. C., Villain, J.-P., Cerisier, J.-C., Senior, C., Hanuise, C., Hunsucker, R. D., Sofko, G., Koehler, J., Nielsen, E., Pellinen, R., Walker, A. D. M., Sato, N., and Yamagishi, H.: DARN/SuperDARN: a global view of the dynamics of high-latitude convection, Space Sci. Rev., 71, 761, 1995.
Gurnett, D. A.: Auroral plasma waves, in: Auroral Physics, edited by Meng, C.-I., Rycroft, M. J., and Frank, L. A., Cambridge University Press, 1991.
Haldoupis, C.: A review on radio studies of auroral E-region iono-spheric irregularities, Ann. Geophysicae, 7, 239, 1989.
Hanuise, C., Villain, J.-P., Cerisier, J.-C., Senior, C., Ruohoniemi, J. M., Greenwald, R. A., and Baker, K. B.: Statistical study of high-latitude E-region Doppler spectra obtained with the SHERPA HF radar, Ann. Geophysicae, 9, 273, 1991.
Hughes, W. J.: Hydromagnetic waves in the magnetosphere, in: So-lar Terrestrial Physics, edited by Carovillano, R. L. and Forbes, J. M., Reidel, Dordrecht, 1983.
Hughes, W. J. and Southwood, D. J.: The screening of micropulsa-tion signals by the atmosphere and ionosphere, J. Geophys. Res., 81, 3234, 1976.
Kennel, C. F. and Petschek, H. E.: Limit on stably trapped particle fluxes, J. Geophys. Res., 71, 1, 1966.
Lester, M., Milan, S. E., Besser, V., and Smith, R.: A case study of HF radar spectra and 630.0 nm auroral emission in the pre midnight sector, Ann. Geophysicae, 19, 327, 2001.
Maynard, N. C.: Structure in the DC and AC electric fields asso-ciated with the dayside cusp region, in: The polar cusp, edited by Holtet, J. A. and Egeland, A., D. Reidel publishing company, 305, 1985.
Milan, S.E. and Lester, M.: Interhemispheric differences in the HF radar signature of the cusp region. A review through the study of a case example, Adv. in Polar Upper Atmos. Res., 15, 159–177, 2001.
Milan, S. E., Yeoman, T. K., Lester, M., Thomas, E. C., and Jones, T. B.: Initial backscatter occurrence statistics from the CUT-LASS HF radars, Ann. Geophysicae, 15, 703, 1997.
Mursula, K., Kangas, J., and Pikkarainen, T.: Pc1 micropulsations at a high-latitude station: a study over nearly four solar cycles, J. Geophys. Res., 96, 17 651, 1991.
Mursula, K., Rasinkangas, R., B¨osinger, T., Erlandsen, R. E., and Lindqvist, P.-A.: Nonbouncing Pc1 wave bursts, J. Geophys. Res., 102, 17 611, 1997.
Mursula, K., Br¨aysy, T., Rasinkangas, R., Tanskanen, P., and Mozer, F.: A modulated multiband Pc1 event observed by Polar/EFI around the plasmapause, Adv. Space Res., 24, 81, 1999. Mursula, K., Br¨aysy, T., Niskala, K., and Russell, C. T.: Pc1 pearls
revisited: structured electromagnetic ion cyclotron waves on Po-lar satellite and on ground, J. Geophys. Res., 106, 29 543, 2001. Obayashi, T.: Hydromagnetic whistlers, J. Geophys. Res., 70, 1069,
1965.
Ossakow, S. L. and Chaturvedi, P. K.: Current convective instability in the diffuse aurora, Geophys. Res. Lett., 6, 332, 1979. Pinnock, M., Rodger, A. S., Dudeney, J. R., Rich, F., and Baker,
K. B.: High spatial and temporal resolution observations of the ionospheric cusp, Ann. Geophysicae, 13, 919, 1995.
Plyasova-Bakounina, R. L., Kangas, J., Mursula, K., Molchakov, O. A., and Green, J. A.: Pc 1-2 and Pc 4-5 pulsations observed at a network of high-latitude stations, J. Geophys. Res., 101, 10 965, 1996.
Ponomarenko, P. V., Leyser, T. B., and Thid´e, B.: New electron gy-roharmonic effects in HF scatter from pump-excited magnetic field-aligned ionospheric irregularities, J. Geophys. Res., 104, 10 081, 1999.
Ponomarenko, P. V. and Waters, C. L.: The role of Pc1-2 waves in spectral broadening of SuperDARN echoes from high latitudes, Geophys. Res. Lett., 30, 1122, 2002.
Rasinkangas, R. and Mursula, K.: Modulation of magnetospheric EMIC waves by Pc3 pulsations of upstream origin, Geophys. Res. Lett., 25, 869, 1998.
Rietveld, M. T., Kohl, H., Kopka, H., and Stubbe, P.: Introduction to ionospheric heating at Tromsø – I. Experimental overview, J. Atmos. Terr. Phys., 55, 577, 1993.
Robinson, T. R.: The heating of the high latitude ionosphere by high power radio waves, Phys. Rep., 179, 79, 1989.
Robinson, T. R., Stocker, A. J., Bond, G. E., Eglitis, P., Wright, D. M., and Jones, T. B.: O- and X-mode heating effects observed simultaneously with the CUTLASS and EISCAT radars and low power HF diagnostics at Tromsø, Ann. Geophysicae, 15, 134, 1997.
Roth, B. and Orr, D.: Locating the Pc1 generation region by a sta-tistical analysis of ground-based observations, Planet. Space Sci., 23, 993, 1975.
Thorne, R. M.: Stormtime instabilities in the ring current, in: Mag-netosphere ionosphere interactions, edited by Folkestad, K., Uni-versity Press, Oslo, 185, 1972.
Thorne, R. M.: Microscopic plasma processes in the Jovian mag-netosphere, in: Physics of the Jovian magmag-netosphere, edited by Dessler, A. J., Cambridge University Press, 454, 1983.
Villain J.-P., Greenwald, R. A., Baker, K. B., and Ruohoniemi, J. M.: HF radar observations of E-region plasma irregularities produced by oblique electron streaming, J. Geophys. Res., 92, 12 327, 1987.
Villain J.-P., Andr´e, R., Hanuise, C., and Gresillon, D.: Observation of the high latitude ionosphere by HF radars: Interpretation in terms of collective wave scattering and characterization of
turbu-182 D. M. Wright et al.: Spectral width features associated with ULF wave signatures in artificial HF radar backscatter lence, J. Atmos. Terres. Phys., 58, 943, 1996.
Woodfield, E. E., Davies, J. A., Eglitis, P., and Lester, M.: High and variable spectral width in the pre-dawn sector: A case study involving CUTLASS, EISCAT, ESR and optical data, Ann. Geo-physicae, 20, 501, 2002.
Wright, D. M. and Yeoman, T. K.: CUTLASS observations of a high-m ULF wave and its consequences for the DOPE HF Doppler sounder, Ann. Geophysicae, 17, 1493, 1999a.
Wright, D. M. and Yeoman, T. K.: High resolution bistatic HF radar observations of ULF waves in artificially generated backscatter, Geophys. Res. Lett., 26, 2825, 1999b.
Wright, D. M., Davies, J. A., Robinson, T. R., Chapman, P. J., Yeo-man, T. K., Thomas, E. C., Lester, M., Cowley, S. W. H., Stocker, A. J., Horne, R. B., and Honary, F.: Space Plasma Exploration by Active Radar (SPEAR): an overview of a future radar facility,
Ann. Geophysicae, 18, 1248, 2000.
Wright, D. M., Yeoman, T. K., Rae, I. J., Storey, J., Stockton-Chalk, A. B., Roeder, J. L., and Trattner, K. J.: Ground-based and Polar spacecraft observations of a giant (Pg) pulsation and its associ-ated source mechanism, J. Geophys. Res., 106, 10 837, 2001. Yeoman, T. K. and Wright, D. M.: ULF waves with drift
reso-nance and drift-bounce resoreso-nance energy sources as observed in artificially-induced HF radar backscatter, Ann. Geophysicae, 19, 159, 2001.
Yeoman, T. K., Wright, D. M., Robinson, T. R., Davies, J. A., and Rietveld, M. T.: High spatial and temporal resolution observa-tions of an impulse-driven field line resonance in radar backscat-ter artificially generated with the Tromsø heabackscat-ter, Ann. Geophys-icae, 15, 634, 1997.