HAL Id: hal-00317746
https://hal.archives-ouvertes.fr/hal-00317746
Submitted on 29 Nov 2005
HAL is a multi-disciplinary open access
archive for the deposit and dissemination of
sci-entific research documents, whether they are
pub-lished or not. The documents may come from
teaching and research institutions in France or
abroad, or from public or private research centers.
L’archive ouverte pluridisciplinaire HAL, est
destinée au dépôt et à la diffusion de documents
scientifiques de niveau recherche, publiés ou non,
émanant des établissements d’enseignement et de
recherche français ou étrangers, des laboratoires
publics ou privés.
Secondary circulation within a tropical cyclone observed
with L-band wind profilers
M. Teshiba, M. D. Yamanaka, H. Hashiguchi, Y. Shibagaki, Y. Ohno, S.
Fukao
To cite this version:
M. Teshiba, M. D. Yamanaka, H. Hashiguchi, Y. Shibagaki, Y. Ohno, et al.. Secondary
circula-tion within a tropical cyclone observed with L-band wind profilers. Annales Geophysicae, European
Geosciences Union, 2005, 22 (11), pp.3951-3958. �hal-00317746�
SRef-ID: 1432-0576/ag/2004-22-3951 © European Geosciences Union 2004
Annales
Geophysicae
Secondary circulation within a tropical cyclone observed with
L-band wind profilers
M. Teshiba1, M. D. Yamanaka2,3, H. Hashiguchi1, Y. Shibagaki4, Y. Ohno5, and S. Fukao1
1Research Institute for Sustainable Humanosphere, Kyoto University, Uji, Kyoto 611-0011, Japan 2Graduate School of Science and Technology, Kobe University, Kobe 657-8501, Japan
3Institute of Observational Research for Global Change, Japan Agency for Marine-Earth Science and Technology,
Yokohama 236-0001, Japan
4Osaka Electro-Communication University, Neyagawa, Osaka 572–8530, Japan
5National Institute of Information and Communications Technology, Koganei, Tokyo 184–8795, Japan
Received: 3 December 2003 – Revised: 4 June 2004 – Accepted: 21 June 2004 – Published: 29 November 2004 Part of Special Issue “10th International Workshop on Technical and Scientific Aspects of MST Radar (MST10)”
Abstract. In association with the passage of a Tropical Cy-clone (TC) around Japan, the secondary circulation in the region from the outer side to the center was investigated in detail by two separately located L-band wind profilers and the rawinsonde observations from 1 to 2 October 2002, for the first time. As the wind profilers can observe wind fields not only within rainbands but also in between, the mesoscale wind circulation including the vertical wind component in wide areas from the lower layer to the upper layer was inves-tigated.
While the TC center approached the profiler stations, sev-eral rainbands associated with the TC subsequently passed. Relatively warm, moist inflow with a cyclonic rotation was observed in the lower-troposphere while the TC center ap-proached. The inflow reached the inside of the main rain-band where the updraft was observed. Above 5-km height (with temperature below 0◦C), outflow and weak downdraft corresponding to falling frozen particles were observed. It is considered that the frozen particles formed precipitating clouds mainly in the outer rainband region. The continuous wind circulation transported water vapor from the lower tro-posphere to the upper trotro-posphere via the vicinity of TC cen-ter.
On the other hand, after the passage of the TC center, the developed rainband passed, which was located in the south and southwest quadrant of the TC. It is suggested with the profilers’ data that the rainband was intensified mainly by warm and moist outflow below 3-km height.
Key words. Meteorology and atmospheric dynamics (mesoscale meteorology, convective processes, precipita-tion)
Correspondence to: M. Teshiba
1 Background
Observational studies of Tropical Cyclones (TC) by surface meteorological instruments, balloons, airborne (Jorgensen, 1984a, b; Marks et al., 1987; Powell, 1990a, b; Ryan et al., 1992; Harr and Elsberry, 1996) and ground-based Doppler radars (Sakakibara et al., 1985; Ishihara et al., 1986; Tabata et al., 1992) have made substantial contributions to the under-standing of TC’s structure and dynamics. Jorgensen (1984a, b) reported the precipitating clouds of eyewall, a stratiform rain region, and rainbands, which were observed by an air-borne radar mainly within a radius of 150 km from TC center. Marks et al. (1987) pointed out that the primary circu-lation was characterized by a core of maximum tangential wind, while the secondary circulation in radius-height cross section was characterized by a lower tropospheric layer with inward directed flow and a layer of intense radial outflow from the eyewall concentrated at upper levels. These char-acteristics agree well with theoretical studies by Shapiro and Willoughby (1982) and others. Airborne radars and ground-based Doppler radars can reveal the inner structure of TC, however, the observation is limited to narrow area and can-not be conducted if there is no rain in the observation area. On the other hand, wind profilers continuously enable direct observations of radial, tangential, and vertical wind compo-nents even under the clear-air condition. As a result, pro-vided the time-space conversion is applied, the detailed wind behavior is obtained in wide areas. Shibagaki et al. (2003) showed detailed distributions of tangential and radial winds to examine some mesoscale circulations existing in a TC, with observations by the Middle and Upper (MU) atmo-sphere radar. Moreover, if simultaneous observations of a TC are conducted with multiple spatially-separated wind profil-ers, even mesoscale disturbances within a TC and their rapid changes can also be investigated by comparing the data be-tween the stations.
3952 M. Teshiba et al.: Secondary circulation within a tropical cyclone observed with L-band wind profilers
Table 1. Specification of the Lower Troposphere Radar (LTR) of
WINDAS.
Operational Frequency 1357.5 MHz
Peak Power 3 kW
Beam Width 3◦
Antenna Phased Array System
Antenna Aparture 16 m2
Beam Direction (Az, Ze) = (0.0), (0.15), (90.15), (180.15), (270.15)
Time Resolution 1 min Height Resolution 300 m
Fig. 1. The trajectory of TC Higos (0221). Cross (×) signs
indi-cate the position of the TC center every hour. Plus (+) and trian-gle (4) signs indicate the positions of the two WINDAS stations and the radiosonde observatory, respectively. The distance and time of the TC center closest to Mito (A) WINDAS station were about 13 km and 21:40 LT, respectively. In the case of the Katsuura (B) station, the distance and time of closest approach were 80 km and 20:10 LT, respectively. The Tateno (S) radiosonde station was lo-cated about 50 km southwest of Mito (A). A topographical map around the Kanto plain is also indicated.
We consider that detailed wind variations around TC cen-ter need to be investigated with observational data, but there is often no rain, and any observation except that of wind profilers cannot show wind variations with high time and height resolution. The resolutions provided by numerical simulations are not sufficient to investigate the detailed wind changes in a TC center region. The TC, Typhoon 0221 (Hi-gos), passed across Japan on 1 to 2 October 2002, preserv-ing its strong primary vorticity. In Japan, thirty-one L-band (1.3 GHz frequency) wind profilers have been operated by
Fig. 2. Sea surface pressure at 21:00 LT on 1 October 2002,
pro-vided by JMA. The cross (×) sign indicates the position of the TC center.
Fig. 3. Same as Fig. 2 except for geopotential height (contour) and
horizontal wind (arrows) at 200 hPa.
the Japan Meteorological Agency (JMA) since June 2002. While the TC moved along the Japan Islands, some of the wind profilers could observe the associated wind field. In particular, since there was no rain within a radius of about 100 km from the TC center at Mito (36.38◦E, 140.47◦N, 29 m in MSL) and Katsuura (35.15◦E, 140.31◦N, 12 m in MSL) stations, the circulations corresponding to the TC could be investigated only using the operational wind pro-filer data.
This paper describes the kinematic structure of the TC, Ty-phoon Higos (0221), by using various observational data on 1 to 2 October 2002. Additionally, the circulation from lower to upper heights is discussed in the context of the profilers’ observations of the vertical wind motion, as well as the hori-zontal wind components.
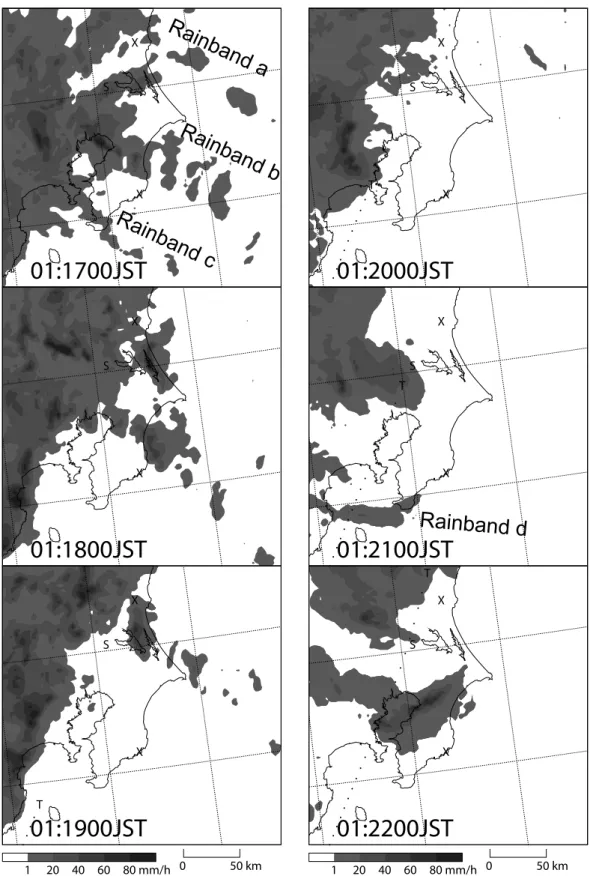
Fig. 4. Hourly maps of C-band radar reflectivity at the 2-km level observed during the period 17:00 to 22:00 LT. The two WINDAS stations
3954 M. Teshiba et al.: Secondary circulation within a tropical cyclone observed with L-band wind profilers
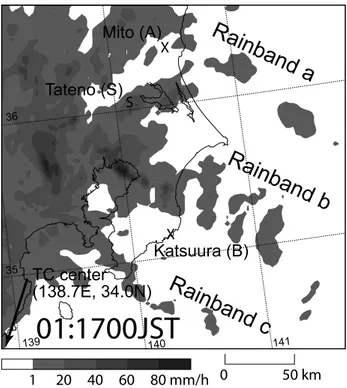
Fig. 5. C-band radar reflectivity at the 2-km level in the Kanto Plain
observed at 17:00 LT. The main rainbands associated with the TC are also shown.
2 Observation data
The two L-band (1.3 GHz) wind profilers, parts of WINDAS (Wind profiler Network and Data Acquisition System; Ishi-hara and Goda, 2000; IshiIshi-hara et al., 2003) of the Japan Meteorological Agency (JMA), are able to show the wind field from the outer rainband to the storm center in detail. We used the two wind profilers’ data because the two profil-ers did not observe not the orographic rainbands, but rather they observed the TC associated ones. The specification of the radars is shown in Table 1. The horizontal wind com-ponent is calculated from the oblique beams of opposite di-rections. Moreover, operational C-band (5.6 GHz) meteoro-logical radar and radiosonde data are used to show the rela-tionship between wind behavior and rainbands. Rawinsonde observations were also conducted at Tateno near the two pro-filers’ stations to obtain some profiles of temperature and hu-midity.
A topographic map around the Kanto Plain in the eastern Japan, and the locations of the two profilers (Mito and Kat-suura) and a radiosonde station (Tateno) are shown in Fig. 1. The Kanto Plain, whose area is about 150 km×150 km, is surrounded by mountains on the west and north sides.
The horizontal wind velocity relative to a TC center on the surface is examined by the speed of the TC movement es-timated from the spline interpolation of the locations of the TC center, which were reported by JMA every one or three hour(s). Then, the horizontal wind is applied to the cylin-drical coordinates relative to the TC center, and decomposed into the radial and tangential wind components.
Wind profilers provide a vertical profile of three compo-nents of the wind velocity vector below about 7–4 km height continuously with high time and range resolutions under clear-air conditions. The existence of precipitating particles as scatters for radar beams makes it possible to infer hor-izontal wind components up to the higher height of about 10 km than that under clear-air conditions. However, as for the vertical wind component, the wind profiler detects not only the vertical wind of the air but also the falling speed of precipitating particles because high frequency radars are more sensitive to the particles than the clear air. If an ob-served vertical wind component is negative (downdraft) and the echo intensity is large, it is considered that the negative vertical wind is mainly caused by the falling speed. In this study, a positive vertical wind is considered to be an updraft, but a negative wind cannot be identified as either a downdraft or falling rain particles. Even admitting this defect, the data are important to examine characteristics of water circulation associated with TC.
3 Synoptic situation and rainband distribution 3.1 Large-scale structure of TC
The moving path of the TC is shown in Fig. 1. The TC came from the south of Japan, and moved to the north. The profiler stations concerned with this study are located on the flat plain (as shown in Fig. 1), and the southeasterly wind in approach-ing the TC is mainly observed, where the wind blows from the ocean. Therefore, the observed echoes were not affected or forced by mountains, but caused by the TC. The central pressure of the TC reported by JMA was 960 hPa at landfall and 965 hPa at 21:00 LT (Local Time = UTC + 9) on 1 Oc-tober 2002 (Fig. 2). The mid- and upper-tropospheric trough was located in the East China Sea, as shown in Fig. 3. The northeastward jet stream flew in the Japan Sea, about a thou-sand kilometers northwest of the TC center. The trough ex-tended from the Chinese continent to the East China Sea, and was nearly stagnant for the next six hours. The TC moved into the baroclinic zone of the trough.
3.2 Rainband structure
The rain distribution in Fig. 4 shows three distinct rain-bands on the eastern side of the outer and inner rainband (the northeast quadrant of the TC center). A part of so-called “Delta Rain Shield” (Willoughby et al., 1984) is dis-tributed widely in the west of the Kanto plain. Another rain-band (d) was observed in the southwest quadrant of the TC. The detailed structures of these rainbands are distinguished in Fig. 5. The main rainbands (a, b, and c) extended in the northwest-southeast direction, perpendicular to the moving direction of the TC center on the ground. The rainbands had some ten kilometer width and some hundred kilometer length. The individual precipitating clouds were also em-bedded in the rainbands. Rainband b and c merged into one
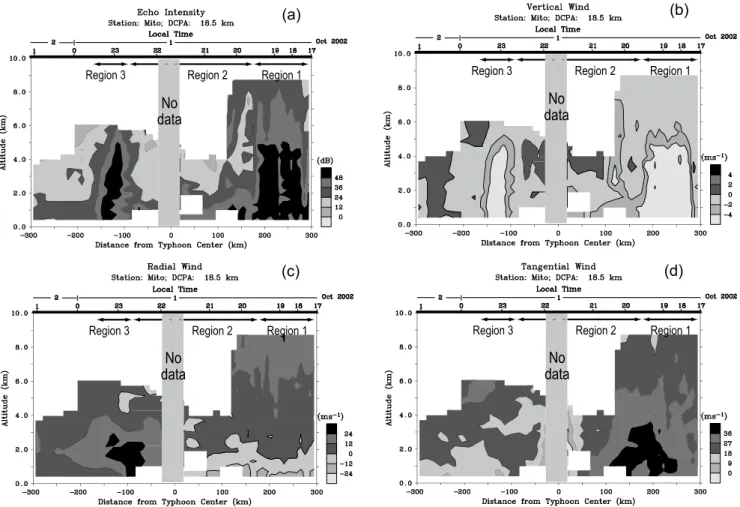
Fig. 6. Radius-height cross-sections of (a) echo intensity, (b) vertical wind, (c) radial wind, and (d) tangential wind components at Mito
(A) station. Positive values of vertical, radial, and tangential wind indicate updraft, outflow, and cyclonic wind, respectively. A positive (negative) value of radius of the TC center corresponds to the period when the TC approaches (leaves). There is no data observed within 18 km in distance because the distance is that the TC approached closest to the observatory.
around 18:00–19:00 LT as they moved northeastward. Rain-band c before merging is associated with the inner rainRain-band of the TC (Willoughby et al., 1984).
4 Characteristics of storm-relative wind behavior Radius-height cross sections of signal-to-noise (SN) ratio (referred to as “echo intensity”) of the vertical beam, vertical wind, storm-relative radial and tangential wind components are used in Figs. 6 and 7 to investigate wind changes associ-ated with the TC and rainbands. The distance closest to the TC center approach at Mito and Katsuura is about 18.5 and 64.5 km, respectively. Therefore, the wind behavior within the distance cannot be observed. A positive (negative) value of the radius of the TC center means that the TC approaches (leaves) the respective stations. The periods during which the TC approaches and leaves the stations are referred to as the period “in the front side” and “in the rear side”, respectively. Characteristics of the wind changes during the passage of the rainbands are analyzed in the Regions labelled 1–3. The fluc-tuating components of the horizontal wind relative to the TC
center are included in the time change of the TC, as well as the asymmetric structure.
The main rainbands passed Region 1, one after another, and seemed to consist of convective precipitating clouds be-cause strong reflectivity echo extended vertically. Figure 6c indicates that inflow and outflow are seen below and above 2 km height, respectively, while the TC was approaching the radar site. Similar features of radial wind were found in Fig. 7, and also reported by Jorgensen (1984a), Tabata et al. (1992), Teshiba et al. (2001), and Shibagaki et al. (2003). Cyclonic winds gradually became stronger in time over both stations, and, in particular, the horizontal gradient of the cy-clonic wind was large in the main rainbands, that is the rain-bands were developed where the horizontal shear of the cy-clonic wind was strong. On the other hand, the vertical gra-dient was small relative to the horizontal one. As shown in Fig. 6, the maximum cyclonic wind was seen in the inner edge of Region 1 during the period 19:00 to 21:00 LT, espe-cially below 3 km height. The strong echo region extended vertically, not like the outward slope, as represented by Jor-gensen (1984a). The strong radar reflectivity in Region 1 was
3956 M. Teshiba et al.: Secondary circulation within a tropical cyclone observed with L-band wind profilers
Fig. 7. Same as Fig. 6 but for the results at Katsuura (B) station. There is no data observed within 65 km in distance.
Fig. 8. Vertical profiles of potential temperature (θ ; solid),
equiv-alent potential temperature (θe; bold), and saturated equivalent
po-tential temperature (θe∗; dashed) at Tateno (S) station at (a) 21:00 and (b) 22:00 LT on 1 October. The distance from the TC center to (a) and (b) was about 20 km in the front side and 80 km in the rear side, respectively. The small difference of θeand θe∗at every height
indicates the high humidity.
associated with the large precipitating particles and the devel-oped (or developing) clouds. Above 5-km height, where rel-atively strong echos were observed and the temperature was below 0◦C, weak downdraft was also observed. This may show that small frozen particles fell down or weak downdraft existed there. These characteristics are also seen at Katsuura in Fig. 7, especially when relatively strong inflow and the cyclonic wind were caused by the strong TC circulation.
After the passage of the main rainbands (Region 2), the cy-clonic wind was quite weak relative to that in Region 1, and as shown in Fig. 6, a weak cyclonic wind was found. Particu-larly within about 30 km from the TC center, a weak cyclonic and radial wind was observed. Weak updraft and downdraft was clear above and below the 3-km height, respectively. On the other hand, at Katsuura (B) station (Fig. 7), a pronounced updraft was seen in all layers below 6-km height. This up-draft was stronger than that at Mito (A), which was also as-sociated with strong vorticity. In Region 2, echo intensity was weak relative to that in Region 1, so there was little rain. The operational weather radar of JMA also observed little rain around Mito, Katsuura, and Tateno stations in Region 2, as shown in Fig. 5. A saturated but stable layer existed below the 3.2-km level, judging from θe and θe∗ profiles in
at Tateno and located about 20 km in the front side of the TC. Therefore, an updraft in Region 2 was made by not the convection, but by the TC. Even if an updraft existed and the humidity was high, because the thermal stratification was stable, clouds in Region 2 were not developed. On the other hand, a high humidity layer was observed in almost all lay-ers. Therefore, an updraft transported water vapor from the lower height to the higher height.
To summarize the TC structure in its front side, both com-parison between these two stations and the association with the wind changes and the in-situ profiles of temperature and humidity made it clear that the updraft in Region 2 played an important role for transportation of the moist air from the lower layer to the upper layer. It was also revealed that the moist air was transported from the outside region with inflow in the lower troposphere to the outside with outflow in the middle and upper troposphere. It is considered that the rain-fall in the front side of the TC was caused by rain-falling frozen particles from the upper-troposphere, which were transported from the inner side of the TC. That circulation was stronger at Katsuura (B) station than that at Mito (A) station because of the strong TC vorticity.
After the passage of the TC center in Region 2, outflow toward the rainband in Region 3 was strong, especially below 3 km height, as shown in Fig. 6. However, inflow and outflow were found below and above 4 km height, respectively, in Fig. 7, that is in the inner side of the rainband in Region 3, horizontal convergence and divergence zones were formed at Mito and Katsuura stations, respectively.
After the passage of Region 3, outflow was observed in the middle and lower troposphere. This outflow was espe-cially strong below the 3-km height in the inner edge of the high radar reflectivity region (Fig. 6) located in the south-west quadrant of the TC center. The characteristic mentioned above is not observed in Fig. 7, and the height of the high echo intensity region was relatively low, and outflow was weak in Region 3.
In Fig. 8b, the humidity was high below 1 km when a ra-diosonde was launched at about 80 km in the rear side of the TC center. Active convection existed above the high humid-ity layer from the θeprofile, and therefore, the relatively dry
layer in the height range 1 to 3 km did not mean the exis-tence of dry air advection. It is considered that the convec-tion was active and the humidity was high in almost all lay-ers. Since the TC approached within 13 km of Mito station, the thermal and water vapor profiles at Tateno station were compared with the wind profile at Mito. High humidity was seen in an outflow region and then flew into the rainband in Region 3. The outflow was strong, especially below the 3-km height. Such a strong outflow in the lower troposphere was not observed at Katsuura, and, therefore, the strong outflow contributed to the intensification of the rainband in Region 3.
5 Concluding remarks
The two wind profilers’ and rawinsonde observations regard-ing the TC, Typhoon Higos (0221) made it clear that water vapor was continuously transported from the lower tropo-sphere to the upper tropotropo-sphere, and that the stronger the TC vorticity was, the stronger the secondary radius-height circu-lation was. While the TC approached, convective precipitat-ing clouds passed successively over the station that was lo-cated in the north side of the TC. At the same time, relatively strong inflow and outflow were observed in the lower tro-posphere and upper trotro-posphere, respectively. In particular, outflow and weak downdraft were seen above 5 km height. The latter was associated with the falling of frozen parti-cles. This means that the rainbands in the front side of the TC were formed from the rain particles coming from the TC center region. After the passage of the TC center, a spiral rainband was well developed, and by comparison between the profiler observations, it is considered that the develop-ment of the rainbands was due to the convergence of radial wind at the inner side of the rainbands. This is the first time these characteristics of the secondary circulation and the as-sociation of rainbands with radial convergence are directly observed by wind profilers.
Acknowledgements. The authors thank M. Ishihara, Y. Kato, and
Y. Izumikawa of the Japan Meteorological Agency for provid-ing the WINDAS data. We also thank T. Kato, S. Hayashi, and M. Yoshizaki of the Meteorological Research Institute, Japan Me-teorological Agency for their useful instruments and help. The first author (M. Teshiba) is supported by a grant (15005136) of the Japan Society for the Promotion of Science (JSPS) under the Fellowships for Japanese Junior Scientists. The present study was financially supported by Scientific Grants-in Aids (15005136) of the Ministry of Education, Culture, Sports, Science and Technology of Japan.
Topical Editor O. Boucher thanks two referees for their help in evaluating this paper.
References
Harr, P. A. and Elsberry, R. L.: Structure of a mesoscale convec-tive system embedded in Typhoon Robyn during TCM-93, Mon. Weath. Rev., 124, 634–652, 1996.
Ishihara, M. and Goda, H.: Operational 1.3 GHz-wind profiler net-work of Japan Meteorological Agency, Proceedings of the Ninth International Workshop on Technical and Scientific Aspects of MST Radar, Toulouse, 13–18 March 2000, 538–540, 2000. Ishihara, M., Yanagisawa, Z., Sakakibara, H., Matsuura, K., and
Aoyagi, J.: Structure of a typhoon rainband observed by two Doppler radars, J. Meteor. Soc. Japan, 64, 923–939, 1986. Ishihara, M., Fukao, S., and Hashiguchi, H.: The wind profiler
network of Japan Met Agency, Abstracts of the Tenth Interna-tional Workshop on Technical and Scientific Aspects of MST/ST Radar, Piura, Peru, 13–20 May 2003, 134, 2003.
Jorgensen, D. P.: Mesoscale and convective-scale characteristics of mature hurricanes, Part I: General observations by research air-craft, J. Atmos. Sci., 41, 1268–1285, 1984a.
3958 M. Teshiba et al.: Secondary circulation within a tropical cyclone observed with L-band wind profilers
Jorgensen, D. P.: Mesoscale and convective-scale characteristics of mature hurricanes, Part II: Inner core structure of hurricane Allen (1980), J. Atmos. Sci., 41, 1287–1311, 1984b.
Marks Jr., D. F. and House Jr., R. A.: Inner core structure of hurri-cane Alicia from airborne Doppler radar observation, J. Atmos. Sci., 44, 1296–1317, 1987.
Powell, M. D.: Boundary layer structure and dynamics in outer hur-ricane rainbands, Part I: Mesoscale rainfall and kinematic struc-ture, Mon. Wea. Rev., 118, 891–917, 1990a.
Powell, M. D.: Boundary layer structure and dynamics in outer hurricane rainbands, Part II: Downdraft modification and mixed layer recovery, Mon. Wea. Rev., 118, 918–938, 1990b.
Ryan, B. F., Barnes, G. M., and Zipser, E. J.: A wide rainband in a developing tropical cyclone, Mon. Weath. Rev., 120, 431–447, 1992.
Sakakibara, H., Ishihara, M., and Yanagisawa, Z.: Structure of a typhoon rainstorm in the middle latitudes observed by Doppler radar, J. Meteor. Soc. Japan, 63, 901–922, 1985.
Shapiro, L. J. and Willoughby, H. E.: The response of balanced hurricanes to local sources of heat and momentum, J. Atmos. Sci., 39, 378–394, 1982.
Shibagaki, Y., Yamanaka, M. D., Kita-Fukase, M., Hashiguchi, H., Maekawa, Y., and Fukao, S.: Meso-α-Scale wind fields and pre-cipitating clouds in Typhoon 9426 (Orchid) observed by the MU radar, J. Meteor. Soc. Japan, 81, 211–228, 2003.
Tabata, A., Sakakibara, H., Ishihara, M., Matsuura, K., and Yanag-isawa, Z.: A general view of the structure of Typhoon 8514 ob-served by dual-Doppler radar – From outer rainbands to eyewall clouds, J. Meteor. Soc. Japan, 70, 897–917, 1992.
Teshiba, M., Hashiguchi, H., Fukao, S., and Shibagaki, Y.: Typhoon 9707 observations with the MU radar and L-band boundary layer radar, Ann. Geophys., 19, 925–931, 2001.
Willoughby, H. E., Marks, Jr., F. D., and Feinberg, R. J.: Stationary and moving convective bands in Hurricanes, J. Atmos. Sci., 41, 3189–3211, 1984.