Psychotherapy in the Private Sector: A Survey of Licensed
Psychologists and Psychotherapists in Quebec
La psychothérapie dans le secteur privé :
sondage auprès des psychologues et
psychothérapeutes agréés au Québec
Stacy Bradley
McGill UniversityPasquale Roberge
Université de SherbrookeJohn Service
Canadian Psychological Association (Retired)
Helen-Maria Vasiliadis
Université de Sherbrooke
Martin Drapeau
McGill University abstractMany clients and patients seek mental health services, including psychotherapy, in the private sector. However, there is a lack of information concerning the characteristics of private psychotherapy practice. With an increased focus on access to mental health care, knowledge of this sector is needed. This study aimed to document the current character-istics of practitioners who offer psychotherapy services in the private sector in Quebec. Participants included 671 psychologists and psychotherapists. Results indicated that the most commonly served age population was adults, the average number of sessions was 23.35 (SD = 20.82), and the average fee for individual therapy was $95.10 (SD = $16.69). Data are also reported on the types of services offered, practitioners collabora-tion with other professionals, the condicollabora-tions treated, the use of various clinical tools, and new trends in the field. Implications of the results for practitioners, trainees, and policy developers are discussed.
résumé
Bien des clients et patients se tournent vers le secteur privé pour obtenir des services de santé mentale, notamment en psychothérapie. Toutefois, on constate un manque d’infor-mation concernant les caractéristiques de la pratique privée en psychothérapie. Étant donné l’importance croissante accordée à l’accès aux soins de santé mentale, il y a lieu de mieux connaître ce secteur. Cette étude visait à documenter les caractéristiques actuelles des praticiens et praticiennes qui offrent des services de psychothérapie dans le secteur privé au Québec. Le groupe de participants comptait 671 psychologues et psychothé-rapeutes. Selon les résultats, le groupe d’âge le plus couramment desservi était constitué d’une population adulte, le nombre moyen de séances était de 23,35 (ÉT = 20,82) et le Revue canadienne de counseling et de psychothérapie
tarif moyen pour une thérapie individuelle s’établissait à 95,10 $ (ÉT = 16,69 $). Les données recueillies indiquaient également les types de services offerts, la collaboration des praticiens avec d’autres professionnels, les problèmes traités, le recours à divers outils cliniques et les nouvelles tendances dans le domaine. L’article propose aussi une discus-sion des implications des résultats pour les praticiennes et praticiens, ainsi que pour les personnes chargées d’élaborer des politiques.
The mental health care needs of Canadians, and the failure of our health system to meet these needs, has become an important topic of discussion among prac-titioners, researchers, mental health care organizations, the media, governments, and the public (e.g., Cavaliere, 2014; Peachey, Hicks, & Adams, 2013). The need for appropriate mental health treatment has never been greater: As of 2011, 1 in 5 Canadians suffer from a mental health problem (Mental Health Commission of Canada, 2012). Mental health problems are also one of the primary causes of disability in Canada and worldwide (Centre for Addiction and Mental Health, 2012).
The recent Mental Health Care System survey conducted through The Mood Disorders Society of Canada (2015) reported that 38% of Canadians had to wait more than a year to receive an initial mental health diagnosis. Furthermore, the 2014 Survey on Living with Chronic Diseases in Canada (Public Health Agency of Canada, 2014) showed that approximately 12% of Canadians have a mood or anxiety disorder, with 93% being prescribed medication and only 20% receiving a psychological intervention. This is troubling given the well-documented efficacy and cost-effectiveness of psychotherapy (American Psychological Association, 2013; Fansi, Jehanno, Lapalme, Drapeau, & Bouchard, 2016; Hunsley, Elliott, & Therrien, 2014; Vasiliadis, Dezetter, Latimer, Drapeau, & Lesage, 2017). With this increased focus on mental health care needs, the Canadian Psy-chological Association (CPA) has called for documentation of the roles, practice characteristics, and service demands of Canadian psychologists (Ronson, Cohen, & Hunsley, 2011). Indeed, the field of psychology in Canada has lagged regarding documenting the characteristics and practices of its professionals. Until Hun-sley, Ronson, and Cohen’s (2013) recent survey on the practice of psychology in Canada, these general characteristics had not been investigated in over two decades (Hunsley & Lefebvre, 1990; Warner, 1991). In comparison, the Ameri-can Psychological Association (APA) has been surveying its members concerning practice activities and characteristics for over four decades (Garfield & Kurtz, 1976; Norcross & Karpiak, 2012; Norcross, Karpiak, & Santoro, 2005; Prochaska & Norcross, 1983).
According to the most recent data available for Canada, the dominant activity of licensed psychologists is psychotherapy, particularly individual therapy with the adult population, followed by assessment activities (Hunsley et al., 2013; Ionita & Fitzpatrick, 2014). Hunsley and colleagues’ (2013) study (N = 538) also showed that the most prevalent presenting problems treated by most psychologists include anxiety disorders, mood disorders, and interpersonal difficulties. Regarding
theoretical orientation, cognitive-behavioural was reported as the most frequently endorsed among Canadian practitioners, followed by an integrative/eclectic ori-entation.
However, a factor to consider in understanding these practices is the increase of practitioners working in the private sector (for Canada, see Peachey et al., 2013; for the United States, see Norcross & Karpiak, 2012; for Australia, see Byrne & Davenport, 2005). In Quebec alone, 4,842 members of the Ordre des Psychologues du Québec (OPQ), the regulatory body for psychologists in Quebec, work either part-time or full-time in the private sector (Ordre des Psychologues du Québec, 2015, 2010). In Ionita and Fitzpatrick’s (2014) survey of psychologists in Canada (N = 1,668), approximately 63% of their sample received payment for services directly from the client. According to an Institut National d’Excellence en Santé et en Services Sociaux report (INESSS, 2015) on the inequality of access to psycho-therapy services, only a third of the professionals licensed to offer psychopsycho-therapy services in Quebec work in a public setting with the majority working privately. Unfortunately, little is known about psychologists in the private sector. Results of an older study comparing a sample of 210 doctoral level psychologists in private practice with those working in the public sector (N = 72) in the U.S. reported that those in private practice were older, more experienced, worked less hours, had higher career satisfaction, and devoted more time to marital/couple therapy (Norcross & Prochaska, 1983). More recent data from a large sample (N = 8,086) in Australia comparing those employed in the public sector, employed in the private sector, or practicing independently, similarly reported that independently employed psychologists were older, worked primarily with adults and couples, spent less time conducting group therapy or organizational consultation, spent less time doing research, and spent more time in direct intervention with clients (Stokes, Mathews, Grenyer, & Crea, 2010).
A second factor to consider is the change in the mental health landscape whereby professionals who are not licensed psychologists or physicians are now authorized to deliver psychotherapy or similar services. This was done with Bill 171
in Ontario,1 Bill 64 in New Brunswick,2 Bill 201 in Nova Scotia,3 and Bill 21 in
Quebec.4 For example, in Quebec, psychoeducators, guidance counsellors, nurses,
occupational therapists, sexologists, criminologists, social workers, and marriage and family therapists who in addition to being licensed with their regulatory body have a psychotherapy permit can provide psychotherapy services. These changes mean that practices will change as new and different practitioners with different trainings and backgrounds offer services. The practices of these professionals have never been documented.
Finally, a third factor that requires attention is how service users access psy-chotherapy. It is often said that family physicians are the point of entry for most patients who seek mental health services. This is based on a survey conducted in 2002 that showed that 4.9% of Quebecers discussed their mental health problems with their family physician, whereas only 3.9% would discuss such issues with a psychologist and 1.9% with a social worker (Lesage et al., 2006).
More recent surveys5 have shown that 45% of Quebecers believe the
psycholo-gist is the best professional to treat depression and anxiety disorders (compared to 29% for the family physician) and that 59% believe a psychologist should be seen first to receive help with anxiety (compared to 41% for a family physician; note that 73% of those aged 35 or younger and 69% of those who had a univer-sity degree believed the psychologist should be seen first). For depression, results showed that Quebecers believed either the physician or the psychologist could be seen (the proportion of those who felt the psychologist should be seen first reached 65% in those aged 35 and under). Clearly, many see value in the services offered by mental health professionals who are not physicians; most must pay out of pocket to access these professionals. Unlike the public system, in which data concerning mental health service use is documented and can be accessed, the needs of private service users is unknown.
Given the (a) call for increased documentation of psychologists’ services at the national level, (b) recognition of the number of psychotherapy services offered privately at the provincial level in Quebec and elsewhere, and (c) that many new professionals now offer psychotherapy, the timing for documenting psychotherapy services in this area is apt. To our knowledge, there has not been a comprehensive documentation of the specific details of private psychotherapy practice within the Canadian context, more specifically in Quebec. Considering this, the objective of the present study was to obtain detailed documentation of the specific practice characteristics of professionals in private psychotherapy practice.
method Participants
We recruited psychologists and psychotherapists currently practicing psycho-therapy in Quebec on a full or part-time basis in the private sector. Psychopsycho-therapy is a reserved activity in Quebec; it can be practiced by psychologists, physicians,
and those holding a psychotherapy permit (labelled psychotherapists).6 Only
licensed psychoeducators, guidance counsellors, nurses, occupational therapists, sexologists, criminologist, social workers, and marriage and family therapists who are dually registered with their college can obtain a psychotherapy permit. An email invitation was sent in June 2014 to 4,059 clinicians fitting these criteria (3,518 psychologists, 541 psychotherapists) requesting participation in the online questionnaire. In total, 739 participants responded to the study; however, 68 indi-viduals did not complete the questionnaire and were excluded from the final sample (N = 671). Most participants were licensed as psychologists (n = 526; 79%), while the remainder were psychotherapists (n = 140; 21%). In total, 25% of the sam-ple identified as male. Approximately 90% of the samsam-ple comsam-pleted the survey in French and 10% in English. 50.3% of the participants practiced in an urban setting, and 49.7% practiced in a semi-rural or rural setting (refer to Table 1 for details). The sample was generally representative of the population of licensed psychologists and psychotherapists in Quebec (see Ordre des Psychologues du Québec, 2015).
Table 1 Demographic Information Age % 25–34 13 35–44 26 45–54 22 55–64 27 65+ 12 Years of Practice % Less than 5 12 5–10 20 11–15 17.5 16–20 13.5 21–25 14 26–30 10 30+ 13 Theoretical Orientation %
Cognitive-behavoural Primary orientation 35.4
Secondary orientation 23.7
Psychoanalytic/Psyschodynamic Primary orientation 22.8
Secondary orientation 11.7
Humanistic/Existential Primary orientation 22.6
Secondary orientation 18.5
Integrative/Eclectic Primary orientation 9.7
Secondary orientation 14.3
Systems/Family Systems Primary orientation 6.5
Secondary orientation 17.6
Other Primary orientation 3.1
Secondary orientation 3.7
Note. Some respondents may be practicing with a bachelor’s or master’s degree as they would have
been licensed before the new doctoral requirements and/or are originally from outside of Quebec and have been accepted for licensure based on equivalences.
Survey
The online survey was developed to assess various themes related to private psy-chotherapy practice such as psypsy-chotherapy formats offered, age-group populations treated, diagnoses and presenting problems, referral sources, collaboration with other professionals, number and frequency of sessions, as well as psychotherapy fees, among others (see Tables 2-10). Ethical approval for the study was obtained through the McGill Research Ethics Board. Before recruitment, the survey was professionally translated into French, and each version, French and English, was piloted. Sixteen clinicians (psychologists, psychotherapists, and advanced
psychol-Academic Degree % Bachelor’s degree 5 Master’s degree 63 Doctoral degree 20 Psy.D. 9.5 Other 2.5 Number of Professionals % Solo practice 47.7 2–4 25.1 5–7 12.8 8+ 14.4
ogy doctoral students) were recruited for piloting. Modifications were made to the final survey based on pilot feedback, and the clarity and accuracy of the translation were confirmed through a final pilot of both the English and French surveys with a bilingual psychologist.
Data Analysis
The dataset was screened for errors and outliers were removed before data analysis (Cousineau & Chartier, 2010; Field, 2013). Most of the survey items contained less than 5% missing data, which is considered within the acceptable range (Tabachnick & Fidell, 2007). For those items with more than 5% missing data, the missing data were input through expectation maximization methods (Tabachnick & Fidell, 2007). The frequencies were calculated for all ordinal and categorical variables, as well as the descriptive data for all continuous variables.
results and discussion Private Practice Characteristics
The clinicians in this sample reported a large range of hours devoted to their private practice. Most of the sample (57.6%) reported working privately for 20 hours or less per week. Regarding the number of clients, almost two-thirds (62%) of the sample reported providing services to 15 or fewer clients per week with almost half seeing 10 or fewer clients per week (see Table 2 for details). This provides further evidence, as in Hunsley et al.’s (2013) survey of Canadian practitioners, that many psychologists are in part-time private practice. Stokes et al. (2010) found similar results concerning the Australian psychology workforce, with most of the sample reporting private practice as their primary or secondary job position.
Psychotherapy Format and Client Populations
Approximately 80% of the sample reported that in their private practice the bulk of their psychotherapy time was spent in individual therapy; less than 10% of the sample indicated spending less than 60% of their time in individual therapy (see Table 2). This was followed by 42% of the sample reporting that they conducted couple/marital therapy; however, approximately 30% of these respondents reported conducting couple therapy for less than 20% of their psy-chotherapy time.
Across many previous studies of general psychotherapy practice, individual therapy has consistently been reported as the most common psychotherapy format, followed by couple therapy (Humbke et al., 2004; Hunsley et al., 2013; Norcross & Karpiak, 2012; Norcross & Rogan, 2013). While only 27% of Hunsley and et al.’s (2013) sample of practitioners in both the public and pri-vate sectors reported conducting couple/marital therapy, a significantly higher proportion of those in private practice (48%) engaged in couple/marital therapy compared to those in the public sector (11%), which is similar to the rate found
Table 2 Survey I tems P er taining to P sychother ap y F or
mat and Client P
opulations 0–5 6–10 11–15 16–20 21–25 26–30 31–35 36+ H ow many hours of y our wor k w eek is dev oted to y our priv ate practice? 13.3% 18.9% 12.1% 13.3% 12.3% 11.8% 9.4% 8.9% In y our priv
ate practice setting, on av
erage ho
w many clients per w
eek do y ou pr ovide psy chotherapy ser vices to? 21.4% 23.1% 17.6% 19.5% 10% 6.7% 1.7% N one < 20% 20–39% 40–59% 60–79% 80% + In y our priv
ate practice, what pr
opor
tion of y
our time is typically
dev
oted to each of the follo
wing psy chotherapy formats: Couple Therapy 57.5% 29.3% 9.3% 2.2% 1.3% .3% G roup Therapy 95.8% 3.6% 0.4% 0.1% 0% 0% Family Therapy 73.2% 20.5% 4.2% 1% 0.9% 0.1% Individual Therapy 0.3% 0.9% 1.6% 5.7% 10.6% 80.8% In y our priv ate psy
chotherapy practice, what pr
opor
tion of y
our time is
typically dev
oted to each age gr
oup: Childr en (12 and under) 71.6% 13% 7.5% 4% 1.9% 1.9% Adolescents (13 to 17) 49.1% 36.1% 9.6% 3.7% .9% .6% Young A dults (18 to 30) 11.7% 22.1% 43.5% 17.6% 3.6% 1.5% Adults (31 to 65) 6.6% 4.2% 10.9% 30.5% 30.5% 17.3% O lder A dults (66+) 47.7% 47.8% 4% 0.1% 0% 0.3% In y our priv ate psy
chotherapy practice, appr
oximately ho w many of your clients ar e: M ale 1.2% 53.5% 34.9% 4.7% 5.6% 0% Female 0% 0% 5.5% 45.4% 34% 15% Identify as ‘O ther ’ 88.5% 10.1% .3% .3% .3% .3% N one < 20% 20–39% 40–59% 60–79% 80% + D o not kno w In y our priv ate psy
chotherapy practice, appr
oximately ho w many of your clients: H av e priv ate insurance? 1.2% 8.2% 12.3% 18.9% 21.1% 33.9% 4.3% Ar e on leav e fr om wor
k due to a mental health concern?
12.5% 35.9% 30.7% 11.5% 6.4% 2.6% 0.3% Ar e a visible minority? a 31.1% 52.8% 9.7% 4% 0.1% 0.1% 2.1% a V
in this sample. Approximately 96% of the sample indicated that “none” of their psychotherapy time was devoted to group therapy, and approximately 73% in-dicated “none” of their time being devoted to family therapy. The present results for those engaged in group therapy (approximately 4%) are quite low compared to the 20% typically reported across studies (see Hunsley & Lefebvre, 1990; Hunsley et al., 2013; Norcross & Karpiak, 2012; Norcross & Rogan, 2013). However, this may be explained by the fact that the present study is based exclu-sively in the private sector.
Concerning age populations, the group that received the highest rated time in therapy was adults (age 31 to 65) with approximately 58% of the sample indicating that they spend more than 60% of their psychotherapy time with this population. Following this was young adults (age 18 to 30), with approximately 60% of the sample indicating that they spend 20% to 60% of their service time with this population (see Table 2). Other Canadian studies have also documented that the most commonly served population is adults in both public and private settings (Hunsley et al., 2013; Ionita & Fitzpatrick, 2014), even though the prevalence rates of mental health problems are similar in both the youth and elderly popula-tions (Canadian Coalition for Seniors’ Mental Health, 2006; Canadian Mental Health Association, 2010, 2016; World Health Organization, 2016). This is an important finding for service planners and funders as it highlights how children, youth, and elders are underserved populations regarding mental health treatment in the private sector. Additional data can found in Table 2.
Diagnoses and Presenting Problems
Table 3 outlines the presenting problems and diagnoses that are treated most frequently. Anxiety disorders were reported as the most frequently treated as 86% of the sample reported treating these on an “often” to “very often” basis, followed by mood disorders with 69% treating these on an “often” to “very often” basis. This is not surprising as these are among the most prevalent mental health concerns in Canada, with 4.7% of the population meeting the criteria of a major depres-sive episode and 2.4% meeting the criteria for generalized anxiety disorder alone in a 12-month period (Statistics Canada, 2012). These disorders have also been targeted as the high priority disorders to be the focus of treatment in government-funded psychotherapy programs in the UK and Australia (Australian Government Department of Health, 2015a, 2015b; Clark, 2011).
Furthermore, in Hunsley et al.’s (2013) Canadian sample significantly more private practice clinicians reported treating mood and anxiety disorders compared to those in the public sector (97% of private compared to 76% of public for anxi-ety disorders; 89% of private compared to 73% of public for mood disorders). In terms of presenting problems, interpersonal problems were rated most frequently, with 73.1% of the sample indicating treating this “often” or “very often,” followed by adjustment to life stressors with 71.3% treating this “often” or “very often,” mirroring what was reported in Hunsley et al.’s (2013) subsample of clinicians in private practice.
Table 3 Survey I
tems Concer
ning P
resenting P
roblems and Diagnoses
Per centage of R espondents N ev er Rar ely Sometimes O ften Ver y O ften In y our priv ate psy
chotherapy practice, please indicate the fr
equency with which y
our clients
pr
esent each of the follo
wing pr
oblems as their primar
y r
eason for seeking ser
vices: Adjustment to life str essors 1.5 6.3 20.9 48.5 22.8 Couple/M arital difficulties 6.1 6.0 36.4 39.6 11.8 D isor
ders found in the DSM, ICD, etc.
0 9.5 29 46.1 15.4 Family difficulties a 0 10.3 45.6 37.3 6.9 G ender or sexuality-r elated difficulties a 21.2 54.1 20.3 4.5 0 G rief/B er eav ement 4.1 24.2 49.4 19.7 2.6 Interpersonal difficulties 0 3.1 23.8 52.2 20.9 Personal P
roblems (e.g., existential pr
oblems) 3.5 13 39.1 33.1 11.2 Psy chological pr oblems r
elated to health, injur
y or illness 6.5 27.1 42.5 19.4 4.5
Sexual abuse and trauma
11.3 35.5 36.1 13.1 4 W or k/V ocational difficulties 8.3 11.2 36.2 36.2 8.1 In y our priv ate psy
chotherapy practice, please indicate the fr
equency with which y
our clients
requir
e tr
eatment primarily for the follo
wing diagnoses: Anxiety D isor ders 0 0 14.1 49 36.9 ADHD and D isr uptiv e B ehavioural D isor ders 22.4 30 28.1 14 5.5 Eating D isor ders a 21 50.8 24.9 3.3 0 M ood D isor ders 0.2 6.8 24.1 44.5 24.4 Personality D isor ders 9.3 26.9 40 19.8 4.2 Per vasiv e D ev elopmental D isor ders a 71.4 22.4 6.3 0 0 Schiz ophr
enia and other P
sy chotic D isor ders a 75.6 24.4 0 0 0 Sexual D isor ders a 29.7 47.5 19.5 3.3 0 Sleep D isor ders 12.2 16.9 39.6 26 5.2 Somatoform D isor ders a 24.4 38.5 29.5 7.6 0 Substance A buse a 26.1 40.2 27.4 6.3 0 a V
Clinical Characteristics and Perceived Response to Psychotherapy
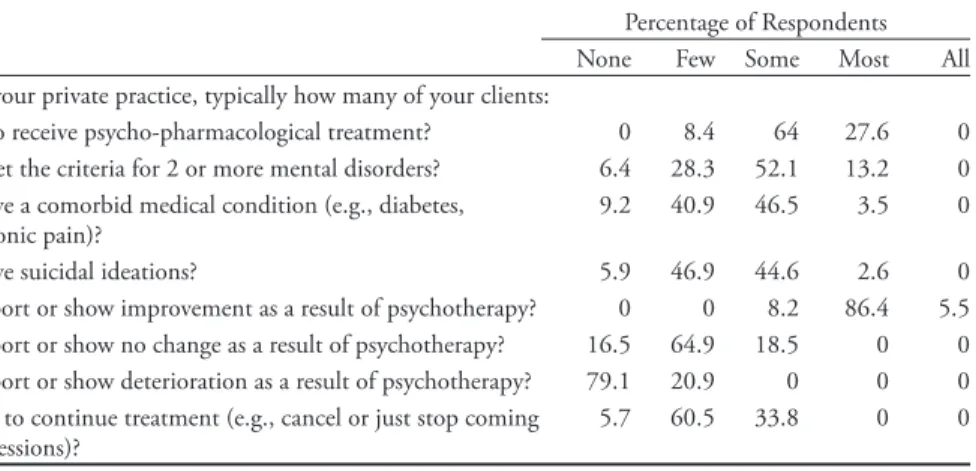
Table 4 shows all frequencies for survey items related to clinical characteristics of the clientele served such as comorbidity of mental and physical health problems, psychopharmacological treatment, and suicidal ideation. Close to a third of the sample indicated that “most” of their clients were also receiving psychopharmaco-logical treatment. This is not surprising given the prevalence of family physician treatment of mental health problems, as well as the routine use of medication to treat prevalent disorders such as mood and anxiety disorders (Mood Disorders Society of Canada, 2015). Comorbidity of both mental and physical health problems was reported as not generally characteristic of the respondents’ caseload. Approximately half of the sample indicated that “none” or “few” of their clients have a comorbid health condition, and concerning a comorbid mental health condition 52% indicated “some” and 28% indicated “few.”
Table 4 reports the frequencies for survey items regarding perceived response to psychotherapy (i.e., the percentage of clients who report improvement). Over-whelmingly, the consensus was that psychotherapy leads to positive gains as more than 90% indicated that “most” or “all” of their clients report or show improve-ment because of psychotherapy. Furthermore, only 20% of the sample indicated that “few” of their clients report or show deterioration because of psychotherapy, and approximately 80% indicated that “none” of their clients report or show de-terioration. This must be considered regarding the documented lack of accuracy of clinicians in estimating client progress and deterioration (Hannan et al., 2005; Hunsley, Aubry, Vestervelt, & Vito, 1999).
Table 4
Client Clinical Characteristics and Response to Psychotherapy Treatment
Percentage of Respondents None Few Some Most All In your private practice, typically how many of your clients:
Also receive psycho-pharmacological treatment? 0 8.4 64 27.6 0 Meet the criteria for 2 or more mental disorders? 6.4 28.3 52.1 13.2 0 Have a comorbid medical condition (e.g., diabetes,
chronic pain)? 9.2 40.9 46.5 3.5 0
Have suicidal ideations? 5.9 46.9 44.6 2.6 0
Report or show improvement as a result of psychotherapy? 0 0 8.2 86.4 5.5 Report or show no change as a result of psychotherapy? 16.5 64.9 18.5 0 0 Report or show deterioration as a result of psychotherapy? 79.1 20.9 0 0 0 Fail to continue treatment (e.g., cancel or just stop coming
to sessions)? 5.7 60.5 33.8 0 0
Fees, Number, and Frequency of Sessions
All descriptive data for fees associated with psychotherapy can be found in Table 5. The average amount charged per hour for individual therapy was $95.10
(SD = 16.69), with a range of $45.00–$160.00. This is much lower than what is recommended in other provinces, even in those with a master’s level licensing requirement (see Canadian Psychological Association, 2015) such as $200 in Alberta (Psychologists’ Association of Alberta; see http://www.psychologistsassocia-tion.ab.ca/site/recommended_fee_schedule), or $190 in Nova Scotia (Association of Psychologists of Nova Scotia; see http://apns.ca/general-information/fees-psychological-services/). Note that approximately 3 in 4 psychologists in Quebec practice with a master’s degree as the doctorate became mandatory only in 2006. A possible explanation for this pricing discrepancy may be the fact that Quebec has by far the largest number of registered psychologists compared to other Ca-nadian provinces with a ratio of 95 psychologists per 100,000 inhabitants, while the Canadian average is 58 per 100,000 inhabitants (Statistics Canada, 2009), making the rates for services more competitive. The highest fees for the present sample were associated with couple/marital therapy and family therapy, both with an average cost of $107 per hour.
Table 5
Survey Items Concerning Psychotherapy Costs
n M Mdn SD Mini - mum Maxi-mum
In your private psychotherapy practice, on average, what do you charge for one hour of psychotherapy? Individual Therapy 649 $95.10 $87.50 16.69 $45.00 $160.00 Couple/Marital Therapy 263 $106.79 $90.00 29.40 $45.00 $260.00 Family Therapy 143 $106.54 $100.00 30.50 $60.00 $260.00 Group Therapy 23 $76.20 $40.00 67.95 $17.50 $265.00 n %
Do you ever offer psychotherapy services at no cost?
Yes 136 20.3%
No 533 79.7%
Do you offer a sliding scale?
Yes 178 27.1%
No 480 72.9%
n M Mdn SD Mini- mum Maxi- mum
When offering a sliding scale:
What is the lowest cost ($) per session? 175 $55.36 $60.00 22.78 $0 $120 What percentage (%) of your clientele
pays for services at a reduced price? 172 20.92% 15% 18.96 1% 100%
Table 6 lists the frequencies related to the number and frequency of psycho-therapy sessions. The average number of sessions reported was 23 (Mdn = 18). The average minimum number of sessions was 6.5. These results are similar to other
studies. In Ronson et al.’s (2011) investigation of clinical practice, 140 licensed practitioners reported characteristics of two identified clients. The average session number for the first set of identified clients was 14, and the second set was 24, with over half reporting that less than 8 sessions were likely remaining. In a similar investigation of youth psychological services, Hunsley, Ronson, Cohen, and Lee (2014) asked 137 practitioners providing services to children and youth to provide information on one of their cases. The average number of assessment sessions was 3 (Mdn = 2), the average number of therapy sessions to date was 10.8 (Mdn = 5), and the average anticipated number of sessions remaining was 10 (Mdn = 5). The average number of sessions reported in these previous studies, as well as the results of the present study, are much higher than that which is covered for mild to moderate mental health concerns in the government-funded psychotherapy programs in the UK (Department of Health, 2008a; INESSS, 2015) and Australia (Australian Government Department of Health, 2015a, 2015b; INESSS, 2015), where 6–10 sessions is set as the norm and 18–20 sessions is only provided for severe mental health problems. In the UK’s Improving Access to Psychological Therapies (IAPT) program, the average number of sessions is approximately five sessions (Richards & Suckling, 2009), and in the Australian government-funded psychotherapy program Access to Allied Psychological Services (ATAPS), most individuals are seen for six sessions (INESSS, 2015).
Concerning treatment that is covered by the government, compared to out of pocket payment in the private sector, perhaps there is more of a focus on brief interventions and symptom reduction. The private setting may allow for more treatment time to be spent on relapse prevention or follow-up treatment sessions. Investigating the rates of treatment dropout in both the public and private settings would also be of importance in explaining the differences in treatment length. In the first three years of the IAPT program of the 600,000 individuals who began treatment, only 350,000 completed it (Department of Health, 2008b). In the present sample, participants reported that it was not common for clients to drop out or no longer show up for sessions (approximately 65% reported that none or few of their clients drop out). The data concerning routine session numbers from the current investigation, previous Canadian studies, as well as data from government-funded models of psychotherapy all need to be considered in the future planning of a government-funded model of psychotherapy in the local context.
Wait Times and Preparation Time
In total, 61.6% indicated that the wait-list for their services was approximately one week or less (with 39% reporting no wait-list). This is a stark contrast from that of the public system where wait-lists can range from several weeks to several months. This short wait-time may be related to the high density of psycholo-gists offering services in Quebec. For administrative and/or preparation time, approximately half of the sample indicated either 15 or 20 minutes for every psychotherapy hour (see Table 6; additional data can be found in Table 6).
Table 6 Number and F requency of P sychother ap y S essions, W ait-list, S uper vision and P repar ation for P sychother ap y n M Mdn SD M ini mum M axi mum Typically , in r egar
ds to the clients that complete their tr
eatment, what is the:
M
inimum number of sessions
a 671 6.5 5.5 5.2 1 50 Av
erage number of sessions
a 671 23.35 18 20.82 1 210 M
aximum number of sessions
a 671 72.7 59.94 61.43 4 450 N one Fe w Some M ost All In y our priv ate practice, ho w many of y our clients ar
e typically seen at the
follo wing fr equencies: 2 or mor e sessions per w eek a 77.5% 22.5 0% 0% 0% 1 session per w eek 0% 5.8% 19.1% 70.9% 4.1%
2 sessions per month
0%
3.7%
10.1%
51.5%
34.7%
1 session per month
a 15.9% 49 % 33.8% 1.2% 0% No wait-list Less than 1 w eek Appr ox. 1 w eek Appr ox. 2 w eeks Appr ox. 3 w eeks 4 w eeks or mor e H ow many w
eeks do potential clients wait on a waiting list for y
our priv ate psy chotherapy ser vices? 39% 7.9% 14.7% 11.8% 10.8% 15.7% O nce per day Twice per w eek O nce per w eek Twice per month O nce per month O ther frequency
Please indicate the fr
equency with which y
ou engage in informal case
discussion with colleagues.
0% 12.9% 18.9% 20.3% 28% 15.6% n M Mdn SD M inimum M aximum
Please indicate the number of hours per y
ear y ou r eceiv e of formal clinical super vision. a 671 12.37 10.00 14.34 0 150 0–5 minutes 10 15 20 25 30 35 40 45+ minutes O n av erage, ho w much administrativ e/pr
eparation time (e.g., case notes,
pr
eparation) is dev
oted to each hour of client contact?
2.8% 17.1% 28.5% 23.9% 6.6% 13.5% 1.5% 2% 4.2% a V
Referral Sources and Collaboration
More than half the sample (60.1%) reported that “most” of their clients self-refer, followed by family physician referrals, and referrals from an employee as-sistance program (EAP) (see Table 7). This indicates the autonomous role clients have in seeking services, as well as the role of family physicians and EAPs in getting service users into private treatment.
Table 7
Referral Sources
Percentage of Respondents
None Few Some Most All Do Not Know Typically, how many of your clients:
Are referred by a psychiatrist? 34.4 44.8 20.8 0 0 0
Are referred by a family physician? 5.8 15.7 60.3 18.2 0 0 Are referred by a community mental
health organization (e.g., Ami-Quebec)?
56.1 31.1 12.8 0 0 0
Are referred by an Employee Assistance
Program? 21.1 22.8 39.2 16.4 0.5 0
Are referred by a governmental agency
(i.e., SAAQ, IVAC)? 37.7 26.8 31.5 3.9 0 .2
Self-refer? 0 5.5 30 60.1 4.4 0
Regarding collaboration with other professionals, 51% of the sample reported that “some” or “most” of their clients require consultation with a psychiatrist, whereas only 37% indicated that “some” or “most” have access to a psychiatrist. In contrast, 37% of the sample indicated that “most” or “all” of their clients would require consultation with a family physician, and 52% reported that “most” or “all” of their clients have access to a family physician (see Table 8). Therefore, the need for access to family medicine is being met more so than that of psychiatry. In total, 61% of the sample reported that it was either “difficult” or “very difficult” to consult a psychiatrist for a case. Concerning consultation with family physicians, although better than access to psychiatry, 44% of the sample still indicated that it was either “difficult” or “very difficult.” Similarly, respondents indicated it was either “very difficult” or “difficult” to directly refer to a psychiatrist (76%) or a family physician (68%). The greatest ease of collaboration reported by this sample was with other psychologists. Additional data can be found in Table 8.
Use of Clinical Tools in Psychotherapy Treatment
Table 9 reports the frequencies for survey items regarding the use of diverse clinical tools and measures in psychotherapy (e.g., personality inventories, estab-lished clinical guidelines). Overall, respondents did not report frequently using such tools. Self-developed assessment inventories were the most frequently used
tools; however, the rate was still modest, with 19% using these on an “often” to “always” basis. What this may be highlighting is the autonomous nature of psycho-therapy practice: While there are validated scales to assess or measure symptoms, there is also the tendency to use a self-developed assessment inventory. This is Table 8
Collaboration with Other Professionals
Percentage of Respondents
None Few Some Most All Do Not Know Typically, how many of your clients:
Would require consultation with a
psychiatrist? 4.1 44.8 48.3 2.9 0 0
Currently have access to a psychiatrist? 7.7 54.7 34.2 3.5 0 0 Would require consultation with a
family physician? 0 11 51.6 33.1 4.2 0
Currently have access to a family
physician? 0 9.4 38.3 48.1 4.2 0
Very
Difficult Difficult Easy Very Easy N/A How easy is it for you to consult with
each of the following professionals concerning individuals within your private practice? Family Physician 9 34.5 39.9 6.2 10.4 Psychiatrist 30.5 31.4 20.1 2.9 15.2 Psychologist 0.9 4.8 56.4 15.9 22 Psychotherapist 0.6 2.4 36.1 9.5 51.4 Social Worker 0.8 5.0 46.1 10.2 38 Very
Difficult Difficult Easy Very Easy N/A How easy is it for you to have access
to the following professionals, in order to directly refer clients to them?
Family Physician 36 31.8 14.3 3 14.9
Psychiatrist 49.2 27 9.2 2.4 12.2
Psychologist 2.1 9.1 62.8 14.4 11.5
Psychotherapist 1.4 3 38.4 9 48.2
Social Worker 3.3 12.8 35.2 7 41.7
How often do you refer a client to a medical professional to rule out medical causes when a client presents
with: Never Rarely Sometimes Often Always
Anxiety 5.8 21.1 37.6 26.2 9.4
reflective of Baker, McFall, and Shoham’s (2009) report on the role of science, or lack thereof, in clinical psychology. Baker and colleagues outlined the ambivalence in clinical psychology concerning the role of science in informing psychological assessment and interventions. While we have strong evidence in support of using assessment and treatment tools and interventions, often these are not delivered or implemented in routine practice, as clinical intuition–not scientific evidence–is often given the most importance in terms of clinical decision making (Drapeau & Hunsley, 2014; Ionita & Fitzpatrick, 2014).
Table 9
Use of Clinical Tools in Psychotherapy Treatment
Percentage of Respondents Please indicate the frequency with
which you use each of the following in
your private psychotherapy practice: Never Rarely Sometimes Often Always
Manualized treatments 43 22.9 22.1 11.9 0
Validated scales to track/document client progress (e.g., BDI, OQ-45, PCOMS)
50.5 18.3 17 10.6 3.6
Established Clinical Guidelines (e.g.,
NICE, Qualaxia)a 76.6 15.9 7.5 0 0
Formal Diagnostic Inventories (e.g.,
SCID) 56.2 21.5 15.9 6.4 0
Self-developed assessment inventories 49.4 11.9 18.8 13.1 6.8 Personality Inventories (e.g., MMPI,
NEO) 65.4 18.6 11.7 4.3 0
Projective Tests (e.g., Rorschach, TAT)a 81.4 11.6 7 0 0 a Variables with inputted missing data.
Others have commented on the difficulty of translating tools, such as progress monitoring measures specifically, to those in independent practice as isolation may contribute to less awareness and use (Hatfield & Ogles, 2004; Ionita & Fitzpatrick, 2014). In a training context, practical issues (such as lack of resources) surrounding the use of validated progress monitoring measures were identified as the primary barrier to their use (Overington, Fitzpatrick, Drapeau, & Hunsley, 2016). It is yet to be seen if it is the lack of awareness of validated measures or other practical constraints that may explain their limited use in the private sector.
More than 90% of the sample reported “never” or “rarely” using projective tests, which is not surprising, as the decline in the use of these has been documented in others’ samples (see Norcross & Karpiak, 2012; Norcross, Prochaska, & Gallagher, 1989). Approximately 65% of the sample reported “never” using personality inven-tories, and 65% reported “never” using established clinical guidelines. While the medical profession has a lengthy history in the development and implementation
of clinical guidelines (Cullen et al., 2005), evidence of implementation of these by psychotherapists is minimal and attitudes towards their use are often mixed (Mullen & Bacon, 2004). However, the use of the National Institute for Health and Care Excellence (NICE) guidelines are a fundamental feature of the UK’s IAPT program (Clark, 2011).
Psychology and psychotherapy have generally fallen behind in developing clinical guidelines compared to the medical profession; furthermore, many guidelines available in the context of Quebec and elsewhere are of low quality (see Stamoulos, Reyes, Trepanier, & Drapeau, 2014). The language barrier must also be considered in the Quebec context, as many clinicians may either not be aware of or not be inclined to use guidelines only available in English, such as the NICE guidelines.
Recently, there has been a focus on the importance of outcome tracking (Ionita & Fitzpatrick, 2014; Overington & Ionita, 2012) or monitoring client response to psychotherapy treatment. It is challenging for clinicians to accurately estimate client improvement or deterioration simply through clinical judgement (Hannan et al., 2005; Hatfield, McCullough, Franz, & Krieiger, 2010). However, the use of validated measures to track treatment progress continues to be low, and this trend was found in the current study. Half of the therapists in this sample reported “never” using validated scales to track treatment progress, while 17% of the sample reported using these “sometimes” and 10% “often.”
Recent research suggests that rates of implementation of these progress monitor-ing measures are generally low (see Ionita & Fitzpatrick, 2014). A recent large sur-vey study (N = 1,668) of progress monitoring in Canadian psychological practice indicated that while one-third of the sample were aware of progress monitoring measures, only 12% were routinely using these (Ionita & Fitzpatrick, 2014). The current results are in line with this finding. However, the present investigation may have captured the larger proportion of professionals implementing these on an intermittent basis as 17% indicated “sometimes” using these.
Ionita and Fitzpatrick (2014) found that those primarily serving adults (as op-posed to children, groups, couples, organizations) were significantly more likely to be aware of and implement progress monitoring measures. This may be related to the fact that more of these measures are tailored to the adult population. Ionita and Fitzpatrick also found that those with a master’s level education had less aware-ness of these measures compared to those with a doctoral degree. This must be considered in the current sample, as well as the larger population of psychologists and psychotherapists in Quebec, as the vast majority of these licensed clinicians are educated at the master’s level. These data must be considered in light of the current sample also reporting high improvement rates among their clients (90% of the sample report that “most” or “all” of their clients report or show improve-ment). However, with such low rates of using validated measures to track treatment outcome and the documented inaccuracy of clinical judgement (see Hannan et al., 2005), it is difficult to determine the true accuracy of outcomes, and points to a potential lack of self-critical assessment of treatment effectiveness.
New Trends in Psychotherapy Interventions
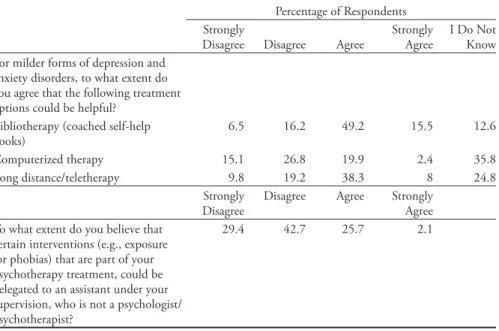
Table 10 contains the frequencies for survey items pertaining to attitudes toward new trends in psychotherapy intervention, such as computer-based psychotherapy, long-distance/teletherapy, and bibliotherapy (coached self-help books) for milder forms of depression and anxiety disorders. Norcross, Pfund and Prochaska (2013) conducted a Delphi poll with experts in psychotherapy on the future trends in psychotherapy, and identified computerized interventions, self-directed client change (e.g., bibliotherapy), as well as didactic-directive therapist interventions for relapse prevention such as homework, problem-solving techniques, and cog-nitive restructuring as the components that would likely increase in the future. Many of these components are indeed used in the government-funded model of psychotherapy in the UK (IAPT) for mild to moderate depression and anxiety (Department of Health, 2008a).
Results from the current study show that more than two-thirds of the sample were in favour of the use of self-help books, almost half agreeing with the use of long-distance/teletherapy, and approximately 20% in agreement with the use of computerized psychotherapy. As 45% of the sample indicated psychodynamic/ psychoanalytic or humanistic/existential as their primary orientation, which all place a high value on the therapeutic relationship, this may explain the lack of support for computerized therapy.
Table 10
New Trends in Psychotherapy Interventions
Percentage of Respondents Strongly
Disagree Disagree Agree Strongly Agree I Do Not Know For milder forms of depression and
anxiety disorders, to what extent do you agree that the following treatment options could be helpful?
Bibliotherapy (coached self-help
books) 6.5 16.2 49.2 15.5 12.6
Computerized therapy 15.1 26.8 19.9 2.4 35.8
Long distance/teletherapy 9.8 19.2 38.3 8 24.8
Strongly
Disagree Disagree Agree Strongly Agree To what extent do you believe that
certain interventions (e.g., exposure for phobias) that are part of your psychotherapy treatment, could be delegated to an assistant under your supervision, who is not a psychologist/ psychotherapist?
Another component of the UK’s stepped-care program is the use of ers with less training and expertise, known as psychological wellbeing practition-ers (PWPs), who are well trained and supervised by psychologists to provide low-intensity treatments such as those listed above (Clark, 2011). In asking the present sample their agreement on delegating certain interventions (e.g., exposure for phobias) to an assistant under their supervision, 72% of the sample disagreed with this (with approximately 30% strongly disagreeing). It is challenging to know if this disagreement is grounded in clinical judgement and expertise concerning who one sees fit to deliver services, such as the level of perceived expertise needed to implement these interventions, or if it is more of a practical economic/profes-sional issue of having an assistant hired that one would have to supervise and be responsible for. It is also possible that such resistance to delegating clinical acts, even under supervision, is tied to specific theoretical models (e.g., psychodynamic, humanistic), or perhaps a protectiveness over the practice of psychotherapy and attitudes about the level of training needed to conduct interventions, or simply that clinicians are not sufficiently trained in and exposed to what may be referred to as a form of collaborative care.
From an economic perspective, it would, however, be more cost-effective to have a practitioner with less training deliver low-intensity treatments (e.g., guided self-help, exposure for phobias) than a doctoral level trained clinician. This is also a better use of resources, possibly increasing the number of patients receiving services. It would be advantageous for future research to investigate the reasons for the current opposition to delegating low-intensity treatments.
summary and implications
The objective of this investigation was to provide a snapshot of the detailed characteristics of psychotherapy practice in the private sector in Quebec as a means of adding to the current documentation of the characteristics of psychological practice in Canada. Generally, those in the private sector of Quebec work part-time and routinely serve adults in individual therapy. Most of their clients have private insurance to assist in funding these services. These professionals reported very short wait times and treated a range of mental health problems, routinely for up to 20 sessions. The practice of measuring outcomes with validated scales or using established clinical guidelines was minimal among the participants; however, this mirrored the expected rates documented in other studies. Finally, the participants reported the difficulty of collaborating with other professionals, particularly psychiatrists and, to a lesser degree, family physicians.
For those interested in psychological practice, the current investigation provides a glimpse of typical private psychotherapy practice in Quebec. For example, this study has shown that the youth population, as well as the elderly population and those with comorbid health problems, are underrepresented in the private sec-tor. There are mental health needs not being met in this sector, and therefore less competition among providers to meet the needs of these underserved populations.
This lower competition could be an inducement that helps to increase the number of providers in the private sector.
The information pertaining to rates charged per psychotherapy hour provides a benchmark for trainees or for those interested in entering private practice, par-ticularly in Quebec, in setting their hourly fee. Additionally, documenting the referral pathways of those entering private psychotherapy treatment allows trainees and new professionals to understand the importance of advertising their services, or becoming well known in a community as so many individuals self-refer. Implications for Collaborative Care
Recently there has been a focus on the need for increased collaboration between mental health professionals and medical professionals, with much attention paid to the primary care setting (Gagné, 2005). Additionally, research has investigated ways of increasing opportunities for collaboration between psychologists, psy-chotherapists, and medical professionals such as psychiatrists and family physi-cians (Grenier, Chomienne, Gaboury, Ritchie, & Hogg, 2008; Lee, Schneider, Bellefontaine, Davidson, & Robertson, 2012). What can be seen from the current investigation is the need for increased collaboration and patient access to psychia-trists and family physicians for therapists practicing in the private sector. A study of family physicians in Quebec indicated that approximately half of those surveyed had no contact with mental health professionals and resources, and only referred approximately 17% of those with common mental health problems to a mental health professional (Fleury, Farand, Aubé, & Imboua, 2012). Gener-ally, the family physicians in Fleury et al.’s (2012) study reported that the mental health system was difficult to access, wait-times for mental health services were long, and it was challenging to communicate with mental health professionals. Furthermore, the family physicians indicated being in favour of increased contact with psychologists and psychotherapists through reports and telephone consultation (Fleury et al., 2012). What can be seen is that the difficulties in ac-cess and communication with medical professionals reported by our sample are also reported by medical professionals in Quebec. Professionals in psychology, psychiatry, and family medicine all report being open to and willing for increased interdisciplinary collaboration, and report seeing the value in this for effective treat-ment (Fleury et al., 2012; Lee et al., 2012); however, professionals from all sides comment on how challenging this is. As it stands, there is not an established route or mechanism for consultation or referral from the private sector to psychiatrists and family physicians or vice versa. This is something that needs to change as so many individuals are served privately.
Implications for Accessibility Initiatives and Public Policy
Increasing access to mental health care is a core issue in Canada. Specifically, in Quebec there have been repeated suggestions for the public health insurance program to fund psychotherapy. In line with these developments, this study was conducted to investigate the attitudes of practitioners concerning the structure of
a government-funded model of psychotherapy, based on the models established in the UK and Australia (Bradley & Drapeau, 2014). A core component of these government-funded models is outcome tracking (Burgess, Pirkis, & Coombs, 2015). While many in this study are not using measures to track treatment out-come, more than 50% of a similar sample either “agreed” or “strongly agreed” that validated measures to track treatment outcome should be used in a publicly-funded psychotherapy model (Bradley & Drapeau, 2014). There is potentially more openness to these measures than is represented by the rates of their use in this sample.
Similarly, while the use of established clinical guidelines is also low in the cur-rent sample, in Bradley and Drapeau’s (2014) study, approximately two-thirds of the sample “agreed” or “strongly agreed” with the notion of using a psychotherapy approach considered to be evidence-based by a neutral agency after a review of the scientific evidence, again indicating potential openness to the use of tools such as established clinical guidelines. As represented in this sample, and shown in other studies (Hatfield & Ogles, 2004; Ionita & Fitzpatrick, 2014), those in private practice use clinical tools (such as progress monitoring measures) to a lesser extent. There is the potential for improved services by using these tools in the private sector. Initiatives to enhance knowledge and use, particularly of those in private practice, are needed.
Finally, in looking to develop a government-funded psychotherapy program in Quebec the information about the number of treatment sessions from this in-vestigation must be taken into consideration. Based on the information provided about those being served by this sample, such as the majority being able to work and many not having a comorbid mental or physical health problem, it could be said that this does not represent the more severe population of those receiving treatment for mental health problems. However, typically the individuals served by the present sample often receive up to 20 sessions. This is surprising as 20 ses-sions are often the norm for only those with more chronic or severe mental health problems in the government-funded psychotherapy programs offered in the UK and Australia. It appears that longer treatments are the routine care in the private setting.
Additionally, although the present sample reported that many of their clients have private insurance to partially or entirely cover the cost of services, the recent Mental Health Care System Study reported that slightly more than half of the surveyed Canadians feel that their current private insurance coverage does not meet their mental health care treatment needs (Mood Disorders Society of Canada, 2015), let alone those with no insurance coverage. If we want to meet the needs of Canadians best, we need to look at the data in routine practice as a guidepost for structuring services.
However, the objectives of psychotherapy in the public and private sector must also be considered. The focus in the UK program is on symptom reduction and return to work, and once this has been achieved services may stop, whereas there is the possibility that the objectives of the therapy in the private setting may be
different. Perhaps individuals who seek services privately are seeking something different than symptom reduction, therefore explaining the average longer course of therapy. Further investigation would be needed to explore this. Until additional data is collected on the services offered in the private sector, on how the private sector contributes to the wellbeing of service users and on the needs of the latter, as well on the perspectives of practitioners about how these services could be im-proved, efforts to improve access to therapy may not have the results Canadians expect. Notes 1 See https://www.ola.org/sites/default/files/node-files/bill/document/pdf/2007/2007-06/bill---text-38-2-en-b171ra.pdf 2 See https://www.gnb.ca/legis/bill/FILE/58/3/Bill-64-e.htm 3 See http://nscct.ca/wp-content/uploads/2014/07/Act_governing_CT.pdf 4 See https://www.opq.gouv.qc.ca/fileadmin/documents/Systeme_professionnel/Guide_expli-catif_decembre_2013.pdf
5 See the survey conducted by EKOS on behalf of the Canadian Psychological Association (down-loaded on October 8, 2018, at https://www.cpa.ca/docs/File/Poll/Quebec%20Findings%20 (French).pdf). The second survey was conducted by the Ordre des psychologues du Québec (OPQ) in 2012; the data were presented at the OPQ Convention which was held in Montreal on October 25-27, 2012.
6 See https://www.ordrepsy.qc.ca/resume-des-4-exigences for details outlining the title
psychother-apist.
References
American Psychological Association. (2013). Recognition of psychotherapy effectiveness.
Psycho-therapy, 50, 102–109. https://doi.org/10.1037/a0031817
Australian Government Department of Health. (2015a). Better access to psychiatrists, psychologists
and general practitioners through the MBS (Better Access) initiative. Retrieved from http://www.
health.gov.au/internet/main/publishing.nsf/content/mental-ba
Australian Government Department of Health. (2015b). Programs: Access to Allied Psychological
Services (ATAPS). Retrieved from http://www.health.gov.au/internet/main/publishing.nsf/
content/mental-boimhc-ataps
Baker, T. B., McFall, R. M., & Shoham, V. (2009). Current status and future prospects of clinical psychology: Toward a scientifically principled approach to mental and behavioural health.
Psychological Science in the Public Interest, 9(2), 67–103.
https://doi.org/10.1111/j.1539-6053.2009.01036.x
Bradley, S., & Drapeau, M. (2014). Increasing access to mental health care through government funded-psychotherapy: The perspective of clinicians. Canadian Psychology/Psychologie canadienne,
55(2), 80–89. https://doi.org/10.1037/a0036453
Burgess, P., Pirkis, J., & Coombs, T. (2015). Routine outcome measurement in Australia.
Inter-national Review of Psychiatry, 27(4), 264–275. https://doi.org/10.3109/09540261.2014.977234
Byrne, D. G., & Davenport, S. C. (2005). Contemporary profiles for clinical and health psychologists in Australia. Australian Psychologist, 40(3), 190–201. https://doi. org/10.1080/00050060500243434
Canadian Coalition for Seniors’ Mental Health. (2006). National guidelines for seniors’ mental
health: The assessment and treatment of mental health issues in long-term care homes. Retrieved from
http://www.cagp.ca/resources/Documents/CCSMH%20National%20LTC%20Guideline%20 %20May%202006.pdf
Canadian Mental Health Association. (2010). Mental health and addictions issues for older adults:
mental-health-and-addictions-issues-for-older-adults-opening-the-doors-to-a-strategic-frame-work/#.V04Be7w1qkg
Canadian Mental Health Association. (2016). Fast facts about mental illness. Retrieved from http:// www.cmha.ca/media/fast-facts-about-mental-illness/#.V0g_U7w1qkg
Canadian Psychological Association. (2015). Provincial and territorial licensing requirements. Re-trieved from http://www.cpa.ca/accreditation/PTlicensingrequirements/
Cavaliere, R. (2014). Improved access to psychotherapy services: it’s time for action! Canadian
Psychology/Psychologie canadienne, 55(2), 135–138. .http://dx.doi.org/10.1037/a0036447
Centre for Addiction and Mental Health. (2012). Mental Illness and Addictions Facts and Statistics. Retrieved from http://www.camh.ca/en/hospital/about_camh/newsroom/for_reporters/Pages/ addictionmentalhealthstatistics.aspx
Clark, D. M. (2011). Implementing NICE guidelines for the psychological treatment of depression and anxiety disorders: The IAPT experience. International Review of Psychiatry, 23(4), 318–327. https://doi.org/10.3109/09540261.2011.606803
Cousineau, D., & Chartier, S. (2010). Outlier detection and treatment: A review. International
Journal of Psychological Research, 3(1), 58–67. Retrieved from http://revistas.usb.edu.co/index.
php/IJPR
Cullen, W., O’Leary, M., Langton, D., Stanley, J., Kelly, Y., & Bury, C. (2005).
Guidelines for the management of hepatitis C in general practice: A semi-qualitative interview survey of GPs’ views regarding content and implementation. Irish Journal of Medical Sciences,
174(3), 32–37. Retrieved from http://www.ijms.ie
Department of Health. (2008a). Improving access to psychological therapies: Implementation plan –
National guidelines for regional delivery. Retrieved from http://www.iapt.nhs.uk/silo/
Department of Health. (2008b). IAPT three year report: The first million patients. Retrieved from http://www.iapt.nhs.uk/silo/files/iapt-3-year-report.pdf
Drapeau, M., & Hunsley, J. (2014). Where’s the science? Introduction to a special issue of Can-adian Psychology on science in psychology. CanCan-adian Psychology/Psychologie canadienne, 55(3), 145–153. https://doi.org/10.1037/a0037321
Fansi, A., Jehanno, C., Lapalme, M., Drapeau, M., & Bouchard, S. (2016). Efficacité de la psy-chothérapie comparativement à la pharmacothérapie dans le traitement des troubles anxieux et dépressifs chez l’adulte : une revue de la littérature. Santé Mentale au Québec, 40(4), 141–173. https://doi.org/10.7202/1036098ar
Field, A. (2013). Discovering statistics using IBM SPSS statistics (4th ed.). Thousand Oaks, CA: Sage.
Fleury, M. J., Farand, L., Aubé, D., & Imboua, A. (2012). Management of mental health problems by general practitioners in Quebec. Canadian Family Physician, 58, 732–740. Retrieved from http://www.cfp.ca
Gagné, M. (2005). What is collaborative mental health care? An introduction to the collaborative
mental health care framework. Mississauga, ON: Canadian Collaborative Mental Health
Initia-tive. Retrieved from http://www.ccmhi.ca
Garfield, S. L., & Kurtz, R. (1976). Clinical psychologists in 1970s. American Psychologist, 31(1), 1–9. http://dx.doi.org/10.1037/0003-066X.31.1.1.
Grenier, J., Chomienne, M. H., Gaboury, I., Ritchie, P., & Hogg, W. (2008). Collaboration between family physicians and psychologists. Canadian Family Physician, 54(2), 232–233. Retrieved from www.cfp.ca
Hannan, C., Lambert, M. J., Harmon, C., Nielsen, S. L., Smart, D. W., Shimokawa, K., & Sut-ton, S. W. (2005). A lab test and algorithms for identifying clients at risk for treatment failure.
Journal of Clinical Psychology, 61(2), 155–163. https://doi.org/10.1002/jclp.20108
Hatfield, D. R., McCullough, L., Franz, S. H., & Krieiger, K. (2010). Do we know when our clients get worse? An investigation of therapists’ ability to detect negative client change. Clinical
Psychology and Psychotherapy, 17(1), 25–32. https://doi.org/10.1002/cpp.656.
Hatfield, D. R., & Ogles, B. M. (2004). The use of outcome measures by psychologists in clinical practice. Professional Psychology-Research and Practice, 35(5), 485–491. https://doi. org/10.1037/0735-7028.35.5.485
Humbke, K. L., Brown, D. L., Welder, A. N., Fillion, D. T., Dobson, K. S., & Arnett, J. L. (2004). A survey of hospital psychology in Canada. Canadian Psychology, 45(1), 31–41. https://doi. org/10.1037/h0086969
Hunsley, J., Aubry, T. D., Vestervelt, C. M., & Vito, D. (1999). Comparing therapist and client perspectives on reasons for psychotherapy termination. Psychotherapy, 36(4), 380–388. http:// dx.doi.org/10.1037/h0087802
Hunsley, J., Elliott, K., & Therrien, Z. (2014). The efficacy and effectiveness of psychological treatments for mood, anxiety, and related disorders. Canadian Psychology, 55, 161–176. http:// dx.doi.org/10.1037/ a0036933
Hunsley, J., & Lefebvre, M. (1990). A survey of the practices and activities of Canadian clin-ical psychologists. Canadian Psychology/Psychologie canadienne, 31(4), 350–358. http://dx.doi. org/10.1037/h0078953
Hunsley, J., Ronson, A., & Cohen, K. (2013). Professional psychology in Canada: A survey of demographic and practice characteristics. Professional Psychology: Research and Practice, 44(2), 118–126. http://dx.doi.org/10.1037/a0029672
Hunsley, J., Ronson, A., Cohen, K., & Lee, C. M. (2014). Psychological services for children and youth: A survey of Canadian practitioners. Canadian Psychology/Psychologie canadienne, 55(2), 117–125. http://dx.doi.org/10.1037/a0031551
INESSS. (2015). Avis sur l’accès équitable aux services de psychothérapie. Retrieved from https:// www.inesss.qc.ca/fileadmin/doc/INESSS/Rapports/PsychiatriePsychologie/INESSS_Psycho-therapie_VoletII_modalites_conditions_acces.pdf
Ionita, G., & Fitzpatrick, M. (2014). Bringing science to clinical practice: A Canadian survey of psychological practice and usage of progress monitoring measures. Canadian
Psychology/Psycho-logie canadienne, 55(3), 187–196. http://dx.doi.org/10.1037/a0037355
Lee, C. M., Schneider, B. H., Bellefontaine, S., Davidson, S., & Robertson, C. (2012). Inter-professional collaboration: A survey of Canadian psychologists and psychiatrists. Canadian
Psychology/Psychologie canadienne, 53(3), 159–164. http://dx.doi.org/10.1037/a0027619
Lesage, A., Vasiliadis, H. M., Gagné, MA., Dudgeon, S., Kasman, N., & Hay, C. (2006). Prévalence
de la maladie mentale et utilisation des services connexes au Canada: Une analyse des données de l’Enquête sur la santé dans les collectivités canadiennes. Initiative canadienne de collaboration en
santé mentale, Ottawa. Retrieved on December 2, 2018, from http://www.iusmm.ca/Docu-ments/pdf/Hopital/Publications/prevalence_maladie_mentale.pdf
Mental Health Commission of Canada. (2012). Changing directions, changing lives: The mental
health strategy for Canada. Calgary, AB: Mental Health Commission of Canada.
Mood Disorders Society of Canada. (2015). Mental health care system study summary report. Retrieved from http://www.mooddisorderscanada.ca/documents/MDSC_2015_Mental_Health_Care_ Survey_Report.pdf
Mullen, E. J., & Bacon, W. (2004). A survey of practitioner adoption and implementation of practice guidelines and evidence-based treatments. In A. R. Roberts & K. R. Yeager (Eds.),
Evidence-based practice manual: Research and outcome measures in health and human services
(210–218). New York, NY: Oxford University Press.
Norcross, J. C., & Karpiak, C. P. (2012). Clinical psychologists in the 2010s: 50 years of the APA division of clinical psychology. Clinical Psychology: Science and Practice, 19(1), 1–12. https:// doi.org/10.1111/j.1468-2850.2012.01269.x
Norcross, J. C., Karpiak, C. P., & Santoro, S. O. (2005). Clinical psychologists across the years: The division of clinical psychology from 1960 to 2003. Journal of Clinical Psychology, 61(12), 1467–1483. https://doi.org/10.1002/Jclp.20135
Norcross, J.C., Pfund, R., & Prochaska, J. O. (2013). Psychotherapy in 2022: A Delphi poll on its future. Professional Psychology: Research and Practice, 44(5), 363–370. https://doi.org/10.1037/ a0034633
Norcross, J. C., & Prochaska, J. O. (1983). Psychotherapists in independent practice: Some find-ings and issues. Professional Psychology: Research and Practice, 14(6), 869–881. http://dx.doi. org/10.1037/0735-7028.14.6.869
Norcross, J. C., Prochaska, J. O., & Gallagher, K. M. (1989). Clinical psychologists in the 1980s: I. Demographics, affiliations, and satisfactions. Clinical Psychologist, 42, 29–39. Retrieved from http://onlinelibrary.wiley.com/journal/10.1111/(ISSN)1742-9552
Norcross, J. C., & Rogan, J. D. (2013). Psychologists conducting psychotherapy in 2012: Current practices and historical trends among Division 29 members. Psychotherapy, 50(4), 490–495. https://doi.org/http://dx.doi.org/10.1037/a0033512
Ordre des Psychologues du Québec. (2010). Rapport annuel, 2009-2010. Retrieved from https:// www.ordrepsy.qc.ca/pdf/Rapport_annuel_epreuve_finale.pdf
Ordre des Psychologues du Québec. (2015). Rapport annuel, 2013-2014: Une profession en
trans-formation. Retrieved from https://www.ordrepsy.qc.ca/pdf/Rapport_annuel_epreuve_finale.pdf
Overington, L., Fitzpatrick, M., Drapeau, M., & Hunsley, J. (2016). Perspectives of internship training directors on the use of progress monitoring measures. Canadian Psychology/Psychologie
canadienne, 57(2), 120–129. .http://dx.doi.org/10.1037/cap0000051
Overington, L., & Ionita, G. (2012). Progress monitoring measures: A brief guide. Canadian
Psychology/Psychologie canadienne, 53, 82–92. https://doi.org/10.1037/a0028017
Peachey, D., Hicks, V., & Adams, O. (2013). An imperative for change: Access to psychological services
for Canada. Toronto, ON: Health Intelligence.
Prochaska, J. O., & Norcross, J. C. (1983). Contemporary psychotherapists: A national survey of characteristics, practices, orientations, and attitudes. Psychotherapy: Theory Research and Practice,
20(2), 161–173. https://doi.org/10.1037/h0088487
Public Health Agency of Canada. (2014). Mood and anxiety disorders in Canada: Fast facts from the
2014 survey on living with chronic diseases in Canada. Retrieved from http://healthycanadians.
gc.ca/publications/diseases-conditions-maladies-affections/mental-mood-anxiety-anxieux-humeur/alt/mental-mood-anxiety-anxieux-humeur-eng.pdf
Richards, D. A., & Suckling, R. (2009). Improving access to psychological therapies: Phase IV prospective cohort study. British Journal of Clinical Psychology, 48(4), 377–396. https://doi. org/10.1348/014466509X405178
Ronson, A., Cohen, R., & Hunsley, J. (2011). Implementation, evaluation and application of an
electronic practice network for mental health surveillance in Canada. Ottawa, ON: Canadian
Psychological Association.
Stamoulos, C., Reyes, A., Trepanier, L., & Drapeau, M. (2014). The methodological quality of clinical practice guidelines in psychology: A pilot study of the guidelines developed by the Ordre des Psychologues du Quebéc. Canadian Psychology/Psychologie canadienne, 55(3), 177–186. https://doi.org/10.1037/a0037287
Statistics Canada. (2009). Health care professionals and official language minorities in Canada. Re-trieved from http://www.statcan.gc.ca/pub/91-550-x/91-550-x2008001-eng.pdf
Statistics Canada. (2012). Canadian Community Health Survey: Mental Health 2012. Retrieved from http://www.statcan.gc.ca/daily-quotidien/130918/dq130918a-eng.htm
Stokes, D., Mathews, R., Grenyer, B. F. S., & Crea, K. (2010). The Australian psychology work-force 3: A national profile of psychologists in salaried employment or in independent private practice. Australian Psychologist, 45(3), 178–188. https://doi.org/10.1080/00050061003777126 Tabachnick, B. G., & Fidell, L. S. (2007). Using multivariate statistics (5th ed.). New York, NY:
Allyn and Bacon.
Vasiliadis, H., Dezetter, A., Latimer, E., Drapeau, M., & Lesage, A. (2017). Assessing the costs and benefits of insuring psychological services as part of Medicare for depression in Canada.
Psychiatric Services, 68(9), 899–-906. https://doi.org/10.1176/appi.ps.201600395
Warner, R. E. (1991). A survey of theoretical orientations Canadianian clinical psychologists.
Canadian Psychology-Psychologie Canadienne, 32(3), 525–528. https://doi.org/http://dx.doi.
org/10.1037/h0079025
World Health Organization. (2016). Mental health and older adults. Retrieved from http://www. who.int/mediacentre/factsheets/fs381/en/