Direct detection of Rydberg–Rydberg
millimeter-wave transitions in a buffer gas cooled molecular beam
The MIT Faculty has made this article openly available.
Please share
how this access benefits you. Your story matters.
Citation
Zhou, Yan, David D. Grimes, Timothy J. Barnum, David Patterson,
Stephen L. Coy, Ethan Klein, John S. Muenter, and Robert W. Field.
“Direct Detection of Rydberg–Rydberg Millimeter-Wave Transitions
in a Buffer Gas Cooled Molecular Beam.” Chemical Physics Letters
640 (November 2015): 124–136.
As Published
http://dx.doi.org/10.1016/j.cplett.2015.10.010
Publisher
Elsevier
Version
Author's final manuscript
Citable link
http://hdl.handle.net/1721.1/105273
Terms of Use
Creative Commons Attribution-NonCommercial-NoDerivs License
Detailed Terms
http://creativecommons.org/licenses/by-nc-nd/4.0/
Direct detection of Rydberg-Rydberg millimeter-wave
transitions in a buffer gas cooled molecular beam
Yan Zhoua, David D. Grimesa, Timothy J. Barnuma, David Pattersonb, Stephen L. Coya, Ethan Kleina, John S. Muenterc, Robert W. Fielda
aDepartment of Chemistry, Massachusetts Institute of Technology, Cambridge, MA, USA bDepartment of Physics, Harvard University, Cambridge, MA, USA
cDepartment of Chemistry, University of Rochester, Rochester, NY, USA
Abstract
Millimeter-wave transitions between molecular Rydberg states (n ∼ 35) of barium monofluoride are directly detected via Free Induction Decay (FID). Two powerful technologies are used in combination: Chirped-Pulse millimeter-Wave (CPmmW) spectroscopy and a buffer gas cooled molecular beam photoablation source. Hundreds of Rydberg-Rydberg transitions are recorded in one hour with >10:1 signal:noise ratio and ∼150 kHz resolution. This high resolution, high spectral velocity experiment promises new strategies for rapid measurements of structural and dynamical information, such as the electric structure (multipole moments and polarizabilities) of the molecular ion-core and the strengths and mechanisms of resonances between Rydberg electron and ion-core motions. Di-rect measurements of Rydberg-Rydberg transitions with kilo-Debye dipole mo-ments support efficient and definitive spectral analysis techniques, such as the Stark demolition and polarization diagnostics, which enable semi-automatic as-signments of core-nonpenetrating Rydberg states. In addition, extremely strong radiation-mediated collective effects (superradiance) in a dense Rydberg gas of barium atoms are observed.
Keywords: Rydberg-Rydberg transitions, CPmmW spectroscopy, Buffer gas cooling, Superradiance, Stark demolition, Electric structure of molecular ions
1. Introduction
Electronic transitions between Rydberg states of atoms and molecules can provide a description of the electric multipoles and polarizabilities of the ion-core as well as insights into the physical mechanisms and state-to-state rates of energy/angular momentum exchange between the Rydberg electron and the molecular ion-core.[1–6] Microwave and millimeter-wave spectroscopies capture Rydberg-Rydberg transitions with high resolution, sensitivity, and completeness.[7– 12]. Our claim of “completeness” is based on the combination of a priori known n∗-scaling and purposeful access to key information-rich regions of state space.
These results will provide new classes of tests of electronic structure calculations for molecular ions and for the dynamics of electron-ion collisions.[6, 13–15]
To study the structure and dynamics of the molecular Rydberg states with both high resolution and a fast data acquisition rate, we incorporate two cru-cial features. (i) CPmmW spectroscopy is a broad bandwidth high-resolution technique capable of capturing in each chirped pulse 20 GHz of spectrum at 50 kHz resolution. Every two-level system, which has its transition frequency within the bandwidth of the chirped pulse is polarized, and all resultant FIDs are simultaneously detected in the time domain. All members of the set of FIDs generated by a sequence of chirped pulses are phase-coherently averaged in the time-domain. This multiplexed simultaneous direct detection of all FIDs is in marked contrast with the sequential indirect detection of ions generated as a laser frequency is tuned through resonance with individual Rydberg-Rydberg electronic transitions. (ii) The BaF molecular beam generated from our buffer gas cooled ablation source is a factor of 1000 brighter and has 10 times slower laboratory frame velocity than a BaF beam generated by our Smalley-type su-personic jet ablation source. Exploitation of the broad bandwidth, multiplexed, FID-detection scheme would have been impractical without the enhanced bright-ness of the buffer gas cooled ablation source.
The combination of these two transformative technologies, CPmmW spec-troscopy and the buffer gas cooled ablation source, has the potential for
shatter-ing expectations about the limits of what is “knowable” about the structure and dynamics of small molecules. In this paper we report FID-detected laser-laser-CPmmW triple resonance experiments on Rydberg-Rydberg transitions of Ba atoms and BaF molecules. In these experiments we have achieved an ∼106-fold
increase in “spectral velocity” relative to what we had been able to achieve in ionization-detected laser-laser double resonance experiments on CaF. We define spectral velocity as the number of resolution elements sampled per unit time at a specified signal to background ratio. The experiments described in this pa-per demonstrate possibilities for a more global, mechanistically focused class of interaction between experimentalists and their spectroscopic targets. New ex-perimental tactics and goals, organized around physical mechanisms rather than production of archival tables, will be expressed in the design of new classes of ex-periments to capture the “big picture” rapidly and decisively. With n∗-scaling of everything related to the Rydberg electron, which provides an overview of quan-tum mechanical state-space, we can actively search and sample the dynamically most consequential classical physics-based mechanisms for energy and angular momentum transfer between the Rydberg electron and the ion-core. The de-sign of new classes of experiments can capture the “big picture” rapidly and decisively, and reveal how a molecule behaves in both universal (physics) and idiosyncratic (chemistry) ways.
We report no new spectroscopic results in this paper. Our reasons for post-poning the use of our spectrometer to generate data include implementation of plans for improving the sensitivity, reproducibility, and, most importantly, the assignment velocity of spectral features. One of the most vexing problems results from the combination of the ∼100 MHz Doppler width of the laser tran-sitions with the ∼500 MHz longitudinal mode spacing of the Nd:YAG pumped dye laser. In addition, we are developing an improved suite of diagnostics that are needed for real-time, semi-automatic assignments of exceptionally data-rich spectra. These diagnostics include: (i) “Stark demolition” for distinguishing core-penetrating (CP) from core-nonpenetrating (CNP) Rydberg states (states with high orbital angular momentum (` > 4) and a small quantum defect
(δ < 0.05)) and sorting the CNP Rydberg states according to orbital angular momentum of the Rydberg electron, `, and the rotational angular momentum of the ion-core, N+, (ii) polarization diagnostics to determine total angular mo-mentum of molecules, J , (iii) use of the phase of the FID relative to that of the chirped excitation pulse to determine whether a transition in the CPmmW spectrum is upward or downward in energy, and (iv) “stacked plot” pattern recognition, to determine the ion-core ∆N+, from a collection of CPmmW
spec-tra, each CPmmW spectrum recorded as the second tunable laser is tuned, in 100 MHz steps through a region of the Rydberg manifold of width ∼∆n∗ = 4 (∼14 cm−1 at n∗ = 40).
Our focus in this paper is on barium monofluoride, BaF, because it pro-vides several uniquely convenient properties for molecular FID experiments. The 4.3 < n∗ < 14.3 Rydberg states of BaF have previously been extensively investigated and assigned[2, 16–19], which allows us to simplify the exploration of excitation schemes and to accelerate the assignments of the higher-n∗ Ry-dberg states. The electronic structure of BaF is maximally simple, consisting of a doubly closed shell (Ba2+ and F−) ion-core plus only one electron (the
Rydberg electron). Perhaps most importantly, BaF is one of the small number of diatomic species in which the first dissociation limit lies higher in energy than the ionization energy for states with v+ = 0 or 1 (where v+ is the
vi-brational quantum number of the ion-core). As a result, nonradiative decay via predissociation cannot occur from these states, and the v+ = 0 Rydberg states have lifetimes > 100 µs, comparable to those of atomic Rydberg states. The long lifetimes ensure that the FID radiation from millimeter-wave polar-ized Rydberg-Rydberg coherences is not quenched by fast population decay. In addition, the Rydberg state lifetimes are sufficiently long to enable population of high angular momentum states via a sequence of stepwise millimeter-wave excitations. We can selectively interrogate regions of Rydberg state space in which physically distinct interaction mechanisms are at play. BaF is thus an ideal candidate for systematic investigations of molecular Rydberg states by FID-detected electronic spectroscopy. This investigation will permit separate
characterization of physically explicit classes of mechanism for the exchange of energy and angular momentum between the Rydberg electron and the ion-core. This paper is organized as follows: in the Experimental Methods section, we describe the apparatus in which the CPmmW spectrometer and buffer gas cooled molecular beam source are combined. This apparatus is used for rapidly recording spectra of Rydberg-Rydberg transitions and superradiance. In the Results section, we first describe typical BaF FID spectra and Ba superra-diance spectra. Then, we introduce three new techniques, phase extraction, Stark demolition, and multi-pulse excitation, for semi-automatically extracting information and assisting spectroscopic assignments. In the Conclusions and Prospects section, we illustrate a highly efficient laser-millimeter-wave survey spectrum as a comprehensive demonstration and summary of our experimental schemes. Details of optimization of laser ablation and estimating the uncertain-ties of phase extraction are presented in the Appendices.
2. Experimental Methods
2.1. State preparation
Rydberg states of Ba (n∗p states, n∗ = 34 - 74) are populated by a pulsed dye laser (Lambda Physik Scanmate 2E, 0.1 cm−1), frequency doubled by a β-BBO crystal, shown in Figure 1 (a). Rydberg states of BaF are populated via the two-photon excitation scheme shown in Figure 1 (b). Two pulsed dye lasers (Figure 2, xvii) (First laser: Lambda Physik Scanmate 2E, 0.05 cm−1 intracavity etalon narrowed; second laser: Sirah Precision Scan, 0.05 cm−1dual
grating narrowed) are used in a stepwise excitation scheme to transfer BaF from the X2Σ+ ground state to a Rydberg state via the C2Π
3/2intermediate state.
Both dye lasers are pumped by one injection-seeded Spectra-Physics GCR-290 Nd:YAG laser with a ∼7 ns pulse duration. Initial Rydberg states of Ba (n∗ = 34 - 74) and BaF (n∗ = 35 - 50) are located by recording low resolution survey spectra, employing a pulsed field ionization (PFI) TOF-MS detection scheme, described in Ref.[20]. The PFI spectra shown in Figures 1 (c) and (d) illustrate
Figure 1: Schematic diagram of energy levels of Ba (a) and BaF (b), and PFI spectra of Ba Rydberg states (c) and BaF Rydberg states (d). The laser wavelength in (c) and (d) are uncalibrated, and only relative frequencies are used for assignment.
the difficulty in assigning and interpreting molecular Rydberg spectra due to the combination of a high density of states and limited laser resolution.
2.2. CPmmW spectrometer
Chirped-Pulse millimeter-Wave (CPmmW) spectroscopy is an extension of the Chirped-Pulse Fourier Transform Microwave (CP-FTMW) technique devel-oped by the Brooks Pate research group[21–23], to a higher-frequency regime[24]. The advantages of chirped-pulse spectroscopy, namely the combination of broad-band excitation, multiplexed heterodyne detection, high resolution, and mean-ingful relative intensities, have been demonstrated in pure rotation spectra of large and small molecules[24, 25]. Distinct from conventional millimeter-wave spectroscopy that employs a thermal detector or other indirect detection schemes (typically ion detection), chirped-pulse techniques make it possible to
capture an entire spectrum (400,000 50 kHz resolution elements) in a single chirp (20 GHz bandwidth) rather than sequentially, one resolution element at a time. Because of this combination of survey capability with high resolution, chirped-pulse techniques have the potential to transform the experimental strategies and goals of traditional microwave spectroscopy.
The extension of chirped-pulse schemes into the millimeter-wave regime has been hampered by the unavailability of high power millimeter-wave sources, which limits the degree of polarization that can be achieved for typical rotational transitions. Pure rotation transitions have electric dipole transition moments on the order of ∼1 Debye. However, the electric dipole transition moments between Rydberg states scale as (n∗)2, resulting in kilo-Debye electric dipole ∆n∗ ∼ 1 transition moments between states with moderately high (n∗ > 30) principal quantum numbers. This unique feature of Rydberg states more than compen-sates for the present limits on millimeter-wave power. It permits simultaneous full polarization of many Rydberg-Rydberg transitions by a single broadband pulse. The value of extending low frequency microwave spectroscopy to high frequency millimeter or sub-millimeter wave spectroscopy for the study of Ry-dberg electronic transitions is based on: (i) the ability to interrogate selected stroboscopic resonances, which reveal the physical mechanisms of resonant inter-actions between the Rydberg electron and the internal motions of the molecular ion-core[26–28]; (ii) the electric dipole ∆n∗ ∼ 1 transition moments are suffi-ciently large to be completely polarized by millimeter or sub-millimeter wave sources, but are sufficiently small to minimize the dipole-dependent frequency shifts, dipole blockade, and broadening mechanisms, such as stray inhomoge-neous electric field or blackbody radiation induced Stark broadening[29–32], and long-range dipole-dipole collisional dephasing[33–35].
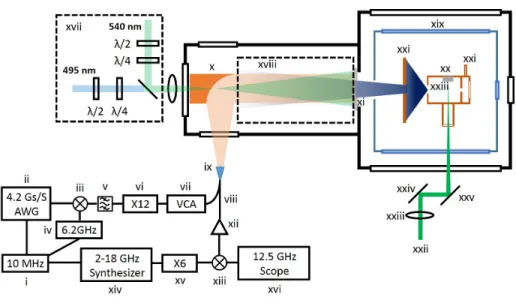
The CPmmW spectrometer, shown in Figure 2, is similar to that in Ref [24]. We review the main components here. To generate a broadband millimeter-wave pulse at ∼85 GHz, a 4.2 GigaSample/second arbitrary millimeter-waveform generator (AWG) (ii) creates a crafted RF pulse (user-defined pulse duration, bandwidth, initial phase, and amplitude) at 0.2-2.0 GHz. A triply-balanced mixer (iii)
mixes the RF pulse with the output of a 6.2 GHz phase-locked oscillator (iv) to create a pulse consisting of both sum and difference frequency components (6.4-8.2 GHz and 4.2-6.0 GHz). The upper frequency sideband (6.4-8.2 GHz) is selected by a bandpass filter (v) and input to an active frequency doubler followed by an active frequency sextupler (vi). The ×12 multiplied output pulse retains the pulse duration of the input pulse, but a ×12 increased frequency range (12×f = 76.8-98.4 GHz), bandwidth (12×∆f = 21.6 GHz), and initial phase (12×δφ). The maximum millimeter-wave output power is ∼30 mW, which can be attenuated and shaped by a fast (10 ns) Voltage Controlled Attenuator (VCA) (vii). The millimeter-wave pulse is broadcast into free space from a 23 dB rectangular standard gain horn (ix) and collimated to a beam waist of ∼3 cm by an f = 75 cm parabolic mirror (x). The radiation is reflected by a nickel mesh (xi), and counter-propagates along the same path in a second pass through the sample, resulting in an active volume of ∼100 cm3. The backward
propagating chirped excitation pulse and resultant FID can be collected by the same standard gain horn (ix). A 10 dB directional coupler (viii) provides a 10 dB attenuation of the broadcast arm and directs 90% of the received FID power into the detection arm. The received millimeter-wave signals are amplified (xii) and then mixed (xiii) with the output of another sextupler (xv) driven by a frequency synthesizer (xiv). The down-converted signal is digitized and averaged in the time-domain by a 12.5 GHz oscilloscope (xvi). To maintain phase stability during the measurements, all frequency sources used in this spectrometer are phase locked to a single 10 MHz Rubidium frequency standard (i).
The frequencies input to the oscilloscope are down-converted by mixing the millimeter-wave radiation with an intermediate frequency. Due to the absence of quadrature phase information in our CPmmW spectrometer, we cannot re-cover the millimeter-wave frequency unambiguously using only one intermediate frequency. Our method is to record the same spectrum twice with two different intermediate frequencies, such as f1= 86.4 GHz and f2= 88.2 GHz, and match
the overlapped peaks from the two spectra to recover their frequencies. How-ever, because this frequency recovery method requires coincidence of the signals
Figure 2: Schematic diagram of the experimental setup. Each numbered component is de-scribed in the main text.
with different intermediate frequencies, it can only be applied to the individual signals which can be distinguished from the noise, but cannot transform the en-tire spectrum unambiguously. In order to display the unique features of both the signal and noise, in Figures 3 and 6, we use down-converted frequencies as the frequency axis of spectra with multiple transitions, while we use the recovered real frequencies for spectra that contain only a single transition.
2.3. Buffer gas cooled molecular beam source
We have previously demonstrated the capabilities of FID-detected CPmmW spectroscopy on Rydberg-Rydberg transitions of Ca atoms[7, 8]. However, our initial efforts to record FID-detected molecular Rydberg-Rydberg transitions in a Smalley-type laser ablation supersonic beam source, similar to what we had used for atomic spectra, were thwarted by the ∼100 times lower number density of molecules (∼104cm−3) that could be prepared in a single rovibronic Rydberg
state, due both to the lower efficiency of generating the desired molecules in the ablation source and dilution of the electronic ground state population among rotation-vibration quantum states.
Buffer gas cooling, a technique originally developed in Frank De Lucia’s re-search group[36, 37] and extended to generation of cold molecular beams in John Doyle’s research group[38–41], is a method for creating bright, slow beams of atoms and molecules via collisional cooling by an inert atomic gas. A schematic diagram of the neon buffer gas cooled molecular beam source appears in the up-per right hand section of Figure 2. The apparatus is based on a two-stage pulsed tube helium refrigerator (not shown). The first stage (40 K) is used to cool the radiation shield (xix), and the second stage (4 K) is used to cool the cold cell (xx) and gas filling tube (xxi) to 20 K (controlled by small resistive heaters) and a cold skimmer (xxii) to 4 K. A BaF2pellet (xxiii) is placed inside the cold
cell, ∼2.5 cm from the output aperture. A 7 ns pulse of tightly focused 532 nm light (xxii) is used to create a plasma near the surface of the target by laser ablation. It should be noted that the ablation of a salt target is less facile than a metal target, and required extensive optimization of the target preparation and ablation laser properties (see Appendix A). The ablated atoms/molecules are cooled to the equilibrium temperature (20 K) by more than 100 collisions with neon buffer gas (∼ 20 mtorr), which is introduced into the cell at a 10 SCCM (Standard Cubic Centimeters per Minute) flow rate. About 10% of the ablated atoms/molecules are extracted as a beam from the cold cell by hydrody-namic expansion through the output aperture, which results in further cooling to final translational and rotational temperatures of ∼3 K with a laboratory frame velocity slower than 200 m/s. Relative to a supersonic beam source, the buffer gas-cooled beam has a similar final temperature in the center of mass frame, but is much denser (a factor of 1000) and slower (a factor of 10 in the laboratory frame), which allows spectroscopic investigation of Rydberg species with unprecedented signal strength and resolution. The high yield of ablated species is due to gas dynamics effects, which remain incompletely understood. The center of the beam is selected by passage through a cold skimmer (xxi) and the beam propagates into the detection chamber. The number densities in the detection chamber (∼25 cm downstream from the cell) of (1S) Ba atoms
state are measured by Laser Induced Fluorescence (LIF) to be >109 and >107 cm−3, respectively, and the BaF rotational temperature was measured to be 3 K. The laboratory frame forward velocity is measured by the CPmmW spectra to be ∼200 m/s, and is discussed further in Section 3.1. At optimum performance, the shot-to-shot intensity fluctuations of the buffer gas cooled beam source are <30% and the experiments can run stably for more than 10 hours at a 10 Hz ablation repetition rate.
A buffer gas cooled beam source generates a 1000 times larger number den-sity of atoms/molecules in a single Rydberg state than from a supersonic jet ablation source. However, in a dense Rydberg gas, interparticle dipole-dipole in-teractions can shorten the coherence lifetime via cooperative or collision-induced dephasing[7, 33, 42, 43]. This dephasing is more serious in Rydberg transitions with large electric dipole transition moments (µ ∼ 1000 Debye) and degrees of polarization (P ∼ 1), than typical rotational transitions (µ ∼ 1 Debye, P < 0.1). To minimize dephasing while still collecting sufficient FID radiation from the sample, we increase the interaction volume (∼100 cm3) while keeping the
number density of Rydberg states <106cm−3. In addition, the geometry of the
sample affects how much forward FID radiation can be collected by the detec-tion horn, as described by Pf orward ∝ L
√
S, where S and L are respectively the cross-sectional area and the length of the interaction volume relative to the millimeter-wave propagation direction. Therefore, to maximize the forward FID radiation, a cylindrically shaped interaction volume is optimal (3 cm diameter × 10 cm length). However, the diameter of the cylindrical cross section must be ∼five times larger than the millimeter-wave wavelength to minimize diffractive losses.
2.4. Minimization of stray electric and magnetic field
In addition to interparticle interactions, Rydberg states are extremely sen-sitive to stray electric and magnetic fields, which can shift, broaden, and split spectral lines, as well as induce parity and mJ mixings of states[9, 30]. The
active volume is essential to maximize resolution and signal strength. For CNP Rydberg states, an electric field as small as 10 mV/cm is sufficient to induce strong interactions among CNP Rydberg states tightly clustered in state space around integer-n∗. This sensitivity to electric fields results in rapid dephasing
and broadening of the FIDs.
The primary source of stray electric fields is ions produced via multiphoton ionization processes as unwanted byproducts during the two-step laser excita-tion of the initial Rydberg state. Due to large ion-Rydberg collisional cross sections (σ ∼ 10−4 cm2[44]), even ions at a density as low as 104 cm−3 can
cause homogeneous coherence dephasing with T2< 1 µs, resulting in a
signifi-cant decrease in the intensity of the FID signal. In addition, the scattering of excitation laser radiation by the internal walls of the vacuum chamber can also create free electrons or ions, especially when the intense pump lasers are termi-nated at the nickel mesh that is used to reflect the millimeter-waves. Therefore, in typical FID-detected CPmmW experiments, the intensities of the pump lasers are kept a factor of three smaller than the saturation intensity.
Stray magnetic fields, such as the Earth’s magnetic field (∼0.5 Gauss), can induce a Zeeman splitting of ∼700 kHz. Magnetic fields produced by other sources, such as magnetized components in the vacuum system, can also be suf-ficiently large to induce measurable splittings. We minimize the magnetic field in the active volume with three pairs of rectangular Helmholtz coils. In order to maintain a uniform magnetic field over a relatively large area, the Helmholtz coils are large (24” × 24” × 42”) and placed around the entire chamber and cryostat. Two magnetometers are mounted on the side flanges of the detection chamber to monitor magnetic fields near the interaction volume.
3. Results
3.1. FID detected spectra of Rydberg-Rydberg transitions in Ba and BaF Typical FID-detected spectra of Ba and BaF Rydberg-Rydberg transitions, obtained using the CPmmW spectrometer/buffer gas cooled molecular beam are
shown in Figure 3. Plot (a) is a single-shot FID-detected spectrum of the Ba 42p-40d transition. Each peak is split into two resolved Doppler components, which result from co-propagation and counter-propagation of the millimeter-wave radiation relative to the atomic beam. By measuring this Doppler splitting, we obtain the average forward velocity of the buffer gas cooled beam, ∼200 m/s, which is consistent with laser absorption measurements from the Doyle group[39].
The linewidth is governed by three factors. The most important dephas-ing mechanism, especially at high number density, is homogeneous superradiant decay[42, 43]. We confirm this by measuring the linewidth as a function of average number density, as shown in Figure 4, Plot (d). The number density can be further reduced to <104 cm−3, which results in a contribution to the linewidth from superradiance of 40 kHz. However, at this number density, the signal is so weak that a spectrum with an acceptable signal to noise ratio re-quires more than 100 averages. In addition to superradiance, Rydberg states with large electric dipole transition moments are also sensitive to the incoherent electromagnetic field generated by the room temperature blackbody radiation. This interaction leads to a ∼10 µs decoherence at n∗∼40, which corresponds to ∼30 kHz linewidth. Finally, Doppler broadening due to the translational tem-perature and the divergence of the molecular beam (geometric Doppler) results in ∼5 kHz and ∼40 kHz linewidth respectively. This latter Doppler broadening can be decreased by using a skimmer to select the central region of the molecular beam or by reducing the diameter of the excitation laser beam. Decreasing the geometric Doppler width by a factor of M also decreases the total signal strength by a factor of M1/2. However, making the beam diameter too small can result
in diffractive losses. Our current 3 cm diameter of the interaction volume is a compromise between these two opposite effects. Therefore, in principle, our current linewidth limit is set by blackbody radiation and Doppler broadening when we reduce the number density of Rydberg atoms/molecules significantly (<1×104 cm−3). However, in a practical experiment, to obtain spectra with
Figure 3: Typical FID-detected spectra of Ba and BaF Rydberg-Rydberg transitions. Plot (a) is a single-shot spectrum of the Ba 42p-40d transition obtained at reduced number density (<5×104 cm−3). Plot (b) displays a multi-pulse averaged (100 averages, 10 s at 10 Hz repetition rate) spectrum of BaF in the region of n∗∼35. The red arrows mark all FID-detected signals, confirmed by blocking either of the excitation lasers. Other features are due to the electronic noise of the CPmmW spectrometer. The frequency axis in plot (b) is prior to up-conversion.
resolution to ∼150 kHz by increasing the number density (>1×105cm−3), and, in so doing, incur some superradiant broadening. Figure 3, Plot (b) is a broad-band (76.8-98.4 GHz) spectrum of BaF in the region of n∗∼35, recorded in 10 s at 10 Hz repetition rate. Multiple transitions are recorded simultaneously in each millimeter-wave chirped pulse. Since the entire spectrum is collected after a single chirp, the relative transition intensities are unchanged by averaging over many pulses.
3.2. Superradiance in a dense Rydberg gas
Previous experiments showed signs of superradiance[7]. The lower number density and larger Doppler width limitations of our earlier supersonic beam experiment precluded systematic study of strong superradiance. Both of these obstacles are eliminated with the buffer gas cooled beam setup. Therefore, much stronger superradiant effects are observed.
Figure 4, plots (a) and (b) respectively show the emitted radiation field from dilute and dense Rydberg gases in the time-domain. To eliminate white noise
in the time-domain, which limits the intensity resolution at large time, we de-modulate the FID signal near resonance, shown as black curves in Figure 4, plots (a) and (b). After demodulation, we can observe signals below the white noise level. At low number densities, the coherence is created exclusively by the excitation pulse. Its amplitude is maximum at t=0 and it decays exponentially. However, at high number density, the coherence initiated by the excitation pulse is amplified by the cooperative atom-photon interactions in the dense Rydberg gas with C=Nλ3/4π2>>1, where C is the “cooperative parameter,” N is the
number density, and λ is the wavelength of the radiation. During this amplifi-cation process, the energy stored in an inverted population system decreases as the population originally in the energetically higher state is transferred into the lower state by stimulated emission. When the population difference is zero the coherence is maximized. The superradiant emission continues until the popu-lation is entirely in the lower state. Unlike the conventional FID picture, the coherence here is not created exclusively by the external excitation pulse; it con-tains a significant contribution from the population inversion[42]. In addition, the maximum coherence amplitude, the rate of amplification, and the decay rate strongly depend on the number density of the Rydberg sample.
We compare the lineshape and linewidth of the Ba 42p-40d transition (a downward transition) at high and low number densities in Figure 4, plot (c), which is obtained by Fourier transforming plots (a) and (b). At high num-ber density the linewidth is much broader than that at low numnum-ber density. In addition, the center frequency of the radiation is also shifted by ∼1 MHz. This transient frequency shift is absent in conventional FID radiation. Plot (d) shows the linear dependence of the linewidth on the number density. These pre-liminary results demonstrate direct observation of strong superradiance effects, including amplification, fast radiative decay, and frequency shifts in dense Ryd-berg gases using the CPmmW technique in combination with a buffer gas cooled beam source. However, due to the relatively large inhomogeneity of the num-ber density in our large interaction volume (the density near the beam source is 10 times higher than that near the parabolic mirror, see Figure 2), ∼30%
shot-to-shot number density fluctuations, and the lack of quantitative number density measurements, it is difficult to compare our preliminary measurements with theory. More detailed and systematic measurements and analysis are in progress.
3.3. Phase extraction
The millimeter-wave radiation can induce both upward and downward tran-sitions. The direction of the transition can be obtained from a time-domain spectrum by two methods. (1) Transient nutation provides a direct, visual in-dication of the transition direction[7]. An absorptive nutation represents an upward transition, and an emissive nutation represents a downward transition. However, use of this method requires either a single frequency or slowly chirped excitation pulse as well as a relatively strong transition and high signal to noise ratio in the time-domain. (2) The phase difference between the excitation pulse and the FID radiation is a sensitive and generally applicable diagnostic of the direction of a transition. For an upward transition, the phase exhibits a dis-continuous shift by π. For a downward transition, there is no such phase shift. This method can be used for a broadband chirped pulse excitation and relatively weak FID transitions. However, the phase shifts are usually not obvious due to the broadband background noise in the time-domain. Colombo has developed a technique that first filters the time-domain noise, and then fits and extracts the phase of the excitation pulse and the FID separately in the time-domain[8]. We have developed a complementary technique that applies a FFT to ex-tract the phases of the excitation pulse and the FID in the frequency-domain. This method has advantages for a broadband chirped pulse in which multiple transitions are excited. However, estimating the phase uncertainty and opti-mizing the experimental conditions for accurate phase extraction is non-trivial. In Appendix B, we discuss a single transition polarized by a single frequency excitation pulse first, and then extend the analysis to a more general situation, in which multiple transitions are polarized by a broadband chirped pulse. We have proved that, when the chirped excitation pulse is sufficiently weak,
result-Figure 4: Direct observation of superradiance in a dense Rydberg gas. Plots (a) and (b) display the difference between the radiation field of the Ba 42p-40d transition (a downward transition) induced by a 30 ns, 20 GHz bandwidth chirped pulse (effective pulse area <<π/2) at relatively high number density (1×107 cm−3) and relatively low number density (5×105 cm−3), respectively. The blue curves represent the original raw data in the time-domain. The black/demodulated curves show the time-dependent Ba polarization of this transition in a rotating frame near the resonance frequency. The Fourier transforms of plots (a) and (b) are shown in plot (c). The broad pedestal of both spectra might come from uncompensated magnetic field. Plot (d) displays the linear dependence of the linewidth on the relative number density. The uncertainty in the number density is not measured directly, but estimated from the inhomogeneity of the geometric beam expansion and 30% shot-to-shot number-density fluctuations in the buffer gas cooled beam.
ing in a polarization fraction <π/6, we can extract the phase difference between the excitation pulse and the FID with uncertainty π/10, which is sufficient to distinguish upward from downward transitions.
3.4. Stark demolition spectroscopy
As mentioned in Section 2.4, Rydberg states are exceptionally sensitive to DC electric fields. Even a small DC electric field can strongly mix neighboring `, ` + 1, opposite parity Rydberg states, thereby inducing measurable frequency shifts and intensity modifications of the FID strength[45, 46]. The Stark-mixing angles are proportional to the electric dipole transition moment, µ, and inversely proportional to the energy spacing, ∆E = 2R∆δ/n∗3, where R is the Rydberg constant, ∆δ = δ2 - δ1. The electric dipole transition moment, µ, is almost
constant for Rydberg states with similar values of n∗. However, the energy spacing, ∆E, determined by ∆δ, decreases rapidly as the angular momentum of the Rydberg electron ` increases. Therefore, for a moderate DC electric field (∼1 V/cm), the mixing angles of the Rydberg states with low-` (CP Rydberg states) are negligible, and the FID frequency and intensity are almost the same as in the field-free measurements. However, the mixing angles of pairs of Rydberg states with high-` (CNP Rydberg states) are significant. A strong effect on the FID frequency and intensity is expected. Therefore, by observing changes in FID signals caused by a series of homogeneous, DC electric fields of different strengths, it is straightforward to separate the CP Rydberg states that are spread out in the interval between successive integer values of n∗from the CNP Rydberg states which are densely clustered near integer-n∗.
In this paper, we present a preliminary experimental demonstration of “Stark demolition” in the BaF Rydberg system. In a Stark demolition experiment, all parameters are similar to typical FID detection experiments, except for the addition of a 0-16 V, 10 µs rectangular electric field pulse. To apply a homo-geneous DC electric field, we introduce into the detection chamber a large pair of parallel, mirror-finish, stainless steel plates (4” × 6” × 1/16”) separated by 3” (xviii in Figure 2). The electric field pulse is applied 10 ns after the
ter-mination of the chirped millimeter-wave excitation pulse and overlapped with the FID radiation. In this experiment, the lasers and millimeter-waves pump and polarize the same Rydberg-Rydberg transitions as in typical experiments carried out in the absence of the electric field. Then, the abrupt switching on of the electric field diabatically mixes eigenstates with opposite parities and small detunings. A single component of the original FID, with a specific frequency and fixed initial phase, is diluted into multiple components with a broad dis-tribution of frequencies and initial phases. This results in multiple destructive interferences. In Figure 5, plot (a) shows a transition with two CP Rydberg states with zero and 1 V/cm DC electric fields. Their relative intensities are similar, as expected. However, the 10 MHz frequency shift is not understood completely. Plot (b) shows a transition that involves at least one CNP Rydberg state. It is clear that at 1 V/cm DC electric field, almost all sharp peaks in the FID spectrum are washed out and replaced by a broad feature (∼20 MHz). In addition to the qualitative separation of CP Rydberg states and CNP Rydberg states, it is also possible to sort the CNP Rydberg states according to their ` values. In Figure 5, plot (c) and plot (d) display the DC field-induced changes in the amplitude and lineshape of the FID signal from two transitions, which both involve at least one CNP Rydberg state. As the amplitude of the DC electric field pulse is increased, the amplitude of the central FID peak in plot (c) decreases relatively more slowly than that in plot (d). The quantum defect (the degree of core-penetration) of the CNP Rydberg state in plot (c) is larger than that in plot (d). It is likely that the former state has smaller a ` value than the latter. Even better, with careful calibration, we believe that the quantum defect δ could be extracted directly and quantitatively. More measurements and analysis are in progress.
3.5. Stark demolition diagnostics
The Stark-demolition diagnostic permits the Rydberg energy levels observed in an initial batch of CPmmW spectra of a new molecule to be partitioned im-mediately into CP vs. CNP subsets. All of the CNP energy levels are described
Figure 5: Stark demolition spectroscopy. Plots (a) and (b) display the contrast between typical CP Rydberg states and CNP Rydberg states with and without a DC electric field. The 10 MHz frequency shift in plot (a) has not been completely understood. Plot (c) and (d) display more details of the behavior of CNP Rydberg states with the DC electric field increased in small steps. Careful measurements could sort the ` quantum number or even extract the value of the quantum defect δ quantitatively. Plots (b) and (d) are from the same transition.
by near-integer values of the effective principal quantum number, n∗. Thus these levels provide the most accessible key to a global analysis, starting with an approximate value for the v+ = 0, N+ = 0 ionization energy. Once the ionization potential (IP) is known, the energies of all integer-n∗members of all
CNP Rydberg series that converge to the v+= 0, N+ = 0 level of the ion may
be predicted and experimentally verified. Since CNP Rydberg states reach the Hunds case (d) limit (the extreme limit of `-uncoupling) at low-N1, the ion-core
rotational quantum number, N+, becomes approximately good. Thus all strong
transitions between CNP Rydberg states obey the ∆N+ = 0 selection rule.
Initial CPmmW spectra are targeted at |∆n∗| ≈ 1, ∆N+ = 0 transitions
out of laser-excited levels that span approximately five consecutive values of the effective principal quantum number (41 ≤ n∗ ≤ 45 for our 60-100 GHz spectrometer). The CNP energy levels, identified by Stark demolition, may be arranged into separate clusters of Rydberg series, each of which terminates on a different N+ rotational level of the molecular ion-core. These (n∗,N+)
assignments of the CNP Rydberg states are based on: (i) their near-integer-n∗ value, (ii) their very strong ∆N+ = 0 Rydberg-Rydberg transition propensity
rule, and (iii) the negligibly small ∆N = 0, ∆N+6= 0 off-diagonal interactions
between Hunds case (d) Rydberg states. This permits accurate determination of IP(v+= 0, N+= 0), the ion-core rotational constant, B+, and assignments
of the n∗ and N+ quantum numbers of all observed CNP Rydberg states. Since the sensitivity of a CNP Rydberg state to a DC electric field depends
1Hunds case (d) corresponds to the extreme limit of ` uncoupling. The off-diagonal matrix element, −B[N+`−+ N−`+], of the rotational Hamiltonian becomes, as N increases, much larger than the energy difference between the |N `λi and |N `λ + 1i basis states. This energy difference is 2B(2λ+1)+2∆δR/n∗3, where ∆δ is the difference between the quantum defects of the |N `λi and |N `λ + 1i CNP Rydberg states and R = 109737cm−1. For the 43f complex of BaF (B = 0.23cm−1), ∆δ >> 0.1 (an upper bound for all CNP `-complexes), the N = 1, π, σ and N = 3, φ, δ ratios of the ∆λ = 1 matrix element to energy denominator are respectively >0.276+2B241/2B and 0.276+10B361/2B and increase linearly with N . All ` ≥ 3 Rydberg complexes reach the case (d) limit at low-N .
strongly on the value of the Rydberg electron orbital angular momentum, the energy levels assigned to each N+ Rydberg series may be further partitioned into distinct (N+,`) series. Each member of an (N+,`) Rydberg series is further split into a closely spaced cluster of `R = N − N+ components by the very
weak interaction of the Rydberg electron with the non-spherical ion-core. `R =
N −N+is the projection of the Rydberg electrons ` on the ion-core rotation axis.
Since N+ is an approximately good quantum number in Hunds case (d) and N
is a rigorously good quantum number, `R is an approximately good quantum
number.
Each of the different (`,`R)-components of an n∗,N+ level-cluster is
asso-ciated with a different n∗-independent value of the quantum defect. For each laser-excited single CNP eigenstate, the CPmmW spectrum will include transi-tions into 3 or fewer `Rcomponents of each n∗,N+,` state, owing to the rigorous
∆N = 0, ±1 selection rule. Polarization diagnostics will yield assignments of the three ∆N = ∆`R possibilities[47].
The CPmmW spectrum provides an extensive sample of CNP Rydberg states with definite n∗ and N+ assignments and probable N and ` assignments. The
relative energies of all eigenstates sampled in the totality of CNP spectra may be measured at a precision better than 10 kHz by exploiting one microwave transition that cross-links the states observed in a CPmmW spectrum originat-ing from one laser-populated launch state to those originatoriginat-ing from a different launch state. Increasingly large groups of microwave-linked linked Rydberg en-ergy levels are fitted to an independent-channel Rydberg equation appropriate for CNP Rydberg states, where the quantum defect, δ`,`R, is a function of ` and
`R: En∗,v+=0,N+,`,` R= [IP (v += 0, N+= 0) + B+N+(N++ 1)] − R (n − δ`,`R) 2 (1)
Any deviation from this case (d) independent-energy-level pattern will be due to an identifiable inter-series interaction. Such deviations reveal the phys-ical nature and strength of each mechanism for the exchange of energy and
angular momentum between a molecular ion and a CNP Rydberg electron. The fitting of the energy levels should be done by a robust rather than least squares procedure. The relevant property of a robust fit is that outliers minimally influence convergence of the fit and, as convergence is approached, more and more case (d) eigenstates become associated with a correct quantum number assignment.
3.6. Multi-pulse spectroscopy
A chirped millimeter-wave pulse with effective π/2 pulse area produces not only FID radiation but also population transfer between Rydberg states. We have demonstrated the ability to populate high-` Rydberg states via a multiply-resonant excitation sequence[8]. We report here a new experiment with a pulse sequence consisting of broadband chirped pulses (22 GHz bandwidth), instead of single-frequency pulses. This new method combines survey and high resolution spectroscopy in a single measurement. However, we must be aware that a single broadband pulse could polarize more than one transitions, which can be revealed by the direction of the frequency chirp. Figure 6, plots (a) and (b), show two spectra excited by broadband chirped pulses with the same parameters except for chirp direction. In the lower plot of (a), the increasing frequency chirped pulse sequentially excites transitions I and II. Therefore, population can be sequentially transferred from state 1 via state 2 to state 3. However, in the upper plot of (a), the decreasing frequency chirped pulse is resonant with transition II earlier than I. The population in state 1 cannot be transferred to state 3 before state 2 is populated. Therefore, the initial population in state 1 is transferred to state 2 and only transition I is polarized. Extending from one broadband pulse to three pulses, as shown in Figure 6, plot (b), we observe four transitions in the lower plot, while only one appears in a spectrum excited by a single broadband chirped pulse, as shown in the upper plot. To reveal the connections among these four transitions, we use a pulse sequence of multiple single frequency pulses (the same as in conventional multiple resonance spectroscopy) to judge whether two transitions are sequential or parallel. We find that there are five states involved
Figure 6: Multiple resonance millimeter-wave spectra in BaF. The lower plot of (a) is a spectrum obtained with excitation by a 76-98 GHz chirped pulse with increasing frequency. Two transitions (I and II) are observed. The upper plot of (a) is obtained with excitation by a 98-76 GHz chirped pulse with decreasing frequency. Only one transition (I) is observed. The inset plot is the energy diagram for the three-level system. The initial population is in state 1. The lower plot of (b) is a spectrum excited by a pulse sequence of three broadband chirped pulses (22 GHz bandwidth, 100 ns duration) with alternating chirp directions. The upper plot of (b) is a spectrum excited by a single broadband chirped pulse. The inset plot is the energy diagram for the five states involved in this spectrum. The initial population is in state 1. All of the frequency axes in this figure are prior to up-conversion.
in this spectrum, and these states are organized as shown in the inset plot in Figure 6, plot (b). This multi-pulse technique is an efficient method for rapid detection and organization of a complex network of transitions. However, in our current data analysis, extracting connections between all transitions is a tedious process, especially for a large-scale laser-millimeter-wave 2D spectrum (see Section 3.7). Some relevant information is encoded in the phase information and can be extracted directly with an appropriate algorithm, which is being developed.
3.7. An illustration of the high efficiency of laser-millimeter-wave survey spec-troscopy
A crucial feature of CPmmW spectroscopy is that a single broadband millimeter-wave pulse with a 22 GHz bandwidth polarizes all two-level systems within its bandwidth and can also drive a sequence of information-rich transitions that
provide critical information about the Rydberg energy level structure. How-ever, examination of millimeter-wave transitions out of a single laser-populated Rydberg state provides only a small portion of the potentially available in-formation. Analysis based on the periodic structure and n∗-scaling behavior of
Rydberg states is always the most efficient and straightforward method to assign the spectrum and extract both systematic and accidental inter-channel interac-tion informainterac-tion. Therefore, to obtain the necessary informainterac-tion, we desire to scan all of the millimeter-wave transitions that originate from a wide range of initial Rydberg states, spanning at least three successive n∗ to n∗+ 1 intervals (n∗, n∗+ 1, n∗+ 2) by scanning the excitation lasers. Figure 7 is a 2D plot that displays a survey of multiple laser-millimeter-wave double resonance spec-tra. The 2D plot consists of three hundred individual FID spectra, each with a different excitation laser wavelength. As discussed in Section 3.1, to achieve a good signal to noise ratio and moderately high spectroscopic resolution (150 kHz), we adjust the number density of molecules excited into each single Ryd-berg state to ∼1×105 cm−3. At a 10 Hz repetition rate, it takes 10 seconds to
record 22 GHz bandwidth of 150 kHz resolution spectra with >20:1 signal to noise ratio. Both the frequency and phase of each two-level FID time-domain signal contains important information. This information is acquired and aver-aged in real-time for every two level system within the entire chirp bandwidth. When the time-domain signal is Fourier transformed into the frequency-domain, ∼150,000 resolution elements with 150 kHz resolution are retrieved from a sin-gle FID spectrum. The entire collection (40 cm−1of laser bandwidth) of survey spectra, each containing ∼200 millimeter-wave transitions, requires ∼1 hour.
4. Conclusion and Prospects
We have described direct detection of Free Induction Decay signals from tran-sitions between molecular Rydberg states. The combination of CPmmW spec-troscopy with a buffer gas-cooled molecular beam ablation source enables this form of high-resolution (≥50 kHz), broadband (20 GHz bandwidth), electronic
Figure 7: Laser-laser-millimeter-wave triple resonance survey spectrum in BaF . Each spot represents a millimeter-wave transition with >20:1 S/N ratio. The size of the spot is pro-portional to the strength of the transition. For visualization purposes, we exaggerate the linewidths of both millimeter-wave and laser transitions, which are respectively 150 kHz and 0.05 cm−1, thus much smaller than shown in this figure. The dotted lines illustrate connec-tions between transiconnec-tions that belong to members of the same Rydberg series. Green arrows mark the direction of an upward or downward transition determined by applying the phase extraction method described in Section 3.3. Blue and Red dots distinguish “more CP” Ryd-berg states from “more CNP” RydRyd-berg states, as revealed by the Stark demolition diagnostic described in Section 3.4
spectroscopy. However, the new type of Rydberg-Rydberg spectra generated also demands new semi-automatic methods of assignment and interpretation. We report three important techniques, phase extraction, Stark demolition, and multi-pulse spectroscopy, which respectively allow us to determine the direc-tion of the transidirec-tion (up vs. down), distinguish between CP Rydberg states and CNP Rydberg states, and to map out energy-linked networks consisting of multiple Rydberg-Rydberg transitions. In addition, we are developing several additional methods: (1) Diagnostics based on combinations of polarizations of the two lasers and the millimeter-wave radiation. Due to the anisotropic spatial distribution of the Rydberg electron in a diatomic molecule, the polarization di-agnostic provides information about ∆J rotational assignments[47]. (2) Exten-sion to higher millimeter-wave frequency (260-295 GHz) for Rydberg-Rydberg transitions with n∗∼30. The normal pattern of regular n∗-scaling rules, such
as energy splittings[48], and selected examples of broken patterns of n∗-scaling
rules, due to stroboscopic resonances[28], provide additional static and dynami-cal information. The ultimate goal with a combination of the new tools based on FID-detected spectra and n∗-scaling is a rapid, complete, and global assignment of all Rydberg states in BaF.
Beyond spectroscopy, our ability to generate a dense Rydberg gas via a buffer gas cooled molecular beam opens up possibilities for investigating strong radiation-mediated cooperative effects. The long-range interactions between atoms or molecules in Rydberg states, combined with the number-density of our beam source, enhance cooperative behavior significantly beyond what has been observed previously in supersonic beam sources. We have discussed in particu-lar the impact of superradiant decay on the observed linewidths and lineshapes of both atomic Ba and molecular BaF Rydberg-Rydberg transitions. Prelimi-nary experiments on Ba atoms have revealed several characteristic features of superradiance. Further detailed investigations are in progress.
Primarily enabled by direct detection of FID, the spectral velocity for Rydberg-Rydberg spectroscopy is enhanced by a factor of approximately one million beyond that of more traditional sequential excitation, indirect detection
tech-niques. We envision a surge of new experimental insights into the spectroscopy and dynamics of molecular Rydberg states. We are presently learning how to take advantage of the unique properties of our new spectrometer, initially by studying the spectra of the Ba atom and the BaF molecule. Our long term goal is, for a new molecule, to be able to capture the crucial information about the overall organization of the Rydberg series (ionization energy, approximate quantum defects of each CP Rydberg series, and the rotational constant and quadrupole moment of the ion-core) in the first few hours of data acquisition, to obtain few-kHz precision maps of the basic structure of a several n∗to n∗+1 regions in ∼2 days of spectra, and then to spend a few days to explore several explicitly predictable regions of Rydberg state space in which specific classes of resonances occur between the frequency of Kepler orbit motions of the Ryd-berg electron and internal vibration, rotation, or fine structure motions of the ion-core. The energy level manifold mapped by all such broadband and high resolution millimeter-wave spectra will be input to a Multichannel Quantum Defect Theory (MQDT) model[3, 6, 49] that describes “all states” and “all pro-cesses” and provides insight-rich, quantum number scaling relationships among all spectroscopically observable properties.
5. Acknowledgement
We thank Dr. G. Barratt Park for guidance and support regarding the CPmmW spectrometer and Dr. John Barry for providing his schematic diagram of a buffer gas cooled molecular beam system. This work was supported by the National Science Foundation (Grant No. CHE-1361865). D. Grimes was supported by the Department of Defense (DoD) through the National Defense Science & Engineering Graduate Fellowship (NDSEG) Program.
Appendix A. Laser ablation
In the buffer gas cooled molecular beam source, the atoms/molecules are introduced into the gas phase via laser ablation of a solid precursor. The laser
ablation process involves a complex sequence of energy transfer, gas dynamics, and relaxation pathways. Different materials often behave qualitatively differ-ently. Most metals are easily ablated or vaporized, because they readily absorb photons due to the absence of a band-gap. However, typical ionic salts have a large band-gap (∼10 eV) and must simultaneously absorb two or three photons to traverse this gap. This nonlinear multi-photon process requires a much higher laser intensity. Therefore, a more tightly focused laser beam with higher pulse energy is used to maximize ablation efficiency. We have performed systematic experiments to optimize ablation laser wavelength, pulse energy, focusing condi-tion, repetition rate, and target preparacondi-tion, in order to transfer the maximum number of target atoms/molecules into vacuum with minimal accompanying dust. The optimal conditions are listed in Table A.1.
The key step to improve the ablation efficiency is optimizing the preparation of the precursor, especially for BaF2. Our BaF2pellets are made by applying 650
MPa of pressure to anhydrous BaF2powder with 99.99% purity in a home-built
pressing die. After pressure treatment, the pellet with relatively low density (80% of BaF2 crystalline density) undergoes a 4 hour, 800◦C heat treatment
in a vacuum furnace. The final density (90% of the BaF2 crystalline density)
depends on the heating temperature and duration, which appear to be critical to maximize the ablation yield. Ablating pellets with inadequate heat treatment (lower density) results in increased dust formation. However, ablating pellets with excessive heat treatment (higher density) generates less useful BaF. The second key step of the optimization is the focusing condition of the ablation laser. An f = 50 cm best form lens (xxii in Figure 2, Thorlabs, LBF254-200-A) is used to tightly focus the laser to a diameter of less than 100 µm on the BaF2.
In addition, ablating a single spot repeatedly with a relatively high repetition rate (>5 Hz) also reduces ablation efficiency. To overcome this limitation, we use a Galvo mirror (xxiii in Figure 2) to translate the ablation laser beam back and forth to prevent two successive laser pulses from hitting the same location on the pellet. This implementation increases the repetition rate up to 20 Hz (our typical experiments operate at 10 Hz repetition rate).
Ba Metal BaF2 Salt
Wavelength 532 or 1064 nm 532 nm Pulse energy ∼3 mJ >20 mJ Focused diameter ∼1 mm <0.1 mm Maximum repetition rate >20 Hz <5 Hz Precursor preparation Cleaning the oxidation
layer
Hydraulic pressing and 800◦C, 4 hours heat treatment
Ablation yield ∼50% Ba, ∼50% dust ∼1% BaF, ∼1% Ba, >90% dust
Table A.1: Optimized parameters for laser ablation of Ba and BaF2.
Appendix B. Phase extraction
The excitation pulse with a single carrier frequency, f0, can be Fourier
trans-formed as in Eqs.(B.1) and (B.2). The resultant FID has the same resonant frequency, f0, and can be Fourier transformed as in Eq.(B.3). There is a tP
shift between the leading edges of the FT-windows of the excitation pulse and the FID, which corresponds to a 2πf0tP initial phase difference. The individual
phases of the excitation pulse and the FID can be extracted from the FFT and their phase difference, including the initial phase shift, 2πf0tP, can be calculated
using Eq.(B.4). If mod(∆φ/π) = 0, the transition is downward. If mod(∆φ/π) = 1, the transition is upward.
P ulse(t) = APe−i(2πf0t+φP) (B.1)
P ulse(ω) = APeiφPδ(ω − 2πf0) (B.2)
F ID(t − tP) = AFe−i(2πf0(t−tP)+φF)→ F ID(ω) = AFei(2πf0tP+φF)δ(ω − 2πf0)
∆φ = 2πf0tP+ φF− φP (B.4)
The precision of the phase measurements, φF or φP, where φF and φPare
the phases of the FID and polarizing pulses, respectively, is determined by the precision of the resonance frequency measurement, f0. Their uncertainties are
δφF /P = πδfF /P/∆fF /P, where ∆f is the transition linewidth and δf is the
accuracy of the center frequency f0. δf and ∆f are related by, δf = ∆f/SNR,
where SNR is the signal to noise ratio. In typical experiments, SNR>10 and the uncertainties of φF and φP are both less than 0.1π. These uncertainties cannot
be reduced by decreasing the linewidth, because both δf and ∆f decrease at the same rate. However, increasing the SNR linearly increases the accuracy of both φF and φP. In addition, the uncertainties of φF and φP always have
the same sign, which are therefore partially cancelled. The uncertainty of the initial phase shift, 2πf0tP, is only determined by δf , which can be decreased
by decreasing the linewidth or increasing the SNR. For a typical spectrum, δf can be as small as 10 kHz. If the excitation pulse duration is tP = 500 ns, the
uncertainty of 2πf0tP is only 0.01π. Therefore, for a spectrum with a resonant
single frequency excitation pulse, the uncertainty of the phase shift between the excitation pulse and FID is smaller than 0.1π. The use of the phase shift to determine the upward or downward transitions is reliable.
To extend this analysis to a chirped pulse excitation of multiple transitions, we decompose the FID into multiple single frequency components:
F ID(t) =X m AF me−i(2πfmt+φF m) (B.5) F ID(ω) =X m AF meiφF mδ(ωm− 2πfm) → AFeiφFδ(ω − 2πf0) (B.6)
We assume that all FID signals with different frequencies are completely iso-lated from each other. Then the analysis of the phase of each FID component
reduces to the single frequency case. Typical neighboring transitions in the Ry-dberg spectrum have >10 MHz spacing, therefore the resonant interaction is 10 MHz/100 kHz = 100 times stronger than the non-resonant interaction (100 kHz is the typical transition linewidth), which can be ignored. This argument is valid for most experiments, except for a system that exhibits strong collective effects, such as described in Section 3.2. However, a broadband excitation chirped pulse has a spectrum consisting of non-discrete frequency components. Whether the non-resonant interactions during the excitation can be ignored must be verified. Similar to the analysis of the FID, we Fourier transform the excitation pulse with a linear chirp as follows:
CP (t) = ACPe−i(2π(f0+ 1 2αt)t+φP) (B.7) CP (ω) = √ACP 2παe −iπ 4e−iφCPei(ω−2πf0) 2 4απ (B.8)
α is the linear chirp rate. The Fourier transform of the linearly chirped pulse indicates a regular phase shift φP, a constant phase shift π/4, and a quadratic
frequency dependent phase shift, which comes from non-resonant excitation and must be minimized. For a two-level system, the excitation amplitude of a non-resonant excitation is |a1|
2
= ω2
R/(ωR2+ ∆2). Therefore, if the detuning
fre-quency is 3 times larger than the Rabi frefre-quency (∆ > 3 ωR), the contribution
of non-resonant excitation is smaller than 10% and can be ignored. After substi-tuting ∆ = ωR− 2πf0= 3ωRinto the last phase term of Eq.(B.8), it is evident
that the phase shift from the quadratic term, δφ, is proportional to E2/α (ω R=
µE/~, where E is the amplitude of the excitation pulse), as shown in Eq.(B.9). However, E and α are not independent of each other, as shown in Eq.(B.10), where P is the degree of the macroscopic polarization, µ is the electric dipole transition moment, and N is the total number of atoms. To maintain a constant fractional polarization, E must be chosen to be proportional to α1/2. Therefore,
the quadratic phase shift is independent of the chirp rate, but depends on the Rabi flopping angle of the excitation, δφ ∝ P2. For the maximum Rabi flopping
angle (π/2), we substitute typical experimental parameters into Eqs.(B.9) and (B.10), and show that the quadratic phase shift is ∼π/2. To decrease this un-certainty below π/20, we must reduce the polarization from π/2 to π/6, which significantly reduces the non-resonant excitation.
δφ = 9ω 2 R 4απ ∝ ω2 R α ∝ E2 α (B.9) P ∝ µEN α1/2 → E ∝ α 1/2 (B.10)
In addition to reducing the Rabi flopping angle of the excitation, we can also apply two chirped pulses with opposite chirp directions. The quadratic phase shifts that result from non-resonant excitation above and below the resonance cancel symmetrically. A simulation shows this cancellation reduces the phase uncertainty caused by the quadratic term by a factor of 10.
[1] H. Lefebvre-Brion, R. W. Field, The spectra and Dynamics of Diatomic Molecules, Elsevier, 2004.
URL http://www.amazon.com/The-Spectra-Dynamics-Diatomic-Molecules/ dp/0124414567
[2] Z. J. Jakubek, R. W. Field, Rydberg series of BaF: peturbation-facilitated studies of core-non-penetrating states, Philosophical Transactions of the Royal Society A: Mathematical, Physical and Engineering Sciences 355 (1729) (1997) 1507–1526. doi:10.1098/rsta.1997.0073.
URL http://rsta.royalsocietypublishing.org/cgi/doi/10.1098/ rsta.1997.0073
[3] J. J. Kay, S. L. Coy, B. M. Wong, C. Jungen, R. W. Field, A quantum defect model for the s, p, d, and f Rydberg series of CaF, The Journal of Chemical Physics 134 (11) (2011) 114313–114321. doi:10.1063/1.3565967. URL http://dx.doi.org/10.1063/1.3565967
[4] J. J. Kay, S. L. Coy, V. S. Petrovi´c, B. M. Wong, R. W. Field, Separation of long-range and short-range interactions in Rydberg states of diatomic
molecules., The Journal of Chemical Physics 128 (19) (2008) 194301 1–20. doi:10.1063/1.2907858.
URL http://www.ncbi.nlm.nih.gov/pubmed/18500859
[5] J. Watson, Effects of a core electric dipole moment on Ryd-berg states, Molecular Physics 81 (2) (1994) 277–289. doi: 10.1080/00268979400100191.
URL http://www.informaworld.com/openurl?genre= article&doi=10.1080/00268979400100191&magic=crossref|
|D404A21C5BB053405B1A640AFFD44AE3
[6] M. Arif, C. Jungen, A. L. Roche, The Rydberg spectrum of CaF and BaF: Calculation by R-matrix and generalized quantum defect theory, The Journal of Chemical Physics 106 (10) (1997) 4102–4118. doi:10.1063/1. 473124.
URL http://link.aip.org/link/JCPSA6/v106/i10/p4102/s1&Agg=doi
[7] K. Prozument, A. Colombo, Y. Zhou, G. Park, V. Petrovi´c, S. Coy, R. W. Field, Chirped-Pulse Millimeter-Wave Spectroscopy of Rydberg-Rydberg Transitions, Physical Review Letters 107 (14) (2011) 1–4. doi:10.1103/ PhysRevLett.107.143001.
URL http://link.aps.org/doi/10.1103/PhysRevLett.107.143001
[8] A. P. Colombo, Y. Zhou, K. Prozument, S. L. Coy, R. W. Field, Chirped-pulse millimeter-wave spectroscopy: Spectrum, dynamics, and manipulation of RydbergRydberg transitions, The Journal of Chemical Physics 138 (1) (2013) 014301 1–9. doi:10.1063/1.4772762.
URL http://link.aip.org/link/JCPSA6/v138/i1/p014301/s1&Agg= doi
[9] F. Merkt, A. Osterwalder, Millimetre wave spectroscopy of high Rydberg states, International Reviews in Physical Chemistry 21 (3) (2002) 385–403. doi:10.1080/01442350210151641.
article&doi=10.1080/01442350210151641&magic=crossref| |D404A21C5BB053405B1A640AFFD44AE3
[10] T. Gentile, B. Hughey, D. Kleppner, T. Ducas, Microwave spectroscopy of calcium Rydberg states, Physical Review A 42 (1) (1990) 440–451. doi: 10.1103/PhysRevA.42.440.
URL http://link.aps.org/doi/10.1103/PhysRevA.42.440
[11] C. Jungen, I. Dabrowski, G. Herzberg, D. J. W. Kendall, High orbital angular momentum states in H2 and D2. II. The 6h-5g and 6g-5f
tran-sitions, The Journal of Chemical Physics 91 (7) (1989) 3926–3933. doi: 10.1063/1.456824.
URL http://link.aip.org/link/JCPSA6/v91/i7/p3926/s1&Agg=doi
[12] E. G. Kim, J. Nunkaew, T. F. Gallagher, Detection of barium 6sng-6snh, 6sni, and 6snk microwave transitions using selective excitation to autoionizing states, Physical Review A 89 (6) (2014) 062503. doi: 10.1103/PhysRevA.89.062503.
URL http://journals.aps.org/pra/abstract/10.1103/PhysRevA.89. 062503
[13] M. Hiyama, M. S. Child, Ab initio R -matrix / multi-channel quantum defect theory study of nitric oxide : II . Analysis of valence / Rydberg interactions, Journal of Physics B: Atomic and Molecular Physics 36 (2003) 4547–4559. doi:10.1088/0953-4075/36/22/014.
URL http://iopscience.iop.org/0953-4075/36/22/014
[14] S. N. Altunata, S. L. Coy, R. W. Field, Properties of nearly one-electron molecules. I. An iterative Green function approach to calculating the reac-tion matrix., The Journal of Chemical Physics 123 (8) (2005) 084318 1–12. doi:10.1063/1.2005017.
URL http://www.ncbi.nlm.nih.gov/pubmed/16164303
[15] S. F. Rice, H. Martin, R. W. Field, The electronic structure of the calcium monohalides. A ligand field approach, The Journal of Chemical Physics
82 (11) (1985) 5023–5034. doi:10.1063/1.448676. URL http://link.aip.org/link/?JCPSA6/82/5023/1
[16] Z. J. Jakubek, R. W. Field, Core-Penetrating Rydberg Series of BaF: New Electronic States in the n∗≈ 4 Region, Journal of Molecular Spectroscopy
179 (1996) 99–124. doi:http://dx.doi.org/10.1006/jmsp.1996.0189. URL http://www.sciencedirect.com/science/article/pii/ S0022285296901897
[17] Z. J. Jakubek, N. A. Harris, R. W. Field, J. A. Gardner, E. Murad, Ioniza-tion potentials of CaF and BaF, The Journal of Chemical Physics 100 (1) (1994) 622–627. doi:10.1063/1.466923.
URL http://link.aip.org/link/JCPSA6/v100/i1/p622/s1&Agg=doi
[18] Z. J. Jakubek, R. W. Field, Core-Penetrating Rydberg Series of BaF: Single-State and Two-State Fits of New Electronic States in the 4.4 ≤ n∗≤
14.3 Region., Journal of Molecular Spectroscopy 205 (2) (2001) 197–220. doi:10.1006/jmsp.2000.8264.
URL http://www.ncbi.nlm.nih.gov/pubmed/11162206
[19] Z. J. Jakubek, R. W. Field, Core-penetrating Rydberg series of BaF: s ∼ p ∼ d ∼ f supercomplexes, Phys. Rev. Lett. 72 (14) (1994) 2167–2170. doi:10.1103/PhysRevLett.72.2167.
URL http://link.aps.org/doi/10.1103/PhysRevLett.72.2167
[20] J. J. Kay, Rydberg Series of Calcium Monofluoride: Spectrum, Structure, and Dynamics, Ph.D. thesis, MIT (2007).
[21] G. G. Brown, B. C. Dian, K. O. Douglass, S. M. Geyer, S. T. Shipman, B. H. Pate, A broadband Fourier transform microwave spectrometer based on chirped pulse excitation., The Review of Scientific Instruments 79 (5) (2008) 053103 1–13. doi:10.1063/1.2919120.
[22] B. C. Dian, G. G. Brown, K. O. Douglass, B. H. Pate, Measuring picosec-ond isomerization kinetics via broadband microwave spectroscopy., Sci-ence (New York, N.Y.) 320 (5878) (2008) 924–8. doi:10.1126/sciSci-ence. 1155736.
URL http://www.ncbi.nlm.nih.gov/pubmed/18487191
[23] C. P´erez, M. T. Muckle, D. P. Zaleski, N. A. Seifert, B. Temelso, G. C. Shields, Z. Kisiel, B. H. Pate, Structures of cage, prism, and book isomers of water hexamer from broadband rotational spectroscopy., Science 336 (6083) (2012) 897–901. doi:10.1126/science.1220574.
URL http://www.ncbi.nlm.nih.gov/pubmed/22605772
[24] G. B. Park, A. H. Steeves, K. Kuyanov-Prozument, J. L. Neill, R. W. Field, Design and evaluation of a pulsed-jet chirped-pulse millimeter-wave spectrometer for the 70-102 GHz region., The Journal of Chemical Physics 135 (2) (2011) 024202 1–10. doi:10.1063/1.3597774.
URL http://www.ncbi.nlm.nih.gov/pubmed/21766933
[25] K. Prozument, R. G. Shaver, M. a. Ciuba, J. S. Muenter, G. B. Park, J. F. Stanton, H. Guo, B. M. Wong, D. S. Perry, R. W. Field, A new approach toward transition state spectroscopy, Faraday Discussions 163 (2013) 33– 57. doi:10.1039/c3fd20160k.
URL http://xlink.rsc.org/?DOI=c3fd20160k
[26] P. Labastie, M. C. Bordas, B. Tribollet, M. Broyer, Stoboscopic effect be-tween electronic and nuclear motion in highly excited molecular Rydberg states, Phys. Rev. Lett. 52 (1984) 1681–1684. doi:10.1103/PhysRevLett. 52.1681.
URL http://link.aps.org/doi/10.1103/PhysRevLett.52.1681
[27] R. S. Minns, J. R. R. Verlet, L. J. Watkins, H. H. Fielding, Observation and control of dissociating and autoionizing Rydberg electron wave packets in NO, The Journal of Chemical Physics 119 (12) (2003) 5842–5847. doi: