HAL Id: hal-01945326
https://hal.archives-ouvertes.fr/hal-01945326
Submitted on 5 Dec 2018
HAL is a multi-disciplinary open access
archive for the deposit and dissemination of sci-entific research documents, whether they are pub-lished or not. The documents may come from teaching and research institutions in France or abroad, or from public or private research centers.
L’archive ouverte pluridisciplinaire HAL, est destinée au dépôt et à la diffusion de documents scientifiques de niveau recherche, publiés ou non, émanant des établissements d’enseignement et de recherche français ou étrangers, des laboratoires publics ou privés.
New Zealand
Jérôme Le Coz, Antoine Patalano, Daniel Collins, Nicolas Federico Guillen,
Carlos Marcelo Garcia, Graeme M. Smart, Jochen Bind, Antoine Chiaverini,
Raphaël Le Boursicaud, Guillaume Dramais, et al.
To cite this version:
Jérôme Le Coz, Antoine Patalano, Daniel Collins, Nicolas Federico Guillen, Carlos Marcelo Gar-cia, et al.. Crowdsourced data for flood hydrology: feedback from recent citizen science projects in Argentina, France and New Zealand. Journal of Hydrology, Elsevier, 2016, 541, pp.766-777. �10.1016/j.jhydrol.2016.07.036�. �hal-01945326�
1
Crowdsourced data for flood hydrology: feedback from recent citizen
1
science projects in Argentina, France and New Zealand
2
Jérôme Le Coz1,3, Antoine Patalano2, Daniel Collins3, Nicolás Federico Guillén2, Carlos Marcelo García2, Graeme M. Smart3,
3
Jochen Bind3, Antoine Chiaverini3,1, Raphaël Le Boursicaud1, Guillaume Dramais1 and Isabelle Braud1
4
5
1
Irstea, UR HHLY, Hydrology-Hydraulics, 5 rue de la Doua BP 32108, 69616 Villeurbanne Cedex, France
6
2
Institute for Advanced Studies for Engineering and Technology (IDIT CONICET/UNC) and CETA – FCEFyN - Universidad
7
Nacional de Córdoba, Av. Velez Sarsfield 1611, Ciudad Universitaria, Córdoba, Argentina
8
3
NIWA, Applied Hydrology, Hydrodynamics, 10 Kyle Street, Riccarton, Christchurch, New Zealand
9
10
11
Abstract
12
New communication and digital image technologies have enabled the public to produce large quantities of
13
flood observations and share them through social media. In addition to flood incident reports, valuable
14
hydraulic data such as the extent and depths of inundated areas and flow rate estimates can be computed
15
using messages, photos and videos produced by citizens. Such crowdsourced data help improve the
16
understanding and modelling of flood hazard. Since little feedback on similar initiatives is available, we
17
introduce three recent citizen science projects which have been launched independently by research
18
organisations to quantitatively document flood flows in catchments and urban areas of Argentina, France, and
19
New Zealand. Key drivers for success appear to be: a clear and simple procedure, suitable tools for data
20
collecting and processing, an efficient communication plan, the support of local stakeholders, and the public
21
awareness of natural hazards.
22
23
Keywords: Crowdsourced data; citizen science; flood hydrology; flood mapping; LSPIV
24
2
1 Introduction
26
New communication and digital image technologies have enabled the public to produce and share large
27
quantities of flood observations. Such observations are often authored, time-stamped, georeferenced and
28
eventually shared through social media (Fohringer et al. 2015). Social media actually convey flood information
29
of diverse nature including flood hazard and damage reports, but also rational discussion (understanding),
30
public debate, appeal and remark to the government and local authorities, and emotional messages and
31
expression of feelings (Al-Saggaf and Simmons 2015).
32
As for other fields, initiatives for crowdsourcing flood data have emerged in the recent years, with a main
33
focus on rapid, near real-time mapping of the reports of flood damages and emergencies, generally to support
34
disaster management (Fohringer et al. 2015, Koswatte et al. 2015). Efficient tools for collecting, filtering,
35
reviewing and analysing massive amounts of data in social media have to be developed. Typically, Fohringer
36
et al. (2015) implemented the PostDistiller tool for the data mining of Twitter posts and applied it to map the
37
inundation extent and depths of the June 2013 flood in Dresden, Germany. As done for other types of
38
volunteered geographical information, interactive maps have also been developed for crowdsourcing flood
39
data and reports, for instance:
40
PetaJakartaa, an open source flood map of Jakarta, Indonesia, to share real-time flood information
41
using social media (Twitter);
42
The QLD Flood Crisis Map, an interactive map based on the open-source Ushahidib platform and
43
operated by Australian Broadcasting Corporation (ABC) to allow citizens report information during
44
the 2011 Queensland floods (Koswatte et al. 2015);
45
Flooding Pointsc, a collaborative flood map for São Paulo, Brazil, also based on the open-source
46
Ushahidi platform and the concept and prototype elaborated by Hirata et al. (2016, in press).
47
Another way to enhance flood data crowdsourcing is through dedicated mobile phone applications such as, for
48
instance:
49
Flood Patrol (Philippines), an Android mobile phone application developed for allowing people send
50
flood reports to NOAHd (Nationwide Operational Assessment of Hazards) for mapping;
51
SIGNALERTe (France), a smartphone application to report various situations of natural hazards
52
including floods;53
a https://www.petajakarta.org/banjir/en/ b https://www.ushahidi.com/ c http://g1.globo.com/sao-paulo/mapa-do-alagamento/platb
3
mPING (Meteorological Phenomena Identification Near the Ground, NOAA, USA), a free mobile
54
phone application used to collect public weather reports, including flooding across the USA as
55
contributions to the Flood Observations - Citizens As Scientists using Technology Project
56
(FLOCASTg) launched in 2013.
57
Most of these projects and the related research focussed on volunteered geographic information, usually
58
flood damages rather than quantitative hydraulic data. Despite of quality and credibility issues related to
59
crowdsourced data, their filtering and mapping allows for unprecedented spatio-temporal analyses of the flood
60
hazard and flood damages. Combining crowdsourced data and authoritative data, Schnebele et al. (2014)
61
were able to assess the spatio-temporal dynamics of the damages to the transportation infrastructure in New
62
York City flooded by Hurricane Sandy (29-30 October 2012). Using telephonic reports of flood incidents in
63
Rotterdam from 2004 to 2011, Gaitan et al. (2015) analysed the spatial distribution of flood damages and their
64
(lack of) relation with the subcatchments and flow paths derived from a DEM of the urban area.
65
Quantitative hydraulic data such as the extent and depths of inundated areas (Fohringer et al. 2015) or
66
flow rate estimates (Fujita et al. 2013, Le Boursicaud et al. 2016) can be computed using messages, photos
67
and videos from eyewitnesses and help improve the understanding and modelling of flood hazard. This way,
68
ordinary citizens or some enthusiastic flood chasers can contribute to hydrological science in the same way
69
the so-called storm chasers have historically contributed to meteorological science since the Tornado
70
Intercept Project (1975) of the National Severe Storm Laboratory (USA).
71
Projects encouraging the public to act as citizen scientists in flood hydrology still appear to be scarce.
72
The main well-established initiative of that kind is the CrowdHydrologyh project (Lowry and Fienen, 2013),
73
which encourage citizens to read and text the station number and the water level to the phone number listed
74
on the gauge of gauging stations in the USA. The water level is then added to a publicly available database.
75
To our best knowledge, besides the CrowdHydrology project there is no available feedback on such specific
76
projects, and more generally there is a lack of feedback and guidance on the failure and success factors of
77
data crowdsourcing and citizen science projects for flood hydrology.
78
We introduce three recent citizen science initiatives which have been launched independently by research
79
organisations to document floods in some catchments and urban areas of Argentina, France and New
80
Zealand. These projects were specifically designed to derive quantitative hydraulic data from digital photos
81
d http://noah.dost.gov.ph/ e http://www.signalert.eu/ f http://www.nssl.noaa.gov/projects/ping/ g http://flash.ou.edu/flocast/
4
and videos from the public for further retrospective analysis and modelling of the flood processes. While the
82
three projects differ in their objectives, methods and hydrological situations, they provide convergent feedback
83
on the potential and limitations of such initiatives for flood hydrology.
84
85
86
2 The three projects
87
2.1 Flood Chasers (Argentina)
88
2.1.1 Objectives
89
The mountainous rivers of the Córdoba province, Argentina, are characterised by the occurrence of flash
90
floods with very high volumes of fast flows during the rainy season (October to April). Due to the sudden
91
nature of flash floods, it is very unlikely to be able to survey several river sections of interest using instruments
92
and techniques suitable for recording the peak flow and its temporal evolution during the flood. Even when it is
93
possible to visit the study sites in time, flow velocities and floating river debris endanger both the instruments
94
and operators. Considering this issue, the researchers of the National University of Córdoba have developed
95
and implemented the Flood Chasers Project (“Cazadores de crecidas” in Spanish, Patalano et al., 2015) to
96
populate a database of videos and photos of flash floods in rivers of the province of Córdoba recorded and
97
shared by citizens using advanced digital technology (cell phones, digital cameras, tablets, etc.) on the basis
98
of the willingness of people filming these extreme hydrological events to share their footage in social
99
networks, websites, forums, etc.
100
101
Flood videos recorded by citizens are then processed to estimate river flow velocity and discharge using
102
image velocimetry techniques such as Large Scale Particle Image Velocimetry (LSPIV, Patalano et al., 2014).
103
The implementation of LSPIV using non-professional videos appears as a valuable alternative or
104
supplemental technique to traditional post-flood discharge estimation methods such as the slope-area
105
method, and proves great potential in the Córdoba province, Argentina (Patalano et al., 2015). During the last
106
rainy season (2014-2015), extreme hydrological events occurred in the Córdoba province and in some cases
107
the data obtained with such technique are the only available information to characterise the observed
108
hydrological events.109
h http://crowdhydrology.geology.buffalo.edu/
5
110
The first step of the Flood Chasers Project was to create a website with domain of the University, then
111
perform an intensive dissemination of the existence of this webpage in major newspapers and some television
112
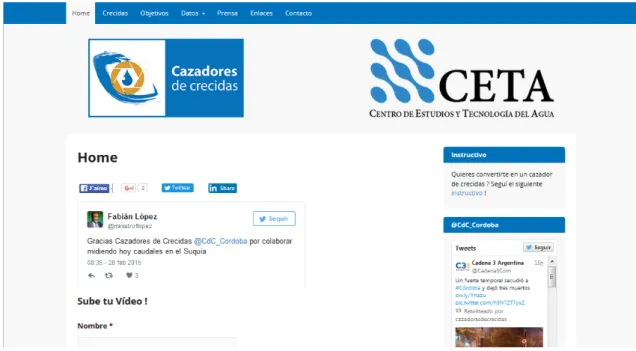
channels. On the Project website (Figure 1) people can upload their flood videos along with metadata
113
(recording date and time, location of the river section, etc.). In case the recording conditions are favourable,
114
the videos are manually screened, analysed and processed using the Large Scale Particle Image Velocimetry
115
technique (LSPIV, Fujita et al., 1998). This technique allows quantifying the surface velocity field of the rivers
116
remotely. The website provides guidelines for users without prior knowledge of hydraulics about the best way
117
to make contributions that are useful for quantifying flood discharges. Users who are interested in participating
118
in the Flood Chasers Project can send or upload their videos using different platforms (i.e. Dropbox, Mega and
119
WeTransfer) following basic tutorials generated by the scientists. There is also a webpage listing all the
120
recorded floods and including the flow results if the video has been suitable for analysis. In turn, there is a
121
YouTube channel called "Cazadores de Crecidas" in which the Project leaders upload their own collection of
122
videos, which are also published on the website.
123
124
125
Figure 1. Home page of the website of the Flood Chasers Projecti
126
The images are analysed following the methodology described by Patalano and García (2016) that uses
state-127
of-the-art tools (i.e. that apply classical PIV/PTV analysis) and brings them to Large Scale surface flow
128
characterisation, using the the first operational version of the RIVeR (Rectification of Image Velocity Results)
129
6
software. RIVeR has been developed in the Center for Water Research and Technology (CETA) at the
130
National University of Córdoba, Argentina, since 2013. It has been developed in order to provide an efficient
131
experimental Large Scale water surface characterisation (e.g. flow velocities, streamlines) and flow discharge
132
estimation in rivers and artificial channels (e.g. irrigation, treatment plant, etc.).
133
Image sequences of recorded videos are processed as follows: after converting the color images extracted
134
from the videos to grayscale images, they are processed using Matlab tool PIVlab (Thielicke and Stamhuis
135
2014) for calculating the displacement vector field from each pair of images. Each of these instantaneous
136
velocity fields is processed and the average displacement field in pixels per image pair is calculated. The
137
results are exported to the RIVeR (Rectification of Image Velocity Results) toolbox, which transform the
138
displacement data into velocity data in [m/s] by rectifying the results for perspective due to the oblique capture
139
of the videos with respect to the flow surface. The rectification is made using distances between fixed points
140
(ground reference points) observed in the images that were surveyed in situ after the flood event. Combining
141
the surface velocity profile in the area of interest with the bathymetry profile subsequently surveyed and a
142
relationship between depth-average and surface velocity, the flood discharge at the time of the video in a
143
defined river cross-section can be estimated.
144
The relationship of the Flood Chasers Project leaders with government authorities is more than optimal.
145
The minister of water, environment and energy of the Córdoba province is a professor at Universidad Nacional
146
de Córdoba (at leave) who is interested in the implementation of the technique. The results obtained in the
147
project have been used by the government to hydrologically evaluate some of the recorded events. Due to this
148
interest the project has received support from the government including logistics for conducting the required
149
surveys (topography survey, fieldwork, etc.).
150
151
152
i
7
2.1.3 Examples of results153
The methodology was applied to a video recorded by the witness of a flash flood that occurred in the
154
Ceballos River in the city of Río Ceballos (31°10′S; 64°19′W), Province of Córdoba, Argentina, after an
155
extreme rainfall event occurred on the morning of 15th February 2015. The return period of the rainfall event
156
was estimated to be more than 100 years with observed rainfall depth of about 250 mm during 12 hours. The
157
witness uploaded the video to the project website (Figure 1) with the sufficient metadata so the scientists
158
could reach the place where the video was recorded. Subsequently, the scientists went to the place and
159
surveyed the river cross-section bathymetry using a topographic total station. The camera movement during
160
the record due to the videographer holding the camera by hand without a tripod was preliminarily corrected.
161
Such movement created significant errors in the processing of the images (Figure 2a). Then, the surface
162
velocity profile was computed (Figure 2b) and ortho-rectified.
163
164
(a)
165
(b)
166
8
Figure 2. Successive frames (a) of a video recorded during the flood in the Ceballos River in Río Ceballos, Province of
167
Córdoba, Argentina, on 15 February 2015, and time-averaged surface displacement vector field (green vectors) in the
168
area of interest (b). Red crosses show discarded grid nodes where the flow free surface is not visible.
169
170
The computed surface velocity data in the area of interest were used for the calibration of the hydraulic
171
numerical model (HEC-RAS) implemented to simulate the flow conditions of the analysed event. The Digital
172
Terrain Model of the whole reach of interest required to implement the hydraulic model was provided by the
173
government of the Córdoba Province. Based on the surface velocity field and the water level data at the
174
measured section, the bed and banks roughness could be estimated iteratively and the flow discharge
175
computed. By the time that the video was recorded, the total discharge estimated using the calibrated model
176
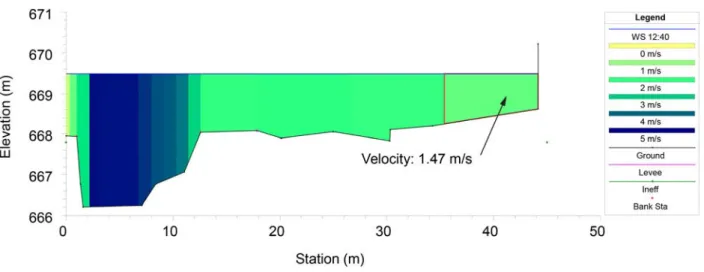
was 225 m3/s (Figure 3), which was not the peak discharge. The maximum water level (not observed in the
177
video) was measured in situ using a post-event survey of the high water marks. Using the calibrated model,
178
the peak discharge of the event was estimated to be 290 m3/s. The flooded area predicted using the
179
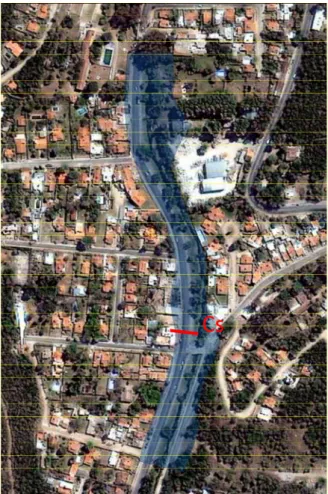
calibrated flood model of the Ceballos River can be seen in Figure 4.
180
181
Figure 3. Bathymetry of the cross-section of interest and depth-averaged velocity field estimated using a 1D
182
hydrodynamic model (HEC-RAS). The velocity (1.47 m/s) on the right side is the velocity obtained by LSPIV and used for
183
the model roughness calibration.
184
9
Cs
185
Figure 4. Flooded area estimated using the HEC-RAS flood model calibrated with the LSPIV velocity measurement and
186
the water level data in the section of interest (marked Cs). The peak discharge was estimated to be 290 m3/s.
187
The main problem faced in the Flood Chasers Project in Argentina is that many of the videos are not
188
suitable for processing because they do not meet the required conditions: most people record videos with
189
continuous movements of the camera and zooming, and in many cases it is not possible to detect the ground
190
reference points necessary for image ortho-rectification. For the next rainy season, the scientists are looking
191
for training groups of people who can be great partners. For example the civil defence workers (i.e.
192
firefighters) will be contacted for training since they are usually the first to arrive to the rivers when flash floods
193
occur. Advanced students (16 to 17 years old) from high schools that are located near rivers will also be
194
trained. The youth of that age usually use cell phones which now have the minimum resolution required to
195
implement the image velocimetry technique. A strong message of safety is also transmitted to all trained
196
people because it is very important to avoid any life in danger and be sure there is no risk in recording a video.
197
10
2.2 FloodScale (France)
199
2.2.1 Objectives and background
200
As part of the ANRj FloodScale project (France) on Mediterranean flash floods (Braud et al., 2014), a
201
similar action was independently launched throughout the Ardèche river catchment, South-East France. The
202
FloodScale project, a contribution to the HyMeXk project (Hydrological cycle in the Mediterranean Experiment,
203
Drobinski et al., 2014) was designed to make progress in the understanding and modelling of flash floods. The
204
observation strategy combined a four year multi-scale data collection in two meso-scale catchments in
South-205
East France with opportunistic measurements during the autumn season, when flash floods are more likely to
206
occur. To decrease the uncertainty of stage-discharge ratings and streamflow records, innovative methods for
207
gauging rivers during flash floods were implemented, including portable surface velocity radars (Welber et al.,
208
2016) and Large Scale Particle Image Velocimetry (LSPIV) at permanent video camera stations (Le Coz et al.,
209
2010) or using home movies from the public in post-flood surveys (Le Boursicaud et al., 2016).
210
Specific communication actions focussed on the determination of flood discharges within the Ardèche river
211
catchment (France) using home movies shared by observers and volunteers. Safety instructions and a
212
simplified field procedure (see flyer and poster in Figure 5) were shared through local media and were made
213
available in French and English on the project websitel. Legal aspects including a copyright transfer form have
214
been settled with the help of Irstea’s (National Research Institute of Science and Technology for Environment
215
and Agriculture) legal services. This way, simple flood observers or even some enthusiastic flood chasers
216
were encouraged to contribute to hydrologic sciences.
217
218
j
Agence Nationale pour la Recherche (National Agency for Research, France)
k
www.hymex.org
l
11
2.2.2 Implementation219
The processing of flood videos to extract surface flow velocities and discharges is based on the LSPIV
220
technique originally proposed by Fujita et al. (1998). The cross-correlation analysis of visible movements in
221
image pairs is similar to the conventional PIV technique used in hydraulic laboratory studies, but large-scale
222
outdoor applications require suitable image ortho-rectification and discharge computation steps. The
223
applicability of the LSPIV technique to flood home movies was investigated by Le Boursicaud et al. (2016), as
224
already done by Fujita et al. (2013) using the STIV (Space-Time Image Velocimetry) technique, and is also
225
the core of the Flood Chasers Project (Argentina). LSPIV steps are similar to the technique used in the Flood
226
Chasers project, except that ortho-rectification was applied to every image pair before velocity computation.
227
Flood videos recorded by witnesses usually do not match the requirements of the traditional LSPIV
228
technique. Using such videos raises several issues (Le Boursicaud et al., 2015, 2016) that must be solved for
229
the video to be successfully processed:
230
Fixed points that can be located in the images and in the real world are needed to calibrate the
231
orthorectification;
232
Both river banks should be visible in the image so that a complete cross-section is monitored;
233
The video should be recorded from a fixed point of view: a shake with limited amplitude was found to be
234
acceptable;
235
The precise location and timing of the video are necessary;
236
Authors of the videos must be contacted in order to get their personal agreement for the use of their
237
video materials and additional information.
238
Using flood home movies therefore requires some image pre-processing to be applied before the LSPIV
239
analysis, such as:
240
Correction of hand-held camera movement: image alignment;
241
Correction of distortion due to non rectilinear camera lenses;
242
Relative positioning of the free-surface.
243
The project followed a fully reproducible approach, based on free software only. LSPIV analysis was
244
conducted using Fudaa-LSPIV (Le Coz et al. 2014a), a free, user-friendly software available onlinem. Frames
245
m
12
were sampled from the video at an adequate time rate using ffmpegn, and image pre-processing was
246
conducted using Hugino. The complete procedure to collect and pre-process home movies for further LSPIV
247
analysis comes as a short methodological guide (Le Boursicaud et al., 2015).
248
Simple procedures for taking useful flood videos, highlighting safety warning (Figure 5) have been
249
disseminated to the public through various media including the project websitep and local media (newspapers,
250
radio). Communication campaign was well received by locals and municipalities, but jeopardised by local
251
issues (update of official flood risk mapping) and lack of coordination with and support from local authorities
252
(civil defence and prefecture). The main expressed concerns were that the call would encourage the public to
253
record videos from unsafe locations by the flooded rivers and that it would suggest that further research on
254
flood discharges was required before a flood risk map could be firmly established. After long discussions, the
255
communication campaign had to be postponed. Permissions for distributing flyers and putting posters in
256
places attended by the public were never obtained.
257
258
(a)259
n https://www.ffmpeg.org/ o http://hugin.sourceforge.net/ p https://floodscale.irstea.fr
13
(b)14
(c)261
Figure 5. Instructions provided to the public as a flyer (a, b) and a poster (c) for the information campaign of the
262
FloodScale Projectq263
264
265
q https://floodscale.irstea.fr/donnees-en/
15
266
Partly due to communication restrictions, few videos were received by the scientists, even after the series
267
of significant floods which occurred during the 2014 autumn. And none of those were actually usable because
268
they generally did not follow the recommendations. Some of them were not located in the study area. In turn,
269
some useful videos were harvested by scientists after each flood of interest, especially drone videos
270
(Figure 6) shared on YouTuber by a local companys specialising in UAV-borne image recording. The footage
271
was also shown by local and national TV channels. Valuable sequences with remarkable stability and clear
272
views of the Ardèche river channel upstream and downstream of the submersible Sampzon bridge
273
(44°25'46.4"N; 4°21'25.6"E) were selected (Figure 6).
274
Some fixed ground reference points could be identified, especially road signs and marks and elements of
275
the bridge structure. Their positions were topographically surveyed using a differential GPS and
cross-276
sectional bathymetry profiles were also measured using a hydro-acoustic profiler (ADCP). Then image
277
sequences were extracted, converted in grey scale levels, ortho-rectified, and instantaneous velocity fields
278
were computed. Time-averaged velocities were interpolated at each node of a transect used for discharge
279
computation. As often, the water level estimation appeared to be the main source of uncertainty (Table 1).
280
However, discharge estimates were found to be consistent with the flow rated at the upstream gauging station
281
when realistic time lags due to flood propagation are considered (between 30 and 60 minutes). Even with
282
uncertainties possibly as large as 15% or 20% such discharge estimates remain highly valuable to reduce the
283
uncertainties of rating curve extension and post-flood peak discharge assessment.
284
285
r https://www.youtube.com/watch?v=4lgws8pvFyg s http://www.ardechevideo.com/
16
(a) (b)
286
(c) (d)
287
Figure 6. Applying Fudaa-LSPIV software to a drone video of the Ardèche River at Sampzon Bridge, France, shared on
288
YouTube after 2014 floods: raw image sequence with ground reference points (a), same images converted to grey scales
289
and ortho-rectified (b), time-averaged surface velocity field (up to 4 m/s) and depth-averaged velocities interpolated at the
290
transect used for discharge computation (c), 3-D view of the transect (d)
291
Water Level
(metres above sea level)
LSPIV Discharge Q (m³/s) Q difference (%) Time lag: 30 min Q difference (%) Time lag: 60 min 94.5 1053 +16 +25 94.0 913 +3.6 +13 93.5 795 -11 +0.6
292
Table 1. Discharge results and comparison with records from upstream gauging station
17
The main perspectives are to reiterate communication campaigns with the twofold objective of mitigating
294
issues with the local governmental authorities, and increasing the quantities of usable videos spontaneously
295
provided by the public. This would certainly be reached with opportunistic calls to be launched through any
296
media just after a flood in the affected area. Thus the hydrologic watch could focus on a broader region such
297
as the French Mediterranean belt, or even at a larger scale as part of the HyMex project which develops
post-298
flash flood surveys throughout the catchments contributing to the Western Mediterranean Sea.
299
Engaging with the locals in preparation of future floods at research sites like the Ardèche catchment would
300
remain feasible through poster campaign at key observation points with safe conditions, especially near
301
gauging stations which provide the water level data that are critical for velocity and discharge computations.
302
Such sites could be pre-surveyed and permanent ground reference points could be marked. A best viewpoint
303
for videos could be marked and suggested on an adjacent poster or sign, for instance. The public could be
304
asked to read the staff gauge like in the CrowdHydrology project and provide the water level along with their
305
videos. Specialised partners such as technical staff from local municipalities, firemen, civil defence,
306
volunteering observers, storm/flood chasers, kayakers, UAV-borne image companies, etc. could be informed
307
and trained.
308
2.3 RiskScape (New Zealand)
309
2.2.1 Objectives
310
The New Zealand national institute NIWA has called citizens to contribute to flood mapping during recent
311
inundation events in the cities of Christchurch (43°31′S; 172°38′E) in 2014 and Dunedin (45°52′S; 170°30′E) in
312
2015. Residents were invited to send in their pictures of flooded areas, which were further used to build flood
313
hazard maps, as part of the RiskScapet project.
314
The 2010-2011 Canterbury earthquakes changed surface elevations across the region and the city of
315
Christchurch, in the South Island of New Zealand. This led to changes in flood risk, which was highlighted by
316
the 5th March 2014 flood as some suburbs of Christchurch experienced uncharacteristically severe inundation.
317
The flood not only highlighted the altered risk profile, but it also presented a rare opportunity to update flood
318
hazard knowledge of the city. With the widespread availability of camera phones and photos of inundation,
319
t
18
this research project sought to employ citizen science to supplement professional measurements of
320
inundation.
321
2.2.2 Implementation
322
Two days after the flood peak, members of the public were invited, via press releases to mainstream
323
media, a scientific blogu and outreach via social media (Facebook, Twitter), to send photos of maximum flood
324
levels to NIWA, indicating when and where each photo was taken. The photos were assessed by
325
professionals in terms of the ability to identify a clear water level around the time of the peak inundation.
326
Water surface levels were derived from the photos in conjunction with LiDAR scans of the city. In locations
327
where photos did not permit clear identification of water levels, field visits were carried out to make
328
supplemental measurements. The resulting point data were interpolated, along with additional survey data, to
329
derive a RiskScape flood hazard model to calculate flood risk and potential losses across the city. During
330
flooding in the city of Dunedin in 2015, the same request for photographs was made, but the project was
331
discontinued due to a lack of responses.
332
u
http://sciblogs.co.nz/waiology/2014/03/07/calling-for-christchurch-flood-photos/
333
Figure 7. Photos of the 5th March 2014 inundation in Christchurch, New Zealand, received from the public. (a) Slater
334
Street, Richmond. (b) Francis Avenue, Mairehau. (c) Buxton Terrace flow gauging site, Saint Martins. (d) Intersection of
335
Oxford Terrace and Barbadoes Street.
336
19
inundation during the 5th March 2014 flood in Christchurch, New Zealand.
339
2.2.3 Examples of results
340
Over 600 photos were received for the Christchurch study (e.g., Figures 7 and 8). Not all photos were
341
used or could be used, and for various reasons – the flood level may not have been discernible; the time or
342
location was unknown; or flood data may have been available from other photos or another source. Ultimately,
343
300 photos were used to get a fix on 289 water levels around the city. Combined with field surveys, the
344
resulting inundation map (Figure 9) indicates flooding along the Avon and Heathcote Rivers as well as various
345
residential suburbs throughout Christchurch, including the severely impacted Flockton Basin. High media and
346
public interest suggested that, in addition to providing useful data, the public engagement fostered a greater
347
appreciation of flood hydrology and its scientific study.
348
349
Figure 9. Interpolated flood depths based on citizen scientist photos and field surveys, for the 5th March 2014 flood in
350
Christchurch, New Zealand.
351
20
The resultant information has been invaluable in understanding the changed flood risk for
post-352
earthquake Christchurch. These data were used to validate hydrodynamic models and are being used to plan
353
mitigation, response and evacuation plans and to calculate human and economic costs of flooding. The
354
widespread use of camera phones provided data on flood levels and extent that could not have been obtained
355
by field surveys by hydrology technicians due to insufficient resources to cover the wide extent of relatively
356
short duration flooding.
357
3 Lessons learnt
358
3.1 Write a clear and simple procedure
359
Once the objectives and tools of the project have been defined, a clear and simple procedure has to be
360
written for the attention of the public. This is a key driver of the success of all citizen science projects. The
361
three projects have produced procedures in the form of simple instructions for recording the images and
362
sending the data in good agreement with their distinct objectives, either flood mapping or flood discharge
363
estimation. The type of images and metadata, the protocols to send them to the scientists and the safety and
364
copyright aspects were dealt with in a concise and precise manner. However, the simple but more demanding
365
requirements on flood videos for LSPIV applications in the Flood Chasers and FloodScale projects proved to
366
be much less followed than those on flood mark photos for the RiskScape project. The rate of photos usable
367
for flood mapping was much higher than the rate of videos usable for discharge estimation. For the capture of
368
valuable videos, a written procedure may not be sufficient and additional training should be provided as
369
tutorials and short videos, e.g. on collaborative websites like WikHydro in Francev. Instructions displayed in
370
situ may also be more efficient.
371
Crowdsourcing flood hydrology data makes the most of modern digital image technologies and social
372
media. It is advisable to target the kinds of equipment most commonly used by people in the area of interest,
373
smartphones typically but also drones (UAV) increasingly. Drone images show great potential for the LSPIV
374
technique, through excellent viewpoint stability and negligible perspective effects to correct since images are
375
often taken vertically from the sky. Then image ortho-rectification is not absolutely necessary, only estimation
376
of the size of the pixels, which requires much less ground reference points to be surveyed. Aerial photos taken
377
from drones could certainly be used in flood mapping projects as well, in conjunction with high-resolution
378
DEM.379
v http://wikhydro.developpement-durable.gouv.fr/
21
380
From a technical point of view, suitable tools are requested to collect, process the image materials, and
381
assess the quality of results, in order to reach the scientific objectives of the project. It is necessary to develop
382
platforms able to collect large quantities of data coming with contrasted formats and quality levels. Website
383
forms and uploads, as well as smart (apps) or basic (texts) phones, are efficient tools to collect crowdsourced
384
data, as long as the effort required from the user is kept minimal. Developing dedicated smartphone apps
385
could be very efficient for the data collection.
386
However, it sometimes remains more efficient for scientists to harvest adequate image materials from
387
sharing platforms and social media, and further locate and contact the authors for more information. As
388
exemplified by the three projects described in this paper, both bottom-up and top-down ways of collecting data
389
should be explored.
390
The processing of the collected data generally requires specific techniques and tools that are not
391
previously available off the shelf. Research groups need to be committed into the development of suitable
392
imagery techniques, hydrologic and hydrodynamic models, GIS applications and flood risk assessment
393
methods. It is important to carefully review the quality of the crowdsourced data, in particular through
post-394
event field investigation and cross-checking of the results with other sources of information, including
395
professional data. Locating precisely the photo/video viewpoints is often easy whereas their precise timing
396
may be not, especially when the authors cannot be contacted. The determination of the water level is a major
397
source of uncertainty in the discharge estimation.
398
The use of crowdsourced hydrologic data in models and scientific studies also requires suitable
399
techniques that are able to assimilate data coming with contrasted and possibly large uncertainties. This is
400
typically the case of the Bayesian techniques implemented in the FloodScale project for stage-discharge
401
rating curve development (Le Coz et al. 2014b), hydrologic modelling and flood frequency analysis (Renard et
402
al. 2010). The FloodChasers and RiskScape projects illustrate how such data can be successfully included in
403
1D/2D hydrodynamic models, post-flood surveys and flood risk and damage assessment.
404
3.3 Implement an efficient communication plan
405
Communication is key to efficiently mobilise flood observers, make them aware of flood-related dangers
406
(and discourage them from risking their lives), avoid conflicts with local authorities, and provide feedback on
407
the use of collected data. Simple and direct explanations are essential, even when it comes to science or legal
408
22
terms. Such initiatives are usually well received by the locals and the media. Communication efforts should be
409
directed at both the general public and specific community groups such as kayakers or storm/flood chasers. It
410
is important to communicate with and train groups of more advanced operators (firemen, civil defence,
411
hydrologic services, volunteers, etc.) so they can make better quality videos that fit the requirements of the
412
data processing, in optimal safety conditions.
413
The reported experience highlights the necessity of adapting the communication vectors to each project.
414
Communicating through radio and TV allows to reach a wide audience. Local newspapers and scientific blogs
415
can probably reach a more specific audience but are efficient to release punctual and periodic reminders of
416
the projects which are useful, especially at the beginning of the project or flood season, during or after flood
417
events, and when results and outputs are available. Distributing flyers and displaying posters and signs at key
418
observation points and at places attended by the public when there is a flood cannot be done extensively
419
throughout a large catchment, but it may dramatically increase the quantity of image materials at particularly
420
strategic sites.
421
Social media like Twitter and Facebook are essential as they allow to reach a wide audience and to do it
422
at any time, but you first have to communicate to make people `follow’ you. Typically, the Flood Chasers
423
Project received more videos when the minister of Water, Environment and Public Services of the Córdoba
424
Province, Argentina, `re-twitted’ the project on Twitter. Then, people forgot about it until an article was
425
published in a local newspaper. Being constantly active in the whole range of available media is important.
426
3.4 Get the support of local stakeholders
427
As consistently illustrated in the polarised French and Argentinian experiences, getting the support of local
428
authorities or not can significantly enhance or jeopardise your citizen science project. The local context and
429
profiles of people in charge are of course important as given factors of the issue, but the communication
430
strategy should account for this issue from the beginning. In the specific context of the FloodScale project,
431
calling for images before rather than during or just after the flood appeared to be the main source of concerns
432
for the administration. Though arguably hypocritical, you will not be blamed for encouraging people to unsafe
433
behaviour if you call for existing images, as usually done by mass media. It also appears advantageous to
434
focus on a recently flood-affected area rather than spending communication efforts over a large region in
435
preparation of future floods. Still, the support of local stakeholders and authorities should be sought
436
actively. There is always a chance that they realise the potential of citizen science initiatives for the success
437
and acceptance of flood risk policies.
438
23
439
The call is much more successful when the public and the media are prepared and aware of natural
440
hazards, as was the case in Christchurch, New Zealand, after the earthquakes of 2010 and 2011. During this
441
time, both the public and media became more attuned to natural hazard science, and also became more
442
receptive to citizen science-based initiatives such as the earthquake felt reports on GeoNet websitew. This
443
was not the case for Dunedin, hence one potential reason for the failure to receive photographs, although
444
there are others (e.g., flooding was not as extensive and occurred during the end of the day).
445
Provided there is sufficient expert oversight during project design and data analysis, such citizen science
446
seems a viable means of improving our understanding of flood risk. In turn, the reported projects highlight the
447
value of citizen science initiatives as a means of both gathering data and engaging with the community. In
448
some cases, the value of the obtained data is much less than the impact and engagement of the citizen
449
community (Lowry and Fienen, 2013). Feedback to the public is absolutely essential, through any available
450
means: project website, online database, publication of results, follow-ups on scientific blogsxy and
451
communication through the media.
452
Social studies could also profit from such crowdsourced feedback from people on how they have been
453
affected by the flood and how they have reacted, as done through calls and interviews in social science
454
projects like in HyMexz project (Ruin et al. 2008). Not only eyewitnesses of the flood but broader communities,
455
which are not always visible in more formal reporting procedures, may use social media to express their
456
feelings and contribute to the public debate (Al-Saggaf and Simmons 2015).
457
4 Conclusions
458
The reported three projects are typical of emerging citizen science initiatives for crowdsourcing flood
459
hydrology data. These photo-based flood mapping (RiskScape, New Zealand) and video-based flow
460
estimation (Flood Chasers, Argentina, and FloodScale, France) projects were specifically designed to produce
461
georeferenced and time-stamped hydraulic quantities readily usable for flood hydrology studies and hydraulic
462
modelling. Compared to other similar projects, they involved similarly simple procedures for the public, but
463
more advanced data processing and reviewing by the scientists. An exciting perspective would be to combine
464
such ‘measurement-oriented’ and ‘citizen hydrologists’ approaches with the powerful tools developed in other
465
w http://www.geonet.org.nz/quakes x http://sciblogs.co.nz/waiology/2014/06/16/citizen-scientists-help-map-christchurch-flooding/ y http://sciblogs.co.nz/waiology/2014/09/04/full-citizen-science-flood-map-for-christchurch-march-2014/ z
24
projects for data mining the social media contents and conducting the spatial analysis of volunteered
466
geographic information.
467
The three projects illustrate the great potential of citizen science initiatives for improving flood risk
468
assessment in interaction with the local communities. Key drivers for success appear to be: a clear and simple
469
procedure, suitable tools for data collecting and processing, an efficient communication plan, the support of
470
local stakeholders and authorities, and the public awareness of natural hazards. Beyond the technical and
471
communication challenges, this is an efficient way to enhance the culture of flood risk and make people more
472
engaged collectively. We hope that this feedback may help such initiatives emerge and develop successful
473
strategies.
474
Acknowledgements
475
All the citizens who have provided images and data for the three projects are gratefully thanked, as well
476
as the field hydrologists who conducted the supplemental surveys. The Flood Chasers project acknowledges
477
the support of the Government of the Córdoba Province, Argentina, through the PROTRI project. The
478
FloodScale project was funded by the French National Agency for Research (ANR) under Contract No ANR
479
2011 BS56 027, which contributes to the HyMeX program. Catherine Ambroise-Rendu and Thierry Fournier
480
(Irstea) contributed to the FloodScale communication campaign. Collaboration between NIWA and Irstea was
481
enhanced by the PHC Dumont D'Urville project 34185SH (2015-2016) and the Irstea grant and NIWA support
482
for the one-year scientific visit of J. Le Coz at NIWA Christchurch (AWATERE Project).
483
References
484
Al-Saggaf Y., and Simmons P. (2015) Social media in Saudi Arabia: Exploring its use during two natural
485
disasters, Technological Forecasting & Social Change, 95, 3–15
486
Braud I., Ayral P.-A., Bouvier C., Branger F., Delrieu G., Le Coz J., Nord G., Vandervaere J.-P., Anquetin S.,
487
Adamovic M., Andrieu J., Batiot C., Boudevillain B., Brunet P., Carreau J., Confoland A., Didon-Lescot J.-F.,
488
Domergue J.-M., Douvinet J., Dramais G., Freydier R., Gérard S., Huza J., Leblois E., Le Bourgeois O., Le
489
Boursicaud R., Marchand P., Martin P., Nottale L., Patris N., Renard B., Seidel J.-L., Taupin J.-D., Vannier O.,
490
Vincendon B., Wijbrans A. (2014) Multi-scale hydrometeorological observation and modelling for flash flood
491
understanding, Hydrology and Earth System Sciences, 18(9), 3733-3761
492
25
Drobinski,P. , Ducrocq, V., Alpert, P., Anagnostou, E., Béranger, K., Borga, M., Braud, I., Chanzy, A.,
493
Davolio, S., Delrieu, G., Estournel, C., Filali Boubrahmi, N., Font, J., Grubisic, V., Gualdi, S., Homar, V.,
494
Ivancan-Picek, B., Kottmeier, C., Kotroni, V., Lagouvardos, K., Lionello, P., Llasat, M.C., Ludwig, W., Lutoff,
495
C., Mariotti, A., Richard, E, Romero, R., Rotunno, R., Roussot, O., Ruin, I., Somot, S., Taupier-Letage, I.,
496
Tintore, J., Uijlenhoet, R., Wernli, H., 2014. HyMeX, a 10-year multidisciplinary program on the Mediterranean
497
water cycle, Bulletin of the American Meteorological Society, 95(7), 1063-1082
498
Fohringer J., Dransch D., Kreibich H., and Schröter K. (2015) Social media as an information source for rapid
499
flood inundation mapping, Natural Hazards and Earth System Sciences, 15, 2725–2738
500
Fujita I., Muste M., Kruger A. (1998) Large-scale particle image velocimetry for flow analysis in hydraulic
501
engineering applications. Journal of Hydraulic Research, 36(3), 397–414
502
Fujita I., Kunita, Y., and Tsubaki R. (2013) Image analysis and reconstruction of the 2008 Toga River Flash
503
Flood in an urbanised area, Australian Journal of Water Resources, 16(2), 12
504
Gaitan S., ten Veldhuis M.-C., van de Giesen N. (2015) Spatial distribution of flood incidents along urban
505
overland flow-paths, Water Resources Management, 29, 3387–3399
506
Hirata E., Giannotti M.A., Larocca A.P.C., and Quintanilha J.A. (2016, in press) Flooding and inundation
507
collaborative mapping – use of the Crowdmap/Ushahidi platform in the city of Sao Paulo, Brazil, Journal of
508
Flood Risk Management (in press)
509
Koswatte S., McDougall K., and Liu X. (2015) SDI and crowdsourced spatial information management
510
automation for disaster management, Survey Review, 47 (344), 307-315
511
Le Boursicaud R., Le Coz J., and Dramais G. (2015) Guide méthodologique - Collecte et préparation de film
512
amateur en vue d’une exploitation par analyse d’image [Methodological Guide - Collection and pre-processing
513
of home movies for operations by image analysis, in French], Technical report, Irstea, 23 p.
514
Le Boursicaud R., Pénard L., Hauet A., Thollet T., and Le Coz J. (2016) Gauging extreme floods on YouTube:
515
Application of LSPIV to home movies for the post-event determination of stream discharges, Hydrological
516
Processes, 30, 90-105
517
26
Le Coz J., Hauet A., Pierrefeu G., Dramais G. and Camenen B. (2010) Performance of image-based
518
velocimetry (LSPIV) applied to flash-flood discharge measurements in Mediterranean rivers, Journal of
519
Hydrology, 394 (1-2), 42-52
520
Le Coz J., Jodeau, M., Hauet, A., Marchand, B. and Le Boursicaud, R. (2014a) Image-based velocity and
521
discharge measurements in field and laboratory river engineering studies using the free Fudaa-LSPIV
522
software. In RIVER FLOW 2014 conference, 1961–1967, Lausanne, Switzerland
523
Le Coz J., Renard B., Bonnifait L., Branger F. and Le Boursicaud, R. (2014b) Combining hydraulic knowledge
524
and uncertain gaugings in the estimation of hydrometric rating curves: a Bayesian approach, Journal of
525
Hydrology, 509, 573–587
526
Lowry C. S. and Fienen, M. N. (2013). CrowdHydrology: Crowdsourcing Hydrologic Data and Engaging
527
Citizen Scientists. Ground Water, 51, 151–156
528
Patalano A., García C.M, Guillén N., García C., Díaz E., Rodriguez A. and Ravelo A. (2014) Evaluación
529
experimental de la técnica de velocimetría por seguimiento de partículas a gran escala para la determinación
530
de caudales en ríos serranos [Experimental evaluation of large scale particle tracking velocimetry technique
531
for flow discharge measurements in mountains rivers, in Spanish], Aqua-LAC, 6(1), 17-24
532
Patalano A., Moreno L., García C.M. and Guillén N. F. (2015) Desarrollo e implementación del proyecto
533
“Cazadores de crecidas” en ríos de la provincia de Córdoba [Development and implementation of the
534
Cazadores de crecidas project in rivers of the Córdoba province, in Spanish], IV Simposio sobre métodos
535
experimentales en hidráulica, La Plata, Argentina, 2 p.
536
Patalano A., and García C.M. (2016) RIVeR - Towards affordable, practical and user-friendly toolbox for Large
537
Scale PIV and PTV techniques. IAHR RiverFlow Conference, St. Louis, USA.
538
Renard B., Kavetski D., Thyer M., Kuczera G. and Franks S.W. (2010) Understanding predictive uncertainty in
539
hydrologic modeling: The challenge of identifying input and structural errors, Water Resources Research, 46.
540
Ruin I., Creutin J.D., Anquetin S. and Lutoff, C. (2008) Human exposure to flash-floods-relation between flood
541
parameters and human vulnerability during a storm of September 2002 in Southern France, Journal of
542
Hydrology, 361, 199-213.
543
27
Schnebele E., Cervone G., and Waters N. (2014) Road assessment after flood events using non-authoritative
544
data, Natural Hazards and Earth System Sciences, 14, 1007–1015.
545
Thielicke W., and Stamhuis E.J. (2014) PIVlab – Towards Userfriendly, Affordable and Accurate Digital
546
Particle Image Velocimetry in MATLAB, Journal of Open Research Software, 2.
547
Welber M., Le Coz J., Laronne, J.B., Zolezzi G., Zamler D., Dramais G., Hauet A. and Salvaro M. (2016) Field
548
assessment of non-contact stream gauging using portable surface velocity radars (SVR), Water Resources
549
Research, 52 (2), 1108-1126.