HAL Id: hal-00909650
https://hal.archives-ouvertes.fr/hal-00909650
Submitted on 26 Nov 2013
HAL is a multi-disciplinary open access
archive for the deposit and dissemination of
sci-entific research documents, whether they are
pub-lished or not. The documents may come from
teaching and research institutions in France or
abroad, or from public or private research centers.
L’archive ouverte pluridisciplinaire HAL, est
destinée au dépôt et à la diffusion de documents
scientifiques de niveau recherche, publiés ou non,
émanant des établissements d’enseignement et de
recherche français ou étrangers, des laboratoires
publics ou privés.
Imaging dielectric relaxation in nanostructured polymers
by frequency modulation electrostatic force microscopy
Clément Riedel, R. Sweeney, N. E. Israeloff, Richard Arinero, Gustavo Ariel
Schwartz, Angel Alegría, Philippe Tordjeman, Juan Colmenero
To cite this version:
Clément Riedel, R. Sweeney, N. E. Israeloff, Richard Arinero, Gustavo Ariel Schwartz, et al..
Imag-ing dielectric relaxation in nanostructured polymers by frequency modulation electrostatic force
mi-croscopy. Applied Physics Letters, American Institute of Physics, 2010, vol. 96, �10.1063/1.3431288�.
�hal-00909650�
O
pen
A
rchive
T
OULOUSE
A
rchive
O
uverte (
OATAO
)
OATAO is an open access repository that collects the work of Toulouse researchers and
makes it freely available over the web where possible.
This is an author-deposited version published in :
http://oatao.univ-toulouse.fr/
Eprints ID : 10270
To link to this article : doi:10.1063/1.3431288
URL :
http://dx.doi.org/10.1063/1.3431288
To cite this version : Riedel, Clément and Sweeney, R. and Israeloff,
N. E. and Arinero, Richard and Schwartz, Gustavo Ariel and Alegría,
Angel and Tordjeman, Philippe and Colmenero, Juan Imaging
dielectric relaxation in nanostructured polymers by frequency
modulation electrostatic force microscopy. (2010) Applied Physics
Letters, vol. 96 (n° 21). ISSN 0003-6951
Any correspondance concerning this service should be sent to the repository
administrator:
[email protected]
Imaging dielectric relaxation in nanostructured polymers by frequency
modulation electrostatic force microscopy
C. Riedel,1,2,a兲 R. Sweeney,3N. E. Israeloff,3R. Arinero,1G. A. Schwartz,4A. Alegria,2 Ph. Tordjeman,5and J. Colmenero2,4
1
Institut d’Electronique du Sud (IES), UMR CNRS 5214, Université Montpellier II, CC 082, Place E. Bataillon, 34095 Montpellier Cedex, France
2
Departamento de Física de Materiales, Facultad de Química, UPV/EHU, Apartado 1072,
20080 San Sebastián, Spain and Donostia International Physics Center, Paseo Manuel de Lardizabal 4, 20018 San Sebastián, Spain
3
Department of Physics, Northeastern University, Boston, Massachusetts 02115, USA
4
Centro de Física de Materiales CSIC-UPV/EHU, Edificio Korta, 20018 San Sebastián, Spain
5
Institut de Mécanique des Fluides (IMFT), Université de Toulouse–CNRS, 1 Allée du Professeur Camille Soula, 31400 Toulouse, France
We have developed a method for imaging the temperature-frequency dependence of the dynamics of nanostructured polymer films with spatial resolution. This method provides images with dielectric compositional contrast well decoupled from topography. Using frequency-modulation electrostatic-force-microscopy, we probe the local frequency-dependent 共0.1– 100 Hz兲 dielectric response through measurement of the amplitude and phase of the force gradient in response to an oscillating applied electric field. When the phase is imaged at fixed frequency, it reveals the spatial variation in dielectric losses, i.e., the spatial variation in molecular/dipolar dynamics, with 40 nm lateral resolution. This is demonstrated by using as a model system; a phase separated polystyrene/polyvinyl-acetate 共PVAc兲 blend. We show that nanoscale dynamic domains of PVAc are clearly identifiable in phase images as those which light-up in a band of temperature, reflecting the variations in the molecular/dipolar dynamics approaching the glass transition temperature of PVAc.
关doi:10.1063/1.3431288兴
Broadband dielectric spectroscopy 共BDS兲 is a well es-tablished technique that enables measurement of molecular dynamics of bulk materials with permanent molecular di-poles. Recent advances have made it possible to probe the dynamics of thin polymer films with a thicknesses as low as 5 nm, enabling the study of interfaces.1,2However, BDS has poor spatial resolution and the interpretation of the results from nanostructured polymers is always model dependent.3 Concerning local dielectric characterization, on the one hand, various atomic force microscopy based methods have been developed to image the dc dielectric constant at nanoscale. Fumagalli et al.4 have developed the so-called “nanoscale capacitance microscopy,” where the microscope is equipped with a subattofarad low-frequency capacitance detector. The same group also proposed a method based on the detection of the dc electrostatic force to image the dielectric constant of a purple membrane patch.5By measur-ing the dc electrostatic force gradient, we have been able to obtain a quantitative value of in one point6 and a map of the dielectric constant of a nanostructured polymer film.7 On the other hand, in previous work we have shown that the frequency response of the real and imaginary parts of the dielectric constant 关ⴱ共兲 =
⬘
− i⬙
兴 can be investigatedusing frequency modulation electrostatic force microscopy 共FM-EFM兲.8,9Measurements made in one spatial point gives direct information about the local dynamics of the sample area probed by the tip sample interaction. In the following, we will detail how we have been able to combine imaging
and measurement of the frequency dependence of the dielec-tric response to map the dipolar/molecular dynamics of a nanostructured thin film of a phase separated polymer blend. In order to maximize contrast, we have chosen to work with polystyrene 共PS-关C8H8兴n− Mw= 70 950 g / mol兲 and
poly共vinyl-acetate兲 共PVAc-关C4H6O2兴n− Mw= 33 200 g / mol兲
for which the bulk dielectric response has been previously well characterized.10–12A solution containing 25% PVAc and 75% PS 共by mass兲 and having a total concentration of 1% polymer in toluene has been spin-coated over a conductive film 共Au兲 on a mica substrate. The samples are dried at 70 ° C for 1 h under ambient conditions and annealed at 35 ° C overnight in vacuum to remove any trace of solvent. The resulting polymer films consist of a 25 nm thick matrix with island-like features having an average diameter of about 300 nm and a maximum height of about 25 nm above the reference level of the matrix 共Fig. 1兲. In the investigated range of frequency 共0.1–100 Hz兲, we expect to detect the so-called dielectric alpha-relaxation of PVAc 共correlated with segmental motion12兲 slightly above its glass transition tem-perature; Tg⬃ 35 ° C. Therefore we have explored the
tem-perature range between 25 and 50 ° C in order to follow the evolution of this dynamic process. The Tg of PS being
⬃105 ° C, no measurable relaxation is expected in our range of temperature and frequency. These two polymers are im-miscible, even at the nanoscale and form phase separated domains.
Experiments were carried out by FM-EFM under ultrahigh vacuum 共UHV兲 with a variable temperature stage 共RHK UHV 350兲. The temperature was measured with a small thermocouple clamped to the sample surface.
a兲
Author to whom correspondence should be addressed. Electronic mail: [email protected].
Nanosensors ATEC EFM cantilevers with 4:1 aspect ratio and 25 nm tip radius, spring-constant k = 2 N / m, are used so that Vdcand Vac bias voltages can be applied to the tip. In
FM-EFM, the cantilever is oscillated at its resonance fre-quency, f0= 70 kHz, and the resonance frequency shift, ␦f,
due to tip-sample interaction forces, is detected with very high resolution using a Nanosurf Easy-PLL Phase-Locked-Loop detector. This parameter is used as a feedback for con-trolling the tip-sample distance z and allows us to obtain the topography as shown in Fig. 1. Additional signals are those measured as a result of the electrodynamic interaction be-tween the conducting tip and the polymer sample. As the force gradient dF/dz is proportional to the square of the volt-age, a sinusoidal voltage Vac= V0 sin共t兲 produces a 2
component. This component can be detected as a modulation in the ␦f signal using a lock-in amplifier. The obtained V2
signal is related to dF/dz by the following: V2= 共A / 4k兲
⫻共df/ dz兲f0, where A is the instrument gain. 8
As the force gradient is a function of the dielectric permittivity,6–9 any measurable dielectric losses in the material will be detected as a phase shift in the V2 signal.
Two different experiments were performed to study suc-cessively the thin polymer blend. The first is similar to that describe in Refs. 8 and 9 and consisted in recording the phase in one point at different frequencies and constant tem-peratures. During the acquisition of the dielectric spectrum, the feedback of the PLL detector 共typically␦f0= 15 Hz兲 was
turned off in order to avoid any coupling with the corre-sponding electrical frequency. We apply a Vac= V0 sin共t兲
voltage at different frequencies 共/2兲 varying from 0.1 to 120 Hz. The frequency range is limited at low frequencies only by the time of acquisition and at high frequencies by the bandwidth of the FM electronics. A preliminary step consists of measuring the reference phase of V2, ⌽ref, at 19 ° C
where both polymers are in the glassy state and have no measurable dielectric relaxation. The difference between this reference phase and the phase measured in the experiments, ⌬⌽ = ⌽ref− ⌽, is used to characterize the dielectric
dissipa-tion. During the relaxation, due to the loss of energy to align the molecular dipoles in the field, a peak is observed in ⌬⌽共兲. Using BDS experiments on bulk PVAc, the macro-scopic phase of the dielectric permittivity, invtan共
⬙
/⬘
兲,peaks at about 16° for frequencies of 0.1–100 Hz, similar to what was found for ⌬⌽共兲 of thick films 共1 m兲 of PVAc using the present FM-EFM technique.8 For thinner films of PVAc, we found that the peak in ⌬⌽共兲 is considerably re-duced, to ⬃3° for 50 nm films. This can be understood by recognizing that the force gradient is a complex function of the dielectric permittivity, film thickness, tip radius, and tip height that requires numerical modeling.7Whereas the mac-roscopic phase is proportional to fractional increase in per-mittivity, ⌬ / , upon warming through the glass transition, the ⌬⌽共兲 we measure here is proportional to the fractional increase in force gradient, ⌬共dF/ dz兲 / 共dF/ dz兲. This fraction is found in simulations to be reduced with reduced film thickness due to a relatively larger constant background dF/dz.
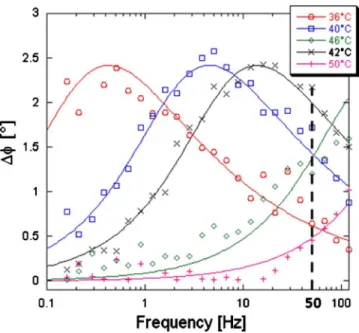
Figure 2 shows ⌬⌽共兲 over an island at different temperatures. The fitting lines were obtained using a Kohlrausch–Williams–Watts response function, exp共−t /兲,13,14
as a convenient way to describe the experi-mental result. Maximum value of ⌬⌽ and shape parameter 共= 0.42兲 were fixed by fitting the data measured at 40 ° C. Keeping these parameters constant and using only a free timescale parameter we obtained a rather satisfactory de-scription of the data, i.e., the shape of the peak does not depend on temperature within the uncertainties. The peak frequencies and shape of these peaks are nearly identical to those found in pure PVAc thick films. Measurements at the same temperatures have been performed over the matrix and the response 共not shown兲 is always flat 共⌬⌽ ⬍ 0.1°兲. There-fore, the frequency spectrum permits us to characterize lo-cally the dynamical properties of the sample, which shows that the matrix is composed of PS whereas islands are dy-namic domains of PVAc, in agreement with Ref. 7 which imaged static dielectric response.
The second experiment involved scanning the sample surface while a 50 Hz Vac is applied to the tip. In order to
keep a constant tip-sample distance, the feedback of the PLL
FIG. 1. 共Color online兲 Topography of the thin PS/PVAc polymer film. The thickness of the matrix is approximately 25 nm, whereas islands rise to 50 nm from the substrate.
FIG. 2. 共Color online兲 Phase shift measured as a function of the frequency over an island of PVAc. Statistical error is 0.25 for f ⬎ 1 Hz and 0.35 for f ⱕ 1 Hz. Lines are fits derived from a KWW model with amplitude and shape parameters fixed for all curves. The dashed line indicates the imaging frequency of Fig.3.
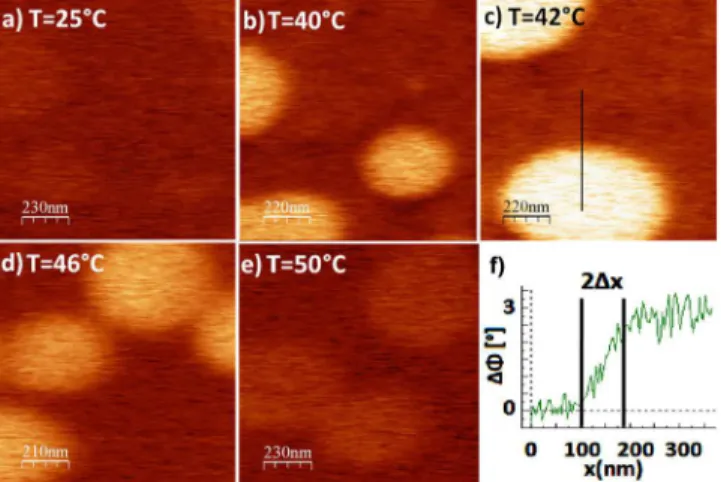
is used during the scan. Figure 3 presents images of ⌬⌽ recorded at different temperatures. All images have been off-set to the same phase-shift color scale using WSXM.15 The phase recorded on the flat matrix areas is always near zero, as expected for PS. On the other hand all values measured on the PVAc islands are, within experimental errors, the same as those measured using the frequency sweep in one single point at 50 Hz 共Fig. 2兲. At 25 ° C, the image is homoge-neous; there is no dielectric relaxation occurring in the is-lands of PVAc. This demonstrates that this method is only sensitive to dipolar relaxation and not topographical effects. When the temperature is increased to 36 ° C we begin to see strong contrast in the images as the high frequency wing of the dielectric loss peak starts to contribute at 50 Hz in the PVAc regions. The maximum contrast is found at 42 ° C. Further increasing the temperature reduces the contrast as the loss peak shifts to higher frequencies and only the lower frequency contributions are detected. As the shape of the relaxation does not depend significantly on temperature, the contrast observed is only attributed to the passage of dynam-ics associated with the alpha-relaxation through our measure-ment window. Figure 3共f兲 shows the profile of the phase recorded at 42 ° C across the interface between a PVAc is-land and the PS matrix 关as shown in Fig. 3共c兲兴. We can estimate an upper limit of the spatial resolution 共correspond-ing to half of the distance necessary to achieve the transition between the dielectric level of PVAc and PS兲 ⌬x around ⬃40 nm. This corresponds to the state-of-the-art resolution in EFM imaging when using standard probes, and it is also close to the theoretical resolution under our working conditions.16,17
In summary, we have developed a method that permits imaging the dynamics of nanostructured polymers with nan-ometer spatial resolution. This method of imaging dielectric losses is well decoupled from topography and can provide images with dielectric compositional contrast. For PS/PVAc polymer blends, strong phase separation was found. The glassy dynamics of the raised island-like domains was found
to be nearly identical to that of pure PVAc films of similar thickness, whereas between these domains no dielectric re-sponse was found, consistent with pure PS behavior. Similar results were found on thicker films of PS/PVAc, though weak PVAc-like response was found in the PS regions indicative of possible buried PVAc domains. With further numerical modeling it may be possible to use this technique to analyze the three-dimensional structure of such films. The method described here makes it possible to study dielectric relax-ation and molecular dynamics with nanometer scale spatial resolution in nanostructured polymers, nanocomposites, and other multicomponent soft materials, addressing questions of utmost importance such as the role of interfacial dynamics on the properties of such systems. Extending this method to ambient conditions would enable the study of soft hydrated materials such as proteins, and cell membranes, and investi-gate processes such as membrane potential formation, action potential propagation, or ion membrane transport.18Work in this direction is in progress.
This work was supported by the Donostia Internacional Physics Center 共DIPC兲, the Basque Country Government 共Ref. No. IT-436-07, Depto. Educación, Universidades e Investigación兲, the Spanish Ministry of Science and Innova-tion 共Grant No. MAT 2007-63681兲, European Community 共SOFTCOMP program兲, and the National Science Foundation 共Grant No. NSF DMR-0606090兲. C.R. and R.S. have equally contributed to the work.
1
A. Serghei, M. Tress, and F. Kremer,Macromolecules 39, 9385 共2006兲.
2
S. Napolitano, V. Lupascu, and M. Wübbenhorst, Macromolecules 41,
1061 共2008兲.
3
R. Lund, L. Willner, A. Alegría, J. Colmenero, and D. Richter, Macromol-ecules 41, 511 共2008兲.
4
L. Fumagalli, G. Ferrari, M. Sampietro, and G. Gomila, Nano Lett. 9,
1604 共2009兲.
5
G. Gramse, I. Casuso, J. Toset, L. Fumagalli, and G. Gomila, Nanotech-nology 20, 395702 共2009兲.
6
C. Riedel, R. Arinero, P. Tordjeman, M. Ramonda, G. Lévêque, G. A. Schwartz, D. G. de Oteya, A. Alegría, and J. Colmenero,J. Appl. Phys.
106, 024315 共2009兲.
7
C. Riedel, R. Arinero, P. Tordjeman, G. Lévêque, G. A. Schwartz, A. Alegría, and J. Colmenero,Phys. Rev. E 81, 010801共R兲 共2010兲.
8
P. S. Crider, M. R. Majewski, J. Zhang, H. Oukris, and N. E. Israeloff,
Appl. Phys. Lett. 91, 013102 共2007兲.
9
P. S. Crider, M. R. Majewski, J. Zhang, H. Oukris, and N. E. Israeloff,J. Chem. Phys. 128, 044908 共2008兲.
10
G. A. Schwartz, E. Tellechea, J. Colmenero, and A. Alegría,J. Non-Cryst. Solids 351, 2616 共2005兲.
11
G. A. Schwartz, J. Colmenero, and A. Alegría,J. Non-Cryst. Solids 353,
4298 共2007兲.
12
M. Tyagi, A. Alegría, and J. Colmenero,J. Chem. Phys. 122, 244909
共2005兲.
13
F. Kohlrausch, Pogg. Ann. Phys. 119, 352 共1863兲.
14
G. Williams and D. C. Watts,Trans. Faraday Soc. 66, 80 共1970兲.
15
I. Horcas, R. Fernandez, J. M. Rodriguez, J. Colchero, J. Gomez-Herrero, and A. M. Baro,Rev. Sci. Instrum. 78, 013705 共2007兲.
16
S. Gómez-Moñivas, L. S. Froufe, R. Carminati, J. J. Greffet, and J. J. Saenz,Nanotechnology 12, 496 共2001兲.
17
B. Bhushan and H. Fuchs, Applied Scanning Probe Methods II 共Springer, New York, 2003兲, p. 312.
18
J. Malmivuo and J. R. Plonsey, Biolectromagnetism: Principles and
Ap-plications of Bioelectric and Biomagnetic Field 共Oxford University Press, New York, 1995兲.
FIG. 3. 共Color online兲 Image of the phase shift recorded at 50 Hz on a PS/PVAc film for various temperatures. Brighter areas correspond to higher losses, indicative of segmental relaxation on ⬃3 ms time scales in PVAc. The profile recorded on the black line at 42 ° C is shown in 共f兲. The phase jump at the PS/PVAc boundary gives an estimated lateral resolution, ⌬x ⬃ 40 nm