HAL Id: hal-02571020
https://hal-cnrs.archives-ouvertes.fr/hal-02571020
Submitted on 12 May 2020
HAL is a multi-disciplinary open access
archive for the deposit and dissemination of
sci-entific research documents, whether they are
pub-lished or not. The documents may come from
teaching and research institutions in France or
abroad, or from public or private research centers.
L’archive ouverte pluridisciplinaire HAL, est
destinée au dépôt et à la diffusion de documents
scientifiques de niveau recherche, publiés ou non,
émanant des établissements d’enseignement et de
recherche français ou étrangers, des laboratoires
publics ou privés.
Continuous measurement and automatic processing of
in-situ wave impact pressure data
Dorian D'amico, Benoit Larroque, Franck Luthon, Pierre-Antoine
Poncet, Stéphane Abadie
To cite this version:
Dorian D'amico, Benoit Larroque, Franck Luthon, Pierre-Antoine Poncet, Stéphane Abadie.
Continuous measurement and automatic processing of in-situ wave impact pressure data. International
Coastal Symposium, 2020, Seville, Spain. �hal-02571020�
impact pressure data
Dorian d’Amico†, Benoit Larroque††, Franck Luthon†, Pierre-Antoine Poncet†† and Stéphane Abadie††
ABSTRACT
Although wave impact has been extensively studied in laboratories, field studies are comparatively rare. However, as real wave impacts are influenced by numerous environmental factors, complementing physical studies with in-situ data is necessary to better understand the processes at stake and provide reliable tools for coastal engineers. One of the main reasons for the lack of field data is the extreme conditions usually met on site. Nowadays, technology allows to set up stations able to resist those conditions and record data over long periods. In this context, the so-called Artha breakwater, in the French Basque coast, was equipped with an in-situ laboratory to record wave impact pressures. This station enables to collect long term wave impact pressure data therefore covering any weather conditions. In the present paper, the use of computer engineering based methods to process the large amount of wave impact data is described. It involves signal pre-processing, impact automatic segmentation, automatic computation of impact parameters, and artificial intelligence to classify the impacts. Impact automatic segmentation allows to have a big database of impacts available. This database has been used to make a first classification of the strongest impacts. The classification was performed thanks to the parameters automatically computed for each impact. As preliminary results for the classification, several wave impact pressure classes have been established. The approach is encouraging since the obtained results can be compared with the existing laboratory classification. However, the results can still be improved by computing other impact parameters and considering all impacts.
ADDITIONAL INDEX WORDS: Impact segmentation, Classification, Signal processing, Full scale impact.
INTRODUCTION
Wave impact has been studied for a long time. Hence, in 1938 De Rouville was the first to set up a full-scale experimentation to record field data measurement of wave pressures on a
breakwater. Bagnold (1939) extensively studied the
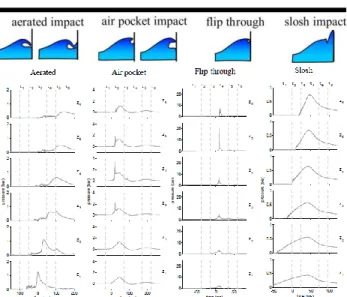
phenomenon in a model wave-tank and derived a theoretical model still used currently. These seminal works were followed by many studies on various topics, such as the mechanical study and the nature of the various wave impact types, the theoretical modelling of interactions between waves and structures, etc. Among these studies, Kaminski et al. (2009) and Hofland et al. (2010) carried out large scale experiments in a 2D flume with a vertical wall and obtained a classification of four impact types: slosh impact, flip through impact, air pocket impact and aerated impact (Figure 1 top). Flip-through impacts generate the highest pressures with short rise times, while slosh impacts generate small pressures with longer durations. Air pocket impacts entrap air between the wave and the wall. The presence of air is determined by the oscillations present in the signal, the higher the oscillation, the smaller the air pocket.
Comparatively to wave flume studies, field studies are scarce, only few studies have been conducted on real field.
Figure 1 Top: Wave impact types (reprint from Hofland et al. (2010)); Bottom: Signal shapes by class obtained in Kaminski et al. (2009).
†Universite de Pau et des Pays de l’Adour, E2S UPPA, LIUPPA, Anglet, France
_________________________________________________________________________________________________
Nevertheless, these real field studies are a necessary complement to physical studies as explained in Larroque et al. (2018). Indeed, laboratory experimental studies are often 2D while the natural process is fully 3D, which could lead to over or underestimation of the maximum pressure (Peregrine, 2003). The scale is different between the real phenomenon and laboratory experiments even if recent large scale experiments approach the real scale (Hofland, 2010). So scaling is necessary, but since seawater is difficult to use in lab experiments, a different fluid is used. The difference between the fluids involved makes difficult to establish a scaling rule (Bullock, 2001). Moreover, real breakwaters are often protected by a block armor unit which decrease the strength of the waves. Last, environmental variables such as wind magnitude and direction, water level and wave directions are generally not taken into account in laboratory studies.
Moreover, field studies were never conducted on long period which is necessary to record data with various weather conditions and various combinations of environmental parameters. For these reasons, a station has been set up on the Artha breakwater, at Saint-Jean-de-Luz in the South West of France. This station has already been described in previous papers (Larroque et al., 2018 and Luthon et al., 2018), but has evolved since then. Today the station contains 16 sensors (Keller© PAA25 1 kHz) arranged as a cross (Figure 2), to get a refined spatial resolution of the wave impacts. This station records 10 minutes per hour with a sampling frequency Fe = 10240 Hz. An embedded threshold, just higher than the atmospheric pressure, allows to save only significant signals. The station records monthly approximately 300 to 400 acquisitions of 10 minutes. Hence, there are lots of data to explore and doing it manually is unrelevant. Therefore, a computer science based approach has been adopted to process the data faster and to find correlations. This methodology and its preliminary results are described in this paper.
Figure 2 Embedded pressure sensors and arrangement of the 16 sensors
METHODS
Figure 3 summaries the processing approach.
Figure 3 Classification process adopted in the present study
Impact segmentation algorithm
To explore the data automatically, the key point is the segmentation of the impacts in the records. Usual peak detection algorithms, such as the common methods used in MatLab Signal Processing Toolkit, or such as the wavelet transform (Du, 2006), appear to fail when applied to wave impact signals recorded at the Artha breakwater. These signals can, indeed, be very
unconventional with, for instance, multiple peaks such as the
impact showed on Figure 8 (top). Moreover, those signals contain continuous variations which make it even harder to treat. To be able to efficiently detect the impacts in the signals, a specific algorithm based on empirical parameters has, therefore, been implemented. First, as explained in Luthon et al. (2018), the data must be pre-processed. This includes:
- Conversion from µA to bars as electrical sensor output
varies between 4 mA and 20 mA for a pressure which varies from 0 to 5 bars in the Keller sensors used,
- Removing outlier samples with a non-linear median filter,
- Removing frequencies higher than the normal frequency of
the sensors thanks to a linear low-pass Butterworth filter. The result of this pre-processing gives the final signal that will be used to compute all the parameters on the impacts. In parallel, the result signal of the median filter is duplicated and a Butterworth filter of order 1 with cut-off frequency of 10 Hz is applied. This linear low-pass filter is stronger and allows to really smooth the signal, removing all the variations that exist into the real signal, but it also decreases the signal. This signal is called the “hard filtered signal”. Figure 4 shows an impact signal filtered by the two different Butterworth filters. The “hard filtered signal” is only used to detect impacts. To do so, the derivative of the signal is used with a threshold T=0.08 bar/s to detect the start of an impact. An impact ends when the derivative signal crosses the zero N times without crossing the threshold T, positively or negatively. Based on the observations, N has been set to 150.
Figure 4 Filtered impact: standard Butterworth filter (top) versus hard Butterworth filter (bottom) on the same impact
Parameters computation
This algorithm allows to find the start and end dates of each impact in the signal. The objective is then to compute the impact characteristics based on several parameters. For that purpose, the start and end dates of each impact obtained on the “hard filtered signal” derivative are carried over to the “standard filtered signal”. Then, the following wave impact parameters are computed (see Figure 5):
- Peak pressure (bars): Highest value in the signal,
- Rise time (s): Time from 10% to 90% of the maximum,
- Drop time (s): Time from 90% to 10% of the maximum,
- Has depression: Indicates if there is a depression before the
impact (Boolean),
- Integral (bars): Integral of the pressure signal (10% before
to 10% after the max),
- Duration (s): Duration of the impact (10% before to 10%
after the max),
- Maximum and minimum values of the derivative (bar/s),
- High time (s): The high time corresponds to the duration
where the signal is higher than a given threshold as a percentage of the maximum. Here three high times are computed with: T1 = 50%, T2=30% and T3=80%
- Fourier transform of the signal: To determine the different
frequencies present in the impact signal.
Figure 5 Schematic showing the parameters automatically calculated for each recorded impact
Classification
The next step of the method is to try to classify the different impacts. Figure 1 (bottom) shows signal shapes by impact types obtained by Kaminski et al. (2009). The goal may be to relate each impact to this classification. Nevertheless, there are several issues to perform such a task. First, doing such a classification manually would be unrelevant owing to the enormous number of impacts. Second, for a given impact it is sometimes very difficult to determine which existing class fits the best. And finally, some of the impact signal shapes do not look like any existing class.
To solve these difficulties, an artificial intelligence approach was adopted in this work. In the present case, an unsupervised classification was performed as none of the impacts have been classified before (to be used as references for training a supervised artificial intelligence algorithm for instance). The goal is then to first use an unsupervised algorithm to classify the impacts already recorded, and later use this database of known classified impacts to automatically classify the new impacts on the Artha breakwater. The chosen unsupervised classification algorithm is a neural network method called Self Organizing Maps (SOM) (Kohonen, 1997). This method has already proved to be efficient in similar problems (Vellido, 2019). SOM reduces multidimensional feature vectors into a two-dimensional map. Each feature, in this case the impact parameters, is an input node. The number of input neurons is equal to the number of features. The output is an X by Y map represented by nodes, the number of output nodes corresponding to the number of classes. Each neuron in the map has a weight vector that matches the dimensionality of the input vector and each input neuron is connected to all output neurons. For each observation (impact), the algorithm looks for the best machine unit (BMU), which is the winning node. The BMU is the closest node of the map from the input vector of the observation. Then, the map adapts its weight vectors to fit as best as possible the dataset. This is done for each observation and repeated several times. At the end, the map is adapted to the dataset and each observation of the dataset is classified according to the map.
The classification has been made by using only the impacts detected on sensor number 0 (the lowest one), which is the most frequently impacted by waves. The best would have been to use all sensors to reach a reliable classification, but this appears to greatly complexify the task owing to the variety of the problems encountered. In this first classification, only the impacts superior or equal to 1 bar (relative value) have been retained since impacts under this threshold appeared too chaotic and distort the classification with the current parameters. So, the number of impacts used for the classification is so far relatively low (152) and the results obtained must be considered as preliminary results only.
RESULTS
A first result is the vision of the impacts this station allows to have. As an example, Figure 6 shows the same wave impact as recorded on the 16 sensors of the Artha station. Here the wave impact has the same shape on all sensors. The impact lasts longer on the lower sensors, especially on sensor 0. Thanks to
_________________________________________________________________________________________________
the covariance computation (Luthon et al., 2018), it is possible to know the delay of the impact between each sensor. For the 3234 records collected on a period of 9 months between 2018 and 2019, 126588 impacts have been detected, all sensors considered. 45310 have been detected on sensor 0, which represent the number of waves that hit the breakwater during the recordings.
Figure 6 Example of a wave impact record on the 16 sensors
Figure 7 shows a portion of the pressure signal in sensor 0 and how the algorithm segments the different impacts. This algorithm has an error rate of 3%. The errors are mainly on very low impacts and most of them are false positives. Since the main purpose of this work is to monitor big waves on breakwaters, having errors on low impacts is considered as a minor issue.
Figure 7 Automatic impact segmentation marked by red and orange dots
The strongest impact recorded, shown on Figure 8 (bottom), has a relative maximum at 4,47 bar (absolute maximum is 5,51). This is twice the maximum value obtained in Larroque et al. (2018) and already more than the value reported in Bullock et al. (2001) for the Alderney experiment (3.96 bars), which obviously shows the interest to conduct this experiment on the long term.
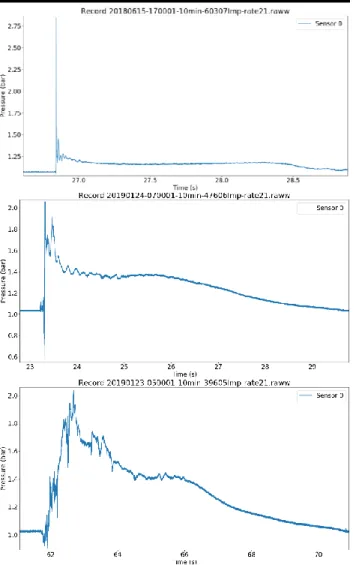
The impact parameters formerly presented have been computed for all impacts detected on all sensors. These parameters have then been used to establish a classification of the impacts. This preliminary classification allows to exhibit two main classes. A first class with a very short rise time, with a mean of 0.08, and another class with a slower rise time (mean =
0.45) and a long drop time (mean = 5). For the first class, two subclasses have been determined as shown in Figures 9 top and middle.
Figure 8 Top: Example of an impact exhibiting several successive peaks ; Bottom: Highest impact recorded.
A noticeable difference between them is the drop time. Indeed, in one case the drop time is very fast with a mean of 0.13 (Figure 9 top) while in the other case the drop time is slower with a mean of 3.5 (Figure 9 middle). According to the signal shapes obtained by Kaminski shown on Figure 1 bottom, the signal of Figure 9 top could be associated to a flip-through and the signal of Figure 9 middle to an air pocket impact. The second class, shown on Figure 9 bottom, maybe be classified as an aerated or a slosh.
This classification shows that, as established in laboratory studies, there are several impact classes and that the rise time and the drop time are decisive to define those classes. For now, this work does not allow to differentiate impacts according to the oscillations. Indeed, the impact of the Figure 9 top and the impact of the Figure 8 bottom are currently classified in the same cluster, which is obviouly not relevant.
DISCUSSION
One of the issue of this approach is the impact segmentation algorithm which makes errors for low impacts. Indeed, even if it is a small percentage, it could be a problem in case one wants to consider all impacts including very low impacts. A good approach could be to train a recurrent neural network (RNN) thanks to the database of impacts now available and check the potential improvement of the results. RNN is a class of artificial neural networks particularly suitable for time series analysis.
Additional impact parameters could possibly be computed to improve the classification, such as the pressure impulse and the impulse duration. The latters are not yet considered here because in its current state, the algorithm is not able to determine if there is a percussive impact or not. Finally, for this work, only the impacts on one sensor have been used. A good improvement could be to use all the sensors present on the Artha breakwater. Two issues are resulting from that: what approach can be used? And how to deal with waves that do not affect all sensors? This last point also raises the problem about the position of the sensors apparently a little too high. Nevertheless, one has to precise here that the installation location was mainly dictated by breakwater stakeholders invoking structural integrity. Also, a good improvement would be to consider all impacts no matter the maximum and how chaotic they are. To do so, other parameters could be needed.
Figure 9 Example of impacts, from top to bottom: short rise and drop times; short rise time and long drop time; long rise and drop times.
CONCLUSIONS
This paper describes a computer-based approach to analyze wave impact pressures on a breakwater. The impact segmentation algorithm in signals recorded on the Artha breakwater has been presented. Impact parameters have been computed and used to establish a first classification of the recorded impacts. This classification is not yet perfect, but the approach seems promising since, according to the signal shapes, the obtained classification is quite close to the existing classification established in laboratories. This classification could be used in the future to train an artificial neural network. This would allow, combined with the work presented in this paper, to automatically classify the future impacts.
ACKNOWLEDGMENTS
This project received funding from Excellence Initiative of University of Pau and Adour Countries – I-Site E2S, a French “Investissements d’Avenir” programme. We also thank the Basque Country Agglomeration Community for contributing to the funding, and the Departmental Council of Pyrénées Atlantiques for all the work on the Artha breakwater and for bringing us there for the maintenance of the station.
LITERATURE CITED
Bagnold, R.A., 1939. Interim Report on Wave-Pressure Research. Engineering Research, 12, 201-226.
Bullock, G.; Crawford, A.; Hewson, P.; Walkden, M., and Bird, P., 2001. The influence of air and scale on wave impact pressures. Coastal Engineering, 42 (4), 291–312.
De Rouville, M.A., Besson, P., and Petry, P., 1938. Etat actuel des études internationales sur les efforts dus aux lames. Annales des Ponts et Chaussées, 4-113.
Du, P.; Kibbe, W. A., and Lin, S. M., 2006. Improved peak detection in mass spectrum by incorporating continuous wavelet transform-based pattern matching. Bioinformatics, 22 (17), 2059-2065.
Hofland, B.; Kaminski, M., and Wolters, G., 2010. Large scale wave impacts on vertical wall. Coastal Engineering Proceedings, 1-15.
Kaminski, M. and Bogaert, H., 2009 Full Scale Sloshing Impact Tests. The Nineteenth International Offshore and Polar Engineering Conference, 125-134.
Kohonen, T., 1997. Exploration of very large databases by self-organizing maps. Proceedings of International Conference on Neural Networks, 1, PL1-PL6.
Larroque, B.; Arnould, P.; Luthon, F.; Poncet, P.A.; Rahali, A., and Abadie, S., 2018. In-situ measurements of wave impact pressure on composite breakwater: preliminary results. Journal of Coastal Research, Special Issue, 85, 1-5. Luthon, F.; d’Amico, D., and Larroque, B., 2018. Embedded
Sensors in Coastal Structures for On-Site Wave Impact Pressure Monitoring. IEEE Access, 6, 56135-56141. Peregrine, D., 2003. Water-wave impact on walls. Annual
review of fluid mechanics, 35 (1), 23–43.
Vellido, A., 2019. Advances in Self-Organizing Maps, Learning Vector Quantization, Clustering and Data Visualization. Barcelona, Spain: Springer, 342p.