Publisher’s version / Version de l'éditeur:
Journal of the Illuminating Engineering Society, 15, 2, pp. 41-57, 1986
READ THESE TERMS AND CONDITIONS CAREFULLY BEFORE USING THIS WEBSITE. https://nrc-publications.canada.ca/eng/copyright
Vous avez des questions? Nous pouvons vous aider. Pour communiquer directement avec un auteur, consultez la première page de la revue dans laquelle son article a été publié afin de trouver ses coordonnées. Si vous n’arrivez pas à les repérer, communiquez avec nous à [email protected].
Questions? Contact the NRC Publications Archive team at
[email protected]. If you wish to email the authors directly, please see the first page of the publication for their contact information.
NRC Publications Archive
Archives des publications du CNRC
This publication could be one of several versions: author’s original, accepted manuscript or the publisher’s version. / La version de cette publication peut être l’une des suivantes : la version prépublication de l’auteur, la version acceptée du manuscrit ou la version de l’éditeur.
Access and use of this website and the material on it are subject to the Terms and Conditions set forth at
Toward a model of visual performance: foundations and data
Rea, M. S.
https://publications-cnrc.canada.ca/fra/droits
L’accès à ce site Web et l’utilisation de son contenu sont assujettis aux conditions présentées dans le site LISEZ CES CONDITIONS ATTENTIVEMENT AVANT D’UTILISER CE SITE WEB.
NRC Publications Record / Notice d'Archives des publications de CNRC:
https://nrc-publications.canada.ca/eng/view/object/?id=025f66f7-06a3-4f3b-bde6-1786849b1aa7
https://publications-cnrc.canada.ca/fra/voir/objet/?id=025f66f7-06a3-4f3b-bde6-1786849b1aa7
THl
N21d
no.
1437
c.
2
B r n
- - ---National Research
Conseil national
9
Council Canada
de recherches Canada
Institute for
lnstitut de
Research in
recherche en
Construction
construction
Toward a Model of Visual Performance:
Foundations and Data
by
M.S. Rea
Reprinted from
Journal of the Illuminating Engineering Society
Summer 1986, p. 41 -57
(IRC Paper
No.
1437)
Price $5.00
NRCC
27170
NRC-
CISTII R C
LIBRARY
MAR
53
;?E:
B I B L ~ O T H ~ Q U E
I R C
C N R C-
ICISTABSTRACT
A
model of v i s u a l performance
i s
proposed t h a t p r e d i c t s t h e
s p e e d and a c c u r a c y w i t h which young a d u l t s c a n r e a d p r i n t e d
l e t t e r s
and numbers of d i f f e r e n t c o n t r a s t u n d e r i l l u m i n a n c e
l e v e l s commonly u s e d f o r i n t e r i o r l i g h t i n g .
It
i s
c o n s i s t e n t
w i t h a v a r i e t y of
p s y c h o p h y s i c a l and e l e c t r o p h y s i o l o g i c a l
s u p r a t h r e s h o l d c o n t r a s t r e s p o n s e d a t a .
The model g o e s beyond
t h e s e d a t a , however, by d e f i n i n g t h e changes i n t h e c o n t r a s t
r e s p o n s e f u n c t i o n s a t d i f f e r e n t a d a p t a t i o n l u m i n a n c e s .
Although t h e model s h o u l d b e u s e f u l t o i l l u m i n a t i n g e n g i n e e r s
i n t e r e s t e d i n p r e d i c t i n g v i s u a l performance,
i t
s h o u l d be
expanded t o c o v e r a l a r g e r r a n g e of v i s u a l s t i m u l i and s u b j e c t s
of d i f f e r e n t ages.
It
s h o u l d a l s o be more t h o r o u g h l y v e r i f i e d
by o t h e r t e c h n i q u e s .
A
companion p a p e r d e s c r i b e s some of t h e
i m p o r t a n t i s s u e s i n e x t e n d i n g and v a l i d a t i n g t h e model.
L ' a u t e u r p r o p o s e un modsle d e performance v i s u e l l e q u i i n d i q u e
l a v i t e s s e
e t l a
p r g c i s i o n a v e c l e s q u e l l e s d e j e u n e s a d u l t e s
p e u v e n t l i r e d e s
l e t t r e s
ou nombres imprim&
de c o n t r a s t e
d i f f g r e n t
3
d e s n i v e a u x d ' e c l a i r e m e n t u t i l i s e s couramment pour
1
' e ' c l a i r a g e
j-"'
-'
- - = 111- L I_-
_ ____
*e
d e t o u t e une
gamme d e dr
: o l o g i q u e s de
r e a c t i o n
st
d g p a s s e c e s
donnges e n
l d u i s e n t d a n s
l e s
f o n c t i
d i f f g r e n t e s
luminances
- --
e
u t i l e aux
-i n g g n i e u r r
-
performance
v i s u e l l e
I~ ' i l
e n g l o b e
u n p l u s
v
i u j e t s d ' s g e
d i f f g r e n t ,
a n i s r e p l u s
a p p r o f ond:
In
document
compl8meni
i m p o r t a n t e s
d ' e x t e n s i c
Toward a Model of Visual
Performance: Foundations and
Data
Mar&
S.
Rea
I.
Introductioa
Visual performance has been
a
central topic of
research and discussion in illuminating engineering for
many years (see Boyce, 1981; and Rea, 1982a, 1984 for
references). This interest is driven largely by practi-
tioners who want to know how lighting affects the per-
formance of workers in industrial and commercial en-
vironments. A practitioner might want to know, for ex-
ample, whether increased illumination levels can lead
to faster or more accurate performance in an assembly
task. Data and theory that could quantitatively relate
lighting and productivity for economic evaluations are,
perhaps, the most desirable research goals for lighting
practitioners (Clear and Berman, 1981).
Achieving these goals would not, however, be a trivial
accomplishment. Many factors associated with the
lighting, the task, and the person influence the quan-
titative relationships between the environment and a
person's productivity. Perhaps it is impossible to com-
pletely delineate the multiple interactions between
lighting, task, and human variables. It should be possi-
ble, however, to more narrowly constrict consideration
of the number of alternative relationships between
these various factors and then to establish plausible and
useful calculation procedures of suprathreshold visual
performance for lighting practitioners.
The purpose of this paper is to present such a
calculation procedure. The plausiblity, and therefore
utility, of this proposed model is based upon two prop-
ositions. First,
visual
performance must be extracted
from
task
performance. The latter is generally an
unknown combination of both visual and nonvisual fac-
tors that contribute to the behavioral response The con-
founding of visual and nonvisual contributions limits
the utility of a calculation procedure based on such
studies because one does not know how much of the
predicted behavior is based upon visual responses
under the control of the lighting practitioher and how
much is based upon nonvisual (psychological, intellec-
tual, motor, motivational, and emotional) responses
evoked by the multitude of other factors. Second, any
model of visual performance must be consistent with
the literature describing basic visual response. If visual
performance can be extracted from task performance,
then it should be possible to verify the extraction as
AUTHOR National Research Council of Canada, Ottawa, Ont.
an adequate representation of visual processing from
data available in the vision literature. Although com-
plete agreement may be difficult, well-established prin-
ciples in visual sciences limit the number of possible
descriptions of suprathreshold visual performance.
This paper describes in some detail, then, the foun-
dations of the proposed model in visual sciences as well
as the attempts to extract visual performance from task
performance at a simulated realistic task. It is not
argued that this visual performance model is complete
A variety of other parameters
(e.g.,
size, luminous unifor-
mity, age of the observer) that are important to the com-
plete specification of visual performance, as well as fac-
tors ultimately necessary for making economic evalua-
tions of lighting for task performance (manual dexteri-
ty, motivation, aesthetics, interactions with other sense
modalities), are not considered. Further, there are some
(explicit) assumptions in the model that require fur-
ther testing. Therefore, this paper and the model serve
as a milestone rather than the goal for lighting practi-
tioners. The paper hopefully establishes an appropriate
algorithm for a model of suprathreshold visual perfor-
mance, but it does not provide a complete economic
analysis relating lighting and productivity.
A
subse-
quent paper (Rea, in press) describes some of the re-
quirements for future studies attempting to describe
visual performance more accurately.
11.
Foundations
It is clear from a great deal of literature that supra-
threshold sensory responses are characterized by com-
pression. Small changes in stimulation about the adap-
tation level produce corresponding changes in sensa-
tion. Although the absolute magnitude of the sensation
increases with increasing stimulus intensity, higher
stimulation becomes progressively less effective in
eliciting incrementally higher sensation. Finally, a level
of stimulation will be reached where further increases
in stimulus magnitude produce no further increase in
sensation magnitude.
Sensory compression is exhibited in a wide variety
of invertebrate and vertebrate species, including
primates, in various sense modalities, and using a vari-
ety of psychophysical and electrophysiological measure-
ment techniques (see Lipetz, 1969; and more recently
Hood and Finkelstein, 1979, for references). This gen-
eral description of sensory compression also charac-
terizes many other biological "communication" phen-
omena, including neural reception of internal
metabolic changes (Koshland et
al.
1982). In short, com-
pression is widely accepted as a basic, general descrip-
tion of suprathreshold sensation including, for this
paper in particular, suprathreshold visual sensation, or
visual response, to luminous modulations.
Suprathreshold sensory compression has the follow-
ing form, first employed by Naka and Rushton (1966a,b)
in describing retinal responses in fish:
where:
R
=response
R,,
=maximum response
I
=stimulus intensity
n
=exponent
k
=stimulus intensity producing half of
maximum response
As already implied, this expression is quite robust
in describing visual responses to luminous modula-
tions. The exact values of
n, k,and
R,,,
in Equation 1
will vary with the experiment and depend upon such
factors as the chosen response (e.g., evoked potential or
magnitude estimation), the response criterion (e.g., a
particular peak or trough from the pattern of evoked
potentials), the site of recording (e.g., the retina or the
cortex), the chosen stimulus conditions (e.g, flashes or
gratings), any transformations of stimulus magnitudes
(e.g., logarithmic), and the species under investigation
(e.g.,
monkey, cat, or man).
The expression is believed to characterize a physio-
logically important mechanism in all receptors known
as "self-shunting" (Lipetz, 1969). A single photorecep-
tor (rod or cone) in the retina, for example, is compris-
ed of many photosensitive units connected electrically
in parallel. Each small photosensitive unit has what is
called an "ionic pump," that produces an electrical
potential between the photoreceptor and its environ-
ment. Thus, the photoreceptor has a steady-state, resting
potential maintained by these ionic pumps. When a
photon is captured by one of the photosensitive units
in the photoreceptor, the unit depolarizes briefly un-
til the ionic pump can restore the resting potential. This
depolarization is like an electrical shunt between the
photoreceptor and its environment that produces a
voltage drop in the whole photoreceptor. (This, in turn,
can produce a chain reaction in subsequent, higher-
order neurons that ultimately signal "light" to the
brain.) Photon catches by other photosensitive units in
the photoreceptor produce similar depolarizations, but
each subsequent unit depolarization, or shunting, has
relatively less influence on the total response (voltage)
of the photoreceptor until, finally, still more photon
catches produce no greater response from the photo-
receptor. As previously stated, Equation 1 conven-
iently describes such response compression in
photoreceptors.
Compression is exhibited in neurologically higher
centers as well as in retinal photoreceptors. One exam-
ple of visual response compression at the visual cor-
tex, adapted from Albrecht and Hamilton (1982), is
shown in
Figure 1.
Presented are the variations in elec-
trical potentials produced by single neurons in monkey
cortex in response to the contrast changes of a
luminous grating. The parameter values for Equation
1 describing the visual responses are given in the figure
caption. Adaptation luminance was 27 cd m-2 or
23
log trolands with the 3-mm diameter artificial pupil
placed before the monkey's eye.
This particular set of data was used to illustrate visual
response compression for a variety of reasons. First, the
species investigated,
Macaca fascicularis,
has a visual
system almost identical to man (Boynton and Whitten,
1970; Valeton and van Norren, 1983), and man is ob-
viously the species of interest for lighting practice. Sec-
ond, cortical events should be more indicative of the
psychophysical responses important to lighting prac-
tice than neurologically earlier activity. (For example,
retinal responses will not reflect processing from any
of the higher visual areas.) Third, the recorded visual
responses were to variations in luminous contrast, also
employed as stimuli in the present experiment. Fourth,
the technique for obtaining suprathreshold visual
responses was completely different from that employed
in the present experiment, so similarities between the
results of the two independent experiments would be
mutually reinforcing in the development of a supra-
threshold visual response model. Finally, no other elec-
trophysiological data with all of the above qualifications
were found.
From the previous discussion it should not be in-
ferred that only electrophysiological data can be de-
scribed by Equation 1. Psychophysical data have also
been characterized in this way. Hood and his coworkers
(Hood et
al.,
1978; Hood and Finkelstein, 1979; Hood
et
al.,
1979) have conducted studies specifically address-
ing the suitability of Equation
1
for describing
psychophysical responses. They have found that this ex-
pression can be used to describe subjective estimates
of flash brightnesses, by magnitude estimations, as well
as detection thresholds. Boynton and Whitten (1970)
have also used this expression in describing detection
threshold data, and like Hood and his coworkers, have
related psychophysical responses to those recorded elec-
trophysiologically. Rea (1983) has also used this formula-
tion to describe the data from a psychophysical study
using measures of speed and accuracy at the numerical
verification task employed in the present experiment.
Even in studies where this particular formulation has
not been tried, Equation 1 can be used to describe com-
pressive psychophysical responses. For example,
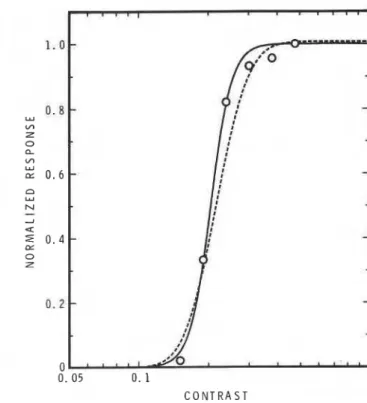
Blackwell and Blackwell (1980) have presented data
relating the Visibility Level (in this case the contrast)
of Landolt rings to the probability of correctly identi-
Summer 1986 JOURNAL of the Illuminating Engineering Societyfying the ring orientation. The dashed line in
Figure
2
is based on Blackwell and Blackwell's "log ogive"; the
solid line is based upon Equation
1.
Clearly both for-
mulations describe the data well.
Theoretical justification for a particular formulation
must rely on criteria other than an adequate curve fit
(Valeton, 1983). Both the log ogive and Equation
1
can
be fitted to many data exhibiting compression. More
work
(e.g.,
Valeton and van Norren, 1983; Valeton, 1983)
will have to be conducted to theoretically limit the
range of possible "curve fitting strategies." Nevertheless,
the robustness of Equation
1
has led to its current
preference in the visual sciences for modeling com-
pressive suprathreshold visual responses, and,
therefore, forms the basis of the visual performance
model presented here.
III.
The Numerical Verification Task
In a previous report (Rea, 1981) it was shown that per-
formance, defined in terms of time and errors, at a
reading-writing task was strongly affected by the dif-
ferent luminous contrasts between the white paper, the
luminance of which was held constant, and the (darker)
inks. Further, it was shown that a single function could
describe the relationship between performance and
contrast, no matter how that contrast was produced.
The purpose of the present experiment was to collect
more data at the same task using a wider range of
background luminances, and, with these data, for-
mulate a visual performance model based upon Equa-
tion
l.
tion was changed in this experiment by pivoting the
desk (and the subject) about a point at the center of
the horizontal task. Eight desk positions were employed
in the experiment (Table 1).
Subjects were comfortably positioned at a chin rest
while seated at the horizontal desk. The viewing angle,
from vertical, and distance to the center of the task were
42 degrees and
50
cm, respectively. From the subject's
viewing position, the middle digits of the reference and
response lists were separated by 7.1 degrees of visual
angle. Similarly, the middle digits were 13 and 19
minutes of visual angle wide and high, respectively.
Every reference and response sheet was a column of
twenty, five-digit numbers; each five-digit number in the
column was separated by a horizontal line.
A
small
calibration square was also printed at the top of each
column for photometric measurements. Two sets of 32
reference sheets, printed in black gloss or gray matte
ink, were used in this experiment. The photometric
qualities of these two sets under gonio and (simulated)
hemisphere conditions as well as under similar ex-
perimental conditions are described in the earlier
report (Rea, 1981). Contrast measurements of the ink
calibration squares on one example from each set ~f
reference sheets at the eight experimental desk posi-
tions are shown in Table
1.
Contrast (C,) is calculated
by the formula:
A.
Methods and procedures
where:
LT
is the luminance of the calibration square
Except for a few minor differences, the stimulus and
L~
is the luminance
of
the paper
adjacent
to
materials, the experimental testing room, and the pro-
the calibration square.
cedures were like those described in the previous
numerical verification experiment (Rea, 1981). Subjects
were seated at a desk and asked to compare, from top
to bottom, two printed number lists, a reference sheet
on the left and a response sheet on the right, for
discrepancies. The time to complete the comparisons
I .
and the number of errors, both omission and commis-
!
sion, were recorded after every trial.
I
Data were collected in a black testing room with il-
l
-
lumination provided to the work desk from a single
fluorescent luminaire having a light emitting aperture
of 95.5 x 955 cm.
A
sanded plexiglass diffuser was in
the luminaire throughout the experiment. Illumination
levels at the center of the task were (approximately)
50,
I
93,171 and
700
lx, depending upon the experimental
conditions. Illumination levels were adjusted slightly
during the experiment to hold task background
luminances (i.e., the luminances of the reference sheets)
constant at 12, 22, 41, and 169 cd m-2 from the posi-
tion of the subjects' eyes.
Lighting geometry, or direction of illumination, af-
fects task contrast (Rea, 1981). The direction of illumina-
Four groups of 32 high-contrast response lists were
employed in this experiment. Three groups were like
those used in the previous experiment. The mean fre-
quency of errors in the fourth (new) set was also
3.0.
The standard deviation of the list errors in the new set
was 1.41; the standard deviations for the other sets were
1.19, 152 and 1.48. Contrasts of one example of the
response sheets at the eight desk positions are also
given in Table 1.
Four male and four female subjects between the ages
of 19 and 24
(M
=22) years participated in the experi-
ment. These subjects were different from those
employed in the earlier experiment, but all had ex-
cellent, uncorrected vision as determined by a battery
of visual screening tests from a Keystone Ophthalamic
Telebinocular. The data from one female subject was
not included in the analysis because she dramatically
shifted her response strategy partway through the
experiment.
The experimental protocol was almost identical to
that employed in the earlier experiment. Subjects were
asked to compare the reference and response number
0. 1 C O N T R A S T
Firmre 1-A D contrast remonse function recorded electro~hwioloricallv L , 0 , from the visual cortex (adapted from Albrecht and Hamilton, 1982, Figure 5). Equation 10 (based on Equation 1) describes both the solid and the dashed lines. The dashed Line was genemted using a threshold term (Ct = 0.023 in Equation 10); the solid line did not include a threshold term (Ct = 0.0). The best fitting, by a least squares criterion, parameter estimates for the data using a threshold term (dashed line) are: n = 1.6, 6 , ~ = 0.050, and VP,, = 1.00. Com- palable values without a threshold term (solid line) are: n = 2.7, Rns
= 0.073, and W,, = 0.97. 0.05 0.1 0.2 0.5 1 0.1 0.2 0.5 1 C O N T R A S T 0 0. 05 0. 1 1 C O N T R A S T
Figure 2-Accuracy in identification of Landolt ring orientation (from Blackwell and Blackwell, 1980, Figure 24). Dashed line is described by the "log ogive" (Equation 3 in Blackwell and Blackwell, 1980) where the free parameters a, y, and p (the logarithm of R-) are 037, a l l & and 0.0, respectively. The solid line is based on Equation 1 (or Equa- tion 10, where C, = 0) where n = 9.61, k L B = 0.205, R,, (or VP,,)
= 1.00.
' T I C K S '
Figure 3-Performance plotted as a function of contrast (scaled Figure 4-The average time to compare the reference and response logarithmically) at the four background luminances used in the lists (S), in seconds (s), plotted as a function of the number of "ticks" numerical verification task. The reciprocal of the time to compare (both hits and false positives) that subjects marked on the response the reference and response lists (11s) is used as the performance lists.
measure. The solid lines are best fitting curves using Equation 10, which is based on Equation 1, and the four contrast threshold values in Table 3.
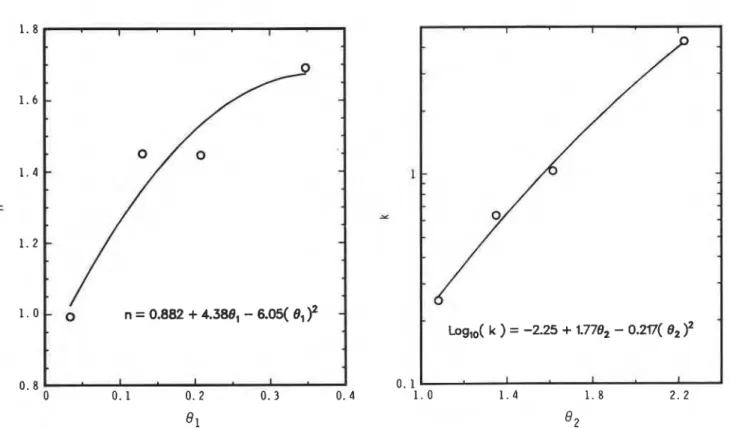
Fire 5-The four estimates of the parameter n, from Table 3, plot- Figure 6-The four estimates of the parameter A, from 'Dlble 3, plot- ted as a function of 81.
el
= loglo(loglo(LB)), where LB is the ted as a function of 8 2 . 8 2 = logl~(L~), where LB is the background background luminance defined in Equation 2. The solid line, defin- luminance defined in Equation 2. The solid line, defined by the equa- ed by the equation inset into the fwre, provides interpolated values tion inset into the figure, in-- d u e s oftheP
m
of the parameter n between 12 and 169 cd m-'. k between 12 and 169 cd m-'.1 . 0 1 . 4 1 . 8 2 . 2
92
Figure 7-The four estimates of the parameter
VP-,
from 'Dlble 3, Figure 8-Three-dimensional representation of the visual performance plotted as a function of 8 2 . 8 2 = loglO(LB), where Lg is the model. Relative visual performance (RVP), scaled linearly, is plotted background luminance defined in Equation 2. The solid line, detin- as a function of contrast (C, defined in Equations 2 and C2) and ed by the equation inset into the figure, provides interpolated values luminance(LB
defined in Equation 2), both scaled logarithmically. of the parameter VP,, between 12 and 169 cd m-2. The levels ofRVP
for selected values of C, between 01)8 and 1.0 and values of LB between 12 and 169 cd m" are represented by the lines constituting the surface The levels ofRVP
for values of C, between 0.0 and 1.0 and values of LB between 12 and 169 cd m-' may be calculated from the equations in A p p e n d i C.- -
-
...**.
...*...*..
I I I I-
> 0 . 7 - >-
w 0 . 4 --
>-
C -I W Di-
0 . 2-
0 . 5' " "
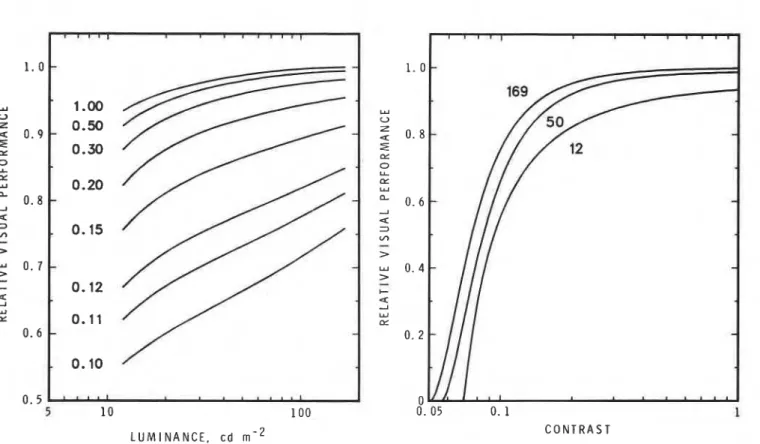
5 1 0 1 0 0 0. 05 0. 1 1 L U M I N A N C E , c d r n - 2 C O N T R A S TFigure %Constant contrast lines from the visual performance model. Figure 10-Constant luminance lines from the v i d performance The curves are labeled in units of contrast (C., in Equation 2). model. The curves are labekd in units of background iuninance
(Ls,
in Equation 2). I- vl a e C Z 0 U 5 1 0 1 0 0 1 2 3 4 5 6 7 L U M I N A N C E , c d rn-'
L O G
I N T E N S I T Y . I ( L o g t d )Figure 11-Constant performance lines from the visual performance Figure B1-Electrophysiologically recorded cone response functions model. The curves are labeled in units of RVP (Equation C10, in Ap- to luminous increments and decrements at two d i e r e n t adaptation
pen& C). These lines are comparable to threshold functions at warious luminances (Adapted from Valeton and van Norren, 1983, Figure 6). constant criteria. A single function, defined by Equation 1 (where n = 0.74, k = 3.2
log trolands, and R- = l a ) , can be shifted in semilogarithmic space (linear response by log luminance) to describe the cone response data at these and other background luminances.
lists as "quickly and accurately" as possible during prac-
tice and experimental trials. Discrepancies found by the
subjects were marked on the response list with a pen
held in the right hand. Total elapsed time (S), misses,
and false positives were obtained for each trial. Sub-
jects were not given feedback about their performance
during the experiment.
The experimental design was devised to hold con-
stant or minimize, by counterbalancing or randomiza-
tion, psychological effects like motivation and fatigue.
This experimental design can be briefly described as
follows. Every subject made the list comparisons under
all four illumination levels. To ensure that presentation
order was not confounded with illumination level, the
illumination levels were counterbalanced across sub-
jects. Eight desk orientations were presented in dif-
ferent orders to the subjects under each of the four il-
lumination levels. Some of the desk orientation presen-
tation orders were counterbalanced across illumination
level within subjects. The remainder were counter-
balanced across subjects. Four randomly distributed
replications of the black gloss and of the gray matte
reference lists were presented to the subjects at each
of the desk orientations (8 trialslorientation). In all,
each subject performed 256 experimental trials during
a one-day session lasting approximately six hours. One
subject was run per day. It should be noted that the ex-
clusion of the data from one subject prevented com-
plete counterbalancing across the subjects.
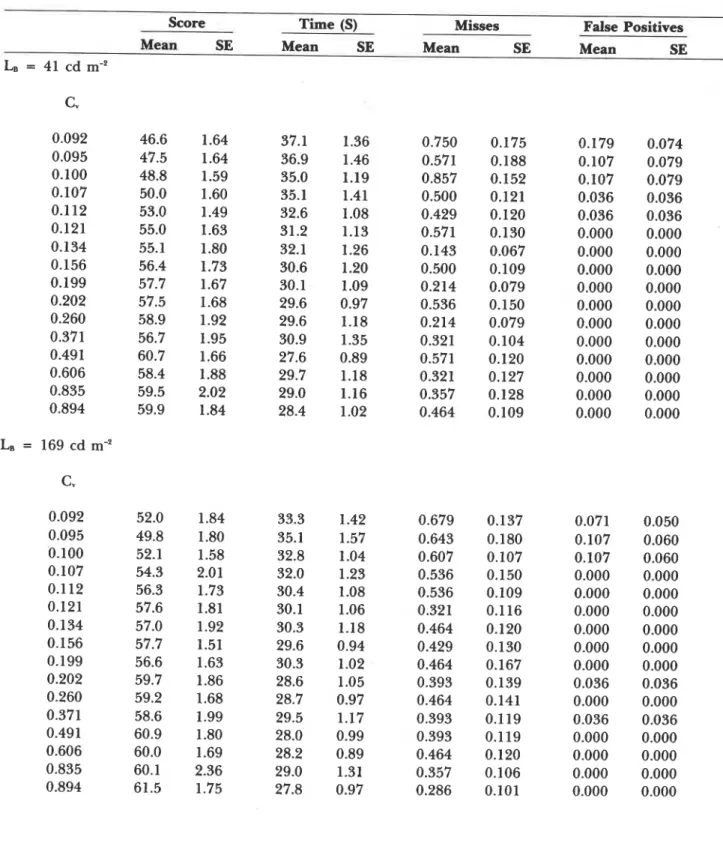
B. Results
The data (Appendix A) are quite similar to those
published earlier for the numerical verification task
(Rea, 1981,1983; Slater, Perry and Crisp, 1983) and for
other tasks (e.g., Poulton, 1969); the relationship between
each performance measure and contrast, at a given
adaptation level, can be described as suprathreshold
sensory compression (Section 11). At each background
luminance, performance improves rapidly above con-
trast threshold. As contrast further increases, perfor-
mance improves but at a decreasing rate until, finally,
still higher contrasts produce little, if any, change in the
level of performance. The relationships between the
reciprocal of the total time to compare the two number
lists (11s) at each reference sheet background luminance
(L,)
and contrast (C,)
(Table
Al) are shown in
Figure
3?
Best fitting curves, based upon Equation 1, were
drawn through the four data sets to help illustrate the
different trends and relationships.
The four sets of data in
Figure 3
show the same
general form of response compression. Further, each
set of data is similar in form to those from cortical
neurons in
Figure
1,
at least over the range of contrasts
employed in the present experiment (i.e., above C,
=0.1). While each set of data presented in
Figure
3
shows
the same general form of compression, it is also worth
noting two important differences between the curves
at the different luminance levels. First, for matched con-
trasts, performance tends to be higher at higher
luminances. Second, as contrast increases, performance
tends to saturate more quickly at the higher luminances.
Essentially, these two trends indicate that performance
improves with higher task luminances. Not only does
the absolute level of performance increase with higher
luminances, but performance is also higher over a
larger range of contrasts.
C. Refinements of the
l/S data
Evidence supports the argument that performance
in this experiment was largely determined by visual
parameters, and the effects of nonvisual factors were
minimized. The experimental design, the photometric
control of the stimuli, the similarity between time and
error response functions, and the similarity between
these data and those obtained in other vision ex-
periments (e.g., Albrecht and Hamilton, 1982), all in-
dicate that visual performance, relatively uncon-
taminated by nonvisual factors, was measured. This
evidence might suffice in an argument favoring
11s
as
the measure of visual performance at the numerical
verification task. However, at least two refinements to
the 11s data are desirable to improve these data to
characterize visual performance.
1.
Action time-Weston
(1935, 1945) argued that the
time taken for subjects to mark targets, the so called
"action time," in his Landolt ring search task should be
subtracted from the total search time to characterize
visual performance more accurately. The same argu-
ment can be made for transforming the time data ob-
tained in the present experiment. The average total
time taken to compare the two number lists can be plot-
ted as a function of the average number of "ticks" (both
hits and false positives) made by subjects in the experi-
ment. As can be seen in
Figure 4,
a simple linear func-
tion with a slope of 0.8 can be used to characterize the
relationship between these two variables?" Thus, the
average time per "tick" is about 0.8 s. It was then a sim-
ple matter of subtracting 0.8 s for each hit and false
positive in a trial (S,) from the total time taken by sub-
jects to compare the two number lists (S) in that trial.
This transformation of the time data in
Tmble
A1 was
used to estimate the so-called reading time (S,) in the
experiment. Thus,
2.
Time taken to read the response list-The reading time
taken to compare the number lists (S,) is the sum of
the time taken to read the reference list (Sre,) and the
*Appendix A discusses the reasons for limiting the discussion to 11s as the measure of performance.
**A series of analyses of variance showed that response time ("ticks") was not systematically related to (i.e., did not interact significantly with) any of the experimental variables (luminance, ink pigment den. sity, and desk orientation).
time taken to read the response list (S,,). For a given
adaptation luminance (L,) in this experiment, S,
should be approximately constant because the contrast
of the response lists was high and, with the compressive
response behavior obtained here and elsewhere (Sec-
tion 11), nearly constant. On the other hand, Sq is ex-
pected to vary and to be determined by the contrast
of the reference sheet on a particular trial (C,). When
the contrasts of the response and the reference lists are
the same, at a given adaptation level, it is reasonable
to assume that S,, is equal to S,+ Thus, S,, is a cons-
tant (y) equal to %ST
under these conditions. The
average response list contrast in Table 1
was equal to
0.7. From the four curves in Figure 3 it is possible to
estimate the value of 11s at the four luminance levels
for a reference sheet contrast of 0.7 (C07). Thus, a
measure of visual performance (VP) can be estimated
by taking into account S, and y, where:
Equation 6 defines the measure of visual perfor-
mance, VP, for this experiment. Namely,
VP
is the
reciprocal of the time taken to read each reference list
of a particular contrast (C,) at a particular adaptation
luminance (L,).
Table
2
presents the values of
v,
the
average values of VP.
D. Threshold contrast
Threshold contrasts are estimates of the transition
from imperceptible to perceptible contrast at different
background luminances, and, therefore, denote the
lower limits of contrast perception in a visual perfor-
mance model. Threshold contrasts have been common-
ly employed in psychophysical studies (e.g., Graham,
1965; Brindley, 1970) and are even evident in several
electrophysiological studies (e.g., Albrecht and
Hamilton, 1982; Tolhurst, Movshon and- Thompson,
1981). Unfortunately, it is difficult to make estimates
of threshold visibility with the procedures employed
in the numerical verification task. Subjects tended to
quit under difficult conditions so it was impossible to
obtain data at the critical, steep transition between
threshold contrasts and slightly perceptible contrasts.
Threshold contrasts for the number lists had to be
estimated at each background luminance by another
technique.
Threshold contrasts of the number lists were ob-
tained with a Visual Task Evaluator (VTE) (Blackwell,
1970) over several luminance levels, including the two
lowest background luminances used in the numerical
verification task. The relationships of these threshold
data to background luminance have been described
mathematically in an earlier report (Rea, 1982b).
However, the VTE elevates the contrast threshold of fine
spatial details, like these numbers, relative to "free view-
ing" (Rea and Ouellette, 1984). To estimate contrast
threshold without the intervening VTE optics, a gray
number list was placed on the work desk and, by
carefully adjusting the lighting geometry, and thus the
veiling reflections from the sheet (Section III.A), it was
possible to reduce the numbers to a "readability"
threshold criterion at a luminance of 67 cd m-'. By
normalizing the "readability" contrast threshold func-
tion, obtained with VTE, to 0.055 at 67 cd m-2, the
contrast value measured following the free viewing
method, it was possible to estimate the contrast
thresholds (C,) at the four luminance levels used in
the present study (Appendix
C,
Equation CI).
Table
3
provides the four values of C,, derived by these
methods.
E. The formulation for visual response compression
Equation 1 may now be rewritten in the following
form:
VP
=[AL"/(AL"
+
k")] VP-
(7)
where:
VP
=the level of visual performance, as measured
in units of the reciprocal of the time taken
to read the reference sheet, from Equation
6;
n
and
k
are as defined in Equation 1;
AL is the absolute value of a luminous increment
or a luminous decrement from the thresh-
old criterion at a given adaptation
luminance.
Thus, for luminous decrements (dark ink on bright
background) like those employed in this experiment,
where:
LT, is the luminance of the target at threshold
L, and LB are as defined in Equation 2;
C, is the threshold contrast at a given LB, de-
scribed in Section III.D, and can be determined
from Equation C1 in Appendix C.
Alternatively, Equation 8 can be written as
AL
=LB(Cu
-Ct)
(9)
where:
C. is the reference sheet contrast.
By using Equation 9 and rearranging terms, Equation
7 can be rewritten, for calculable simplicity, as
where:
There are three unknowns in Equation 10, VP-,
n,
and k. A nonlinear regression computer routine was
used to provide the best estimates by a least squares
criterion, of these three parameters at each adaptation
luminance. The results of the regressions are presented
in Table 3.
E A general a&withrn of supmthreshoM Yisualperjbmance
It is desirable to predict visual performance at more
background luminances than those actually employed
in this study. A series of interpolations was performed
on the parameter estimates
(n,k, and VP-) in a b l e
3. Figures 5 to
7
show the three sets of parameter
estimates plotted as a function of
8,
or 0 2 , logarith-
mic transformations of background luminance Second-
degree polynomials were used to estimate, by a least
squares criterion, the different parameter values bet-
ween 12 and 169 cd m-'. It was assumed (see Appen-
dix B) that all of the parameter values in Equation 10
(except
C,)
increase monotonically with background
luminance. The logarithmic transformations of the
abscissae were sometimes employed to limit non-
monotonic behavior by the interpolation routines. The
best fitting polynomials and expressions are presented
with each figure.
-These expressions enable one to calculate relative
visual performance (RVP) for alphanumeric reading
material of any contrast, where the paper is brighter
than the ink and the luminance of the paper is between
12 and 169 cd m-' (or, for white matte paper, between
illuminances of 50 and 700 lx). Maximum RVP cor-
responds to a contrast of 1.0 at 169 cd m-2. Appendix
C describes the procedures for calculating RVP.
Figure 8 is a graphical representation of RVP as a
function of contrast and luminance, both scaled log-
arithmically. Examination of this surface from several
perspectives illustrate more clearly the influence of con-
trast and luminance on visual performance according
to this model.
RVP is plotted as a function of luminance for several
contrasts in Figure 9. Two features are readily apparent
from this figure First, visual performance changes very
little from medium to high contrasts. For example, there
is virtually no difference in RVP at contrasts between
05 and 1.0; changes in contrast are much more dramatic
between lower contrasts (e.8, between 0.10 and 0.15). Sec-
ond, the changes in RVP across luminance at high con-
trasts (e.g., 05) are slight, whereas, luminance is much
more important to RVP at low contrasts (eg., 0.15). These
two points lead to the conclusion that visual perfor-
mance will be relatively high and stable for medium
to high contrast tasks, but veiling reflections and re-
duced illumination levels can be very important for low
contrast tasks.
Figure
10
shows RVP plotted as a function of con-
trast at three luminance levels. Several points are worth
noting in this figure First, visual response compression
is readily apparent in this figure; RVP is characterized
by a steep initial slope and saturation as contrast in-
creases. Second, the point of saturation is higher at
higher luminances; RVP is always slightly better at
higher luminances, even for medium and high con-
trasts. Third, the "knees" of the RVP response functions
are higher and more prominent at higher luminances,
indicating that a high level of visual performance can
be maintained at lower contrasts the greatet the level
of illumination. Finally, this figure shows the shift in
absolute contrast threshold, the lower limit of RVP, with
higher luminance.
Figure
11,
augments this last point concerning con-
trast threshold. Contrast, scaled logarithmically, is plot-
ted as a function of luminance, also scaled logarith-
mically; the curves trace constant levels of RVP. These
constant criterion curves are, in principle,
identical
to
directly obtained threshold functions relating contrast
and luminance. It is important to note in
11,
that
the highest constant criterion levels of visual perfor-
mance are unattainable at lower luminances, even at
the highest contrasts.
IV.
Discussion
Figures 8 through
11
help illustrate the predictions
of the model as well as the similarity of these predic-
tions to fihdings from a variety of electrophysiological
and psychophysical studies.
A. Threshold contrast
Many electrophysiological and psychophysical studies
have, for example, used threshold behavior to describe
visual response (e.g., Boynton and Whitten, 1970;
Albrecht and Hamilton, 1982; Tolhurst et al., 1981).
Threshold contrast has been shown repeatedly to
decrease with adaptation luminance (e.g., Blackwell,
1946), and the model makes predictions of threshold
consistent with these observations.
The exact shapes of the various threshold functions
in Figure
11
may be different from other published data
for a variety of reasons (Rea, 198213). The independent
(alphanumeric stimuli) and dependent (time) variables
on which the model is based are somewhat unorthodox
for the vision community, although they were specifical-
ly chosen to be "realistic" and therefore relevant to il-
luminating engineering. Further, these "threshold"
curves were derived from the model and reflect the
suprathreshold data obtained in the numerical verifica-
tion task. They were not obtained from a lengthy
threshold experiment in which subjects were asked to
adopt various constant criteria and judge the visibility
of stimuli at different contrasts and luminances. In
principle, there should be no difference in the data ob-
tained by either procedure, but it seems impractical,
50
...
if not impossible, to expect subjects to adopt and then
upon the latency of response and most electrophysio-
maintain all of the various criteria necessary to generate
logical data, e.g., Albrecht and Hamilton (1982), are
the data required for functions comparable to those in
based upon the amplitude of response. The relation-
Figure
11.
Therefore, it is unlikely that a successful ships between the amplitude and latency response func-
model of suprathreshold visual performance can be
tions can be complex (Ermolaev and Kleinman, 1983;
developed from threshold data alone.
van der Tweel et al., 1979), but similarities have been
The CIE model of visual performance (CIE, 1981a,b) shown (Vaughn et al., 1966). More studies in electro-
is based on just one threshold function. Higher con- physiology may more clearly delineate the relationship
stant criterion functions, called Visibility Levels (VLs), between amplitude and latency.
are obtained by multiplying the single threshold curve
by fixed multiples (CIE, 1981a,b). This assumption, that
C. Subjective impressions
the various VL curves are parallel in log contrast ver-
It is also important to note, that the model seems to
sus log luminance space, is notjustified by the data ob- be consistent with our everyday experiences. One has
tained in this experiment and is therefore inconsistent little problem reading high contrast newsprint under
with the predictions from the RVP model (Appendix virtually any domestic or commercial lighting system.
C).*
In this respect, at least, the RVP model presented
As the model predicts, high contrast reading materials,
here is probably better at making
a
priori predictions,
like a newspaper, are relatively insensitive to variations
and, therefore, in attempting to describe suprathresh- in illuminance or contrast reducing veiling reflections.
old visual performance at a realistic, reading-writing
On the other hand, low contrast reading materials, like
task.
some blueprints or photoduplications, are quite sen-
sitive to such variations. It is much more important for
B. Sufirathreshold response
people viewing such material to have lighting systems
Studies directly measuring suprathreshold visual per- that give high illumination and reduce disability glare
formance have shown that it will increase with both con- and veiling reflections. The model quantitatively under-
trast and luminance
(e.g.,
Weston, 1935, 1945; Boyce,
scores the importance of these everyday occurrences.
1973, Smith and Rea, 1980; McNelis, 1973). The RVP
model makes predictions similar to the data generated
V.
Conclusions
in these studies by predicting an interaction between
These broad confirmations of the model aside,
luminance and contrast. The model predicts that
however, it must be stressed that the model still requires
suprathreshold visual performance will increase only extension and testing. Not all of the important stimulus
slightly with luminance when the contrast is high and parameters have been studied, and there are a variety
more strongly when contrast is low. As with the
of inadequately tested assumptions built into the
threshold data, however, the model predictions and the
model. For example, the size of the printed text was not
data from these various studies do not always agree varied in the experiment. Also, targets brighter than the
quantitatively. It will be argued in a later paper (Rea, background (as with visual display terminals) have not
in press), however, that the results of properly controll- been studied. Importantly too, it was assumed (Appen-
ed visual performance studies (e.g., McNelis, 1973) dix B) that
n, k,
(or k,) and
VP-
should increase
should yield results very similar to the predictions monotonically with luminance (Figures
5,6
and
7).
Fur-
generated by the model. The contrast response func- ther, it was assumed that contrast threshold data from
tions obtained from cortical cells in monkeys (Figure different subjects could be linked with the suprathresh-
I),
for example, are both qualitatively and quantitatively old data reported in this paper to make a more com-
similar to predictions from the model?* This marked
plete model.
similarity, known as "psychophysical isomorphism"
Although these and other issues need to be in-
(Kaufman, 1974; Dawis, 1981), is likely the result of the vestigated, it seems unlikely that the model is grossly
experimental control over the many "nonvisual" fac- inaccurate in representing suprathreshold visual per-
tors that can contribute to the measured responses. Still, formance. Visual response compression, which forms
it should be realized that the RVP model is based largely the basis of the model, is a widely observed phenom-
enon. The model makes predictions consistent with
*It is possible to change the shapes o f the threshold curves in the
documented trends in threshold and suprathreshold
CIE model, depending upon a variety of estimates of free parametersestablished after results are obtained (Rea, 1982b). For a given set
behavior and, importantly, is consistent with our every
of parameters, however, the constant criterion (VL) function woulda
showed
be parallel in a log contrast versus log luminance coordinate system.that reasonable variations in estimates of the parameter,
**Albrecht and Hamilton (1982) did not use a threshold term when
n,
did not significantly affect the model predictions
fitting their data with Equation 1. Adding an appropriate threshold
over
the
range
of contrasts
and luminances
en-
term makes the parameter estimates comparable to those for themodel (Figure I). Conversely, the deletion of a threshold term when
in
fitting the present data, makes the parameter estimates like those
There
is
question that the
must be
extend-
published by Albrecht and Hamilton.ed and revised to some degree, but, based upon the
arguments made above, the model would appear to have
utility for lighting practitioners as an interim algorithm
for calculating relative visual performance at alpha-
numeric reading tasks. Therefore, the RVP model
should be considered as a milestone toward the ultimate
goal for an economic model of task performance.
VI.
Acknowledgments
This paper is a contribution from the Division of Building Research, National Research Council of Canada.
VII.
References
Albrecht, D.G., Hamilton, D.B., "Striate cortex of monkey and cat: Contrast response function:'J. Neurophysiology, 48 (I), pp. 217-237, July 1982.
Blackwell, H.R., "Contrast thresholds of the human eye," JOSA, 36 (ll), pp. 624-643, November 1946.
Blackwell, H.R., "Development of procedures and instruments for visual task evaluation:' Illuminating Engineering, 65, pp. 267-291, April 1970. Blackwell, H.R., Blackwell, O.M., "Population data for 140 normal 20-30 year olds for use in assessing some effects of lighting upon visual performance (Compendium Paper No. 1)" 1980 Complete Compendium of IERI Technical Data in Support of International Commission on Illumination, Publication CIE No. 1912, 1980. Boyce, P.R., "Age, illuminance, visual performance and preference"
Lighting Research and Technology 5 (3), pp. 125-144, 1973.
B o y c ~ P.R., Human f i t M S in Lighting, Macmillan Publishing Co., New
York, 1981.
Boynton, R.M:, Whitten, D.M., "Visual adaptation in monkey cones: Recordings of late receptor potentials," Science, 170, pp. 1423-1426, December 1970.
Brindley, G.S., Physiology of the retina and visual pathway, Edward Ar- nold Ltd., London, Second Edition, 1970.
Clear, R.;Berman, S., "Cost-effective visibility-based design pro- cedures for general office lighting," J. Illuminating Engineering Socie-
ty, 10 (4), pp. 228-236, July 1981.
Commission internationale de l'Cclairage (CIE), Technical Commit- tee 3.1, "An analytic model for describing the influence of lighting parameters upon visual performance: Vol. I: Technical Foundations," Publication CIE No. 1912.1, 1981.
Commission internationale de l'bclairage (CIE), Technical Committee
3.1, "An analytic model for describing the influence of lighting parameters upon visual performance; Vol. 11: Summary and Applica- tion Guidelines," Publication CIE No. 1912.2, 1981.
Dawis, S.M., "The compression model: A re-examination:' Vision
Research, 21, pp. 1511-1515, 1981.
Ermolaev, R.Y., Kleinman, D., "The effect of background illumina- tion on pattern onset visual evoked potentials:' Electroencephalography
and Clinical Neurophysiology, 55, pp. 546-556, 1983.
Graham, C.H., ed., Vision and visual perception, John Wiley and Sons Inc., New York, 1965.
Hood, DC., Ilves, T., Maurer, E., Wandell, 8 , Buckingham, E., "Human cone saturation as a function of ambient intensity: A test of models of shifts in the dynamic range," Vision Research, 18, pp. 983-9931978. Hood, DC., Finkelstein, M.A., Buckingham, E., "Psychophysical tests of models of the response function:' Visian &search, 19, p p 401-4061979. Hood, DC., Finkelstein, M.A., "Comparison of changes in sensitivi. ty and sensation: Implications for the response-intensity function of the human photopic system:'J. of Experimental Psychology: Human
Perception and P e r f m n c e , 5 (3), pp. 391-405, August 1979.
ford University Press, 1974.
Koshland, D.E., Goldbeter, A,, Stock, J.B., "Amplification and adap. tation in regulatory and sensory systems," Science, 217, pp. 220- 225, July 1982.
Lipetz, L.E., "The transfer functions of sensory intensity in the ner- vous system," Vision Research, 9, pp. 1205-1234, 1969.
McNelis, J.F., "Human performance: A pilot study."J Illuminating
Enginee~ing Society, 2 (3), pp. 190-196, April 1973.
Naka, K.I., Rushton, W., "S-potentials from colour units in the retina of fish (Cyprinidae),"J Physiology, 185, pp. 536-555, 1966a. Naka, K.I., Rushton, W., "An attempt to analyse colour reception by e1ectrophysiology~'J. Physiology, 185, pp. 556-586, 196613.
Poulton, E.C., "Skimming lists of food ingredients printed in different brightness contrasts," J. ofApplied Psychology," 53 (6), pp. 498-500, 1969. Rea, M.S., "Visual performance with realistic methods of changing contrast," J. Illuminating Engzneering Society," 10 (3),
pp.
164-1 77, April 1981.Rea, MS., ' X n overuiew of visual pe-rjiormance," Lighting Design and Ap- plication, 12 (ll), pp. 35-41, November 1982a.
Rea, M.S., "The validity of the relative contrast sensitivity function for modelling threshold and suprathreshold responses," The integra-
tion of visual p e r f m n c e criteria into the illumination design process, Public
Works Canada, Ottawa, Canada, January 1982b.
Rea, M.S., "Effects of Haidinger's brushes on visual performance," J. Illuminating Engineering Society," 12 (3), pp. 197-203, April 1983.
Rea, M.S., "Overview of task performance in the illuminated environ- ment,'' illumination Engineering Learning Aid, Vol. 11, June 1984.
Rea, M.S., Ouellette, MJ., An assessment of the Blackwell visual task
evaluatw, model 3X, Division of Building Research, National Research
Council Canada, DBR Paper No. 1160, 1984.
Slater, A.I., Perry, M.J., Crisp, V.H.C., "The applicability of the CIE visual performance model to lighting design," Light and Lighting '83,
Proceedings of the 20th Session, Amsterdam, Publication CIE No. 56,
pp. D11411-4, 1983.
Smith, S.W., Rea, M.S., "Relationships between office task perfor- mance and ratings of feelings and task evaluations under different light sources and levels," Proceedings of the 19th Session, Kyoto, CIE Publication No. 50, pp. 207-211, 1980.
Tolhurst, DJ., Movshon, J.A., Thompson, I.D., "The dependence of response amplitude and variance of cat visual cortical neurons on stimulus contrast," Experimental Brain Research, 41, pp. 414- 419,1981. van der Tweel, L.H., Estevez, O., Cavonius, C.R., "Invariance of the contrast evoked potenJial with changes in retinal illuminance," Vi-
sion Research, 19, pp. 1283-1287, 1979.'
Valeton, J.M., "Photoreceptor light adaptation models: An evalua- tion;' Vision Research, 23 (12), pp. 1549-1554, 1983.
Valeton, J.M., van Norren, D., "Light adaptation of primate cones: An analysis based on extracellular data," Vision Research, 23 (12), pp. 1539-1547, 1983.
Vaughan, H.G., Costa, L.D., Gilden, L., "The functional relation of visual evoked response and reaction time to stimulus intensity:' Vi-
sion Research, 6, pp. 645-656, 1966.
Weston, H.C., "The relation between illumination and industrial ef- ficiency: The effect of size of work:' Her Majesty's Stationery Office, London, pp. 1-14, 1935.
Weston, H.C., "The relation between illumination and visual effi- ciency: The effect of brightness contrast," Industrial Health Research Board, Great Britain Medical Research Council, London, Report No. 87, pp. 1- 35, 1945.
Kaufman, L., Sight and mind: An introduction to visual perception, Ox.