HAL Id: hal-00328415
https://hal.archives-ouvertes.fr/hal-00328415
Submitted on 16 Dec 2005
HAL is a multi-disciplinary open access
archive for the deposit and dissemination of
sci-entific research documents, whether they are
pub-lished or not. The documents may come from
teaching and research institutions in France or
abroad, or from public or private research centers.
L’archive ouverte pluridisciplinaire HAL, est
destinée au dépôt et à la diffusion de documents
scientifiques de niveau recherche, publiés ou non,
émanant des établissements d’enseignement et de
recherche français ou étrangers, des laboratoires
publics ou privés.
Indications of thin cirrus clouds in the stratosphere at
mid-latitudes
Philippe Keckhut, Alain Hauchecorne, Slimane Bekki, Augustin Colette,
Christine David, Julien Jumelet
To cite this version:
Philippe Keckhut, Alain Hauchecorne, Slimane Bekki, Augustin Colette, Christine David, et al..
Indi-cations of thin cirrus clouds in the stratosphere at mid-latitudes. Atmospheric Chemistry and Physics,
European Geosciences Union, 2005, 5 (12), pp.3407-3414. �10.5194/acp-5-3407-2005�. �hal-00328415�
www.atmos-chem-phys.org/acp/5/3407/ SRef-ID: 1680-7324/acp/2005-5-3407 European Geosciences Union
Chemistry
and Physics
Indications of thin cirrus clouds in the stratosphere at mid-latitudes
P. Keckhut, A. Hauchecorne, S. Bekki, A. Colette, C. David, and J. JumeletService d’A´eronomie/Institut Pierre-Simon Laplace, CNRS, Verri`eres le Buisson, France Received: 28 December 2004 – Published in Atmos. Chem. Phys. Discuss.: 21 June 2005 Revised: 5 October 2005 – Accepted: 16 November 2005 – Published: 16 December 2005
Abstract. This study is devoted to the possible presence
of cirrus clouds in the stratosphere. Three months of lidar data collected in the south of France (44◦N) for detection of stratospheric cirrus are carefully analyzed. Most of the cir-rus clouds appear to be located in the troposphere below the dynamical tropopause even when the cloud top is close to the thermal tropopause. Ten cirrus cases are found to be un-ambiguously located above the local dynamical tropopause according to high-resolution PV advection calculations. The highest cloud detected above the local tropopause (nearly 3 km above) is observed inside air masses that originate from the sub-tropical regions and are then transported rapidly to mid-latitudes through isentropic transport. The details of the air mass history is described with a 3-D trajectory model. The back-plumes indicate that the air mass, moist with re-spect to typical stratospheric air, was transported from the subtropical troposphere to the lowermost stratosphere in 4 days before detection above France. A continuous cooling of 5–10◦along the trajectory took place during its transit. This cooling could have been partly responsible for the thin cirrus layer detected.
1 Introduction
The depletion of ozone just above the tropopause region has a limited influence on total ozone column trends and on UV ra-diation at ground level. However, the Earth’s climate is very sensitive to ozone changes in this region. (Lacis et al., 1990; Ramaswamy et al., 1992). Ozone trends in the lower strato-sphere at mid-latitude are notoriously difficult to establish (WMO, 2002). It is acknowledge that mean ozone density has decreased by between 5 and 20%/decade in this region.
The exact reasons for this decline remain unclear. Hetero-geneous reactions on aerosol particles are able to destroy
sig-Correspondence to: P. Keckhut
nificantly ozone inside the polar stratospheric vortexes due to very low temperatures prevailing there (Solomon et al., 1986). However, it is not yet clear whether the entire ob-served decrease at mid-latitude is directly related to the po-lar depletion (WMO, 1999). The fact that reported ozone trends in the winter/spring seasons are twice those obtained for the summer/autumn seasons (WMO, 1999) favors a trans-port contribution rather than an in-situ mechanism. In the recent years, a lot of efforts have been performed to esti-mate the potential ozone decrease induced by the transport itself. The contribution of the transport strongly depends on the meteorological conditions and the stability of the polar vortex (WMO, 2002) and approximately an average of 40% of the observed decline of the mid-latitude ozone could be at-tributed to the transport of polar ozone-depleted air into mid-latitudes.
Meanwhile it appears that transport from polar regions cannot be responsible for all the depletion observed at mid-latitude and is not applicable to the summer/autumn trends. It is then necessary to search for other causes such as in situ chemistry.
Borrmann et al. (1996) showed that cirrus clouds might lead to heterogeneous Chemical reactions similar to those taking place on Polar Stratospheric Clouds and suggested that these clouds could affect the abundances of ozone. Some observational studies (Reichard et al., 1996; Roumeau et al., 2000) have found such diminutions of ozone in the presence of cirrus at both mid-latitude and tropical sites. While several studies (Stowe et al., 1989; Wylie et al., 1994; Wang et al., 1996) reported frequent cirrus clouds near the tropopause, Solomon et al. (1997) suggested that the chemistry associ-ated to these clouds at mid-latitudes may contribute ozone depletion observed at mid-latitudes in the lower stratosphere and would permit to reconcile observed and modeled ozone trends at mid-latitudes (Meilinger et al., 2001).
Some studies have reported cirrus above the thermal tropopause (Sassen et al., 1991; Murphy et al., 1990; Wang et al., 1996). To our best knowledge, no cirrus has been shown
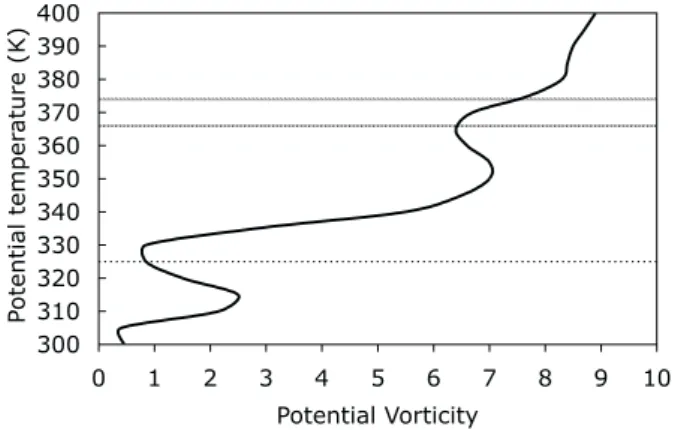
3408 P. Keckhut et al.: Cirrus in the stratosphere 300 310 320 330 340 350 360 370 380 390 400 0 1 2 3 4 5 6 7 8 9 10 Potential Vorticity Po tential temper ature (K)
Fig. 1. Vertical profile of the potential vorticity for 20 January at
midnight. The top and bottom heights of high altitude cloud around 370 K are reported and the level of the thermal tropopause around 325 K is indicated with a dashed line.
to be clearly and unambiguously located in the stratosphere at mid-latitudes. Here we report on the search for cirrus in the stratosphere using the French lidar database acquired in south of France at Observatory of Haute-Provence (OHP). We find some observational indications that thin cirrus can be observed high enough to be unambiguously classified as a Mid-latitude Stratospheric Cloud type (MSC).
First, we briefly present data and the methodology in Sect. 2. Then after a short section on stratospheric cirrus detection, one case observed during the night of 20 to 21 January 2000 is described and analyzed in Sect. 4. In Sect. 5, the history of the air masse is investigated. And finally con-clusions are drawn in Sect. 6.
2 Data and methodology description
At Observatory of Haute-Provence in France (44◦N, 6◦E), a
program of systematic lidar soundings has been running for two decades. Despite being mainly devoted to stratospheric observations as part of the Network of Detection of Strato-spheric Changes (Kurylo and Solomon, 1990), the tropo-sphere is also investigated simultaneously with similar tech-niques. Clouds with optical depths, as small as 0.03, can be detected with the system because measurements are all per-formed at night with a quite powerful lidar (0.6 m2W) and a small field of view of the receiver. In addition, the thick-ness of the clouds can be accurately determined because the vertical resolution of the measurements is only 75 m. As de-scribed in Goldfarb et al. (2001), the presence of cloud is determined when the following criteria are met: the scatter-ing ratio needs to be greater than a threshold and the cloud layer is situated in an air mass with a temperature of −25◦C
or colder. The selected threshold is equal to three times the standard deviation of the scattering ratio at the cloud height. A climatology of cirrus clouds at mid-latitudes has been derived from 3 years of lidar data (Goldfarb et al., 2001).
It has shown that cirrus were present half the time and that about half of them could be classified as sub-visible cases according to the definition of Sassen (1989). Goldfarb et al. (2001) also reported that most of the cirrus were located just below the thermal tropopause (according to the WMO definition) but many of them were partly observed above the thermal tropopause. The thermal tropopause was determined from systematic radio-soundings performed at Nˆımes by the French meteorological center (M´et´eo-France), about 110 km westward from the lidar site. As a result of this separation, the temperature at the cirrus height could not expected to be accurate by less than a few K. More importantly, the ther-mal tropopause is not the best criteria for distinguishing tro-pospheric from stratospheric air. A more accurate criteria is based on the potential vorticity (PV). When diabatic and turbulent effects can be neglected, the potential vorticity of an air parcel is conserved along its three dimensional trajec-tory. On a time scale of few days, it is almost the case in the stratosphere. A threshold value of 1.6 PVU (PV units) for the tropopause has been defined by WMO (1986) and Hoerling et al. (1991) suggest to consider 3.5 PVU threshold value. So instead of considering the tropopause as a sharp transition, a smoother transition zone can be defined by these two PV thresholds.
Due to the need for a PV estimate, collocated with cloud observations, a three-dimensional high-resolution PV advec-tion model called MIMOSA (Mod`ele Isentropique de trans-port M´eso-´echelle de l’Ozone Stratosph´erique par Advec-tion) is used to derive the PV profile above the OHP station (Fig. 1). The model is forced by ECMWF daily analyses. The advection of PV takes place on isentropic surfaces. PV is also relaxed towards ECMWF analyses with a time con-stant of 10 days. The advection scheme is semi-Lagrangian. More details on the model can be found in Hauchecorne et al. (2002). The ability of MIMOSA to describe small-scale-structures through the advection of PV as a quasi-passive tracer has already been demonstrated in the upper tropo-sphere – lower stratotropo-sphere domain (Hauchecorne et al., 2002; Heese et al., 2001). A typical PV profiles depict small values (around or smaller than 1 PVU) for potential tempera-ture below a 330 Kelvin (approximately 12 km) and then, due to the static stability of the stratosphere, exhibit a rapid and monotone increase with values around 8 PVU at 400 Kelvin (16 km).
In order to determine the geographical origins and the thermal history of air masses, reverse plume dispersion cal-culations are performed using the FLEXPART model (ver-sion 5.1) that is extensively described in Stohl (1998). The trajectory model is driven by 6-hourly ECMWF ERA40 re-analysis (T106L60) interleaved with operational forecasts every 3 h (ECMWF, 1995). The code permits to advect large plumes of passive tracer by reverse non-isentropic three dimensional transport including parametrization of sub-grid scale orographic processes and convection following the formulation of Emanuel and Zivkovic-Rothman (1999)
P. Keckhut et al.: Cirrus in the stratosphere 3409
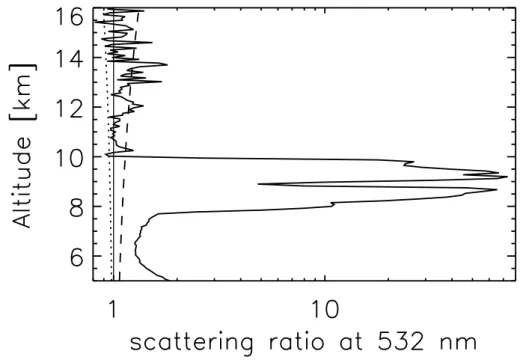
Fig. 2. Mean vertical backscattering ratio profile obtained with the
lidar at OHP from 20:50 to 22:00 UT on 20 January 2000. The
dotted line indicates the photon noise level (1 standard deviation)
while the dashed line corresponds to the threshold limit of the cloud
detection.
Atmos. Chem. Phys., 5, 1–12, 2005
www.atmos-chem-phys.org/acp/5/1/
Fig. 2. Mean vertical backscattering ratio profile obtained with the lidar at OHP from 20:50 to 22:00 UT on 20 January 2000. The dotted
line indicates the photon noise level (1 standard deviation) while the dashed line corresponds to the threshold limit of the cloud detection.
P. Keckhut et al.: Indications of thin cirrus clouds in the stratosphere at mid-latitudes
9
Fig. 3. PV meridional section, for latitudes from 30 to 60
◦
N, at
the OHP longitude, as deduced from the MIMOSA model for 20
January at midnight. The vertical structure is given for potential
temperature from 300 to 400 K. The light-blue-purple colors
corre-spond to air associated with the tropopause region, while
orange-yellow-white colors indicate large PV values associated with
strato-spheric air.
Fig. 3. PV meridional section, for latitudes from 30 to 60◦N, at the OHP longitude, as deduced from the MIMOSA model for 20 January at midnight. The vertical structure is given for potential temperature from 300 to 400 K. The light-blue-purple colors correspond to air associated with the tropopause region, while orange-yellow-white colors indicate large PV values associated with stratospheric air.
designed for improving convection in tropical region. Even though simulation is initialized in the stratosphere, convec-tive scheme was turned on since, as preliminary analysis suggested, a tropical origin is suspected for air masses of interest. A last specificity of FLEXPART consists in
ac-counting for stochastic fluctuation by solving Langevin equa-tions in the plume dispersion modelling (Stohl and Thomson, 1999). The transport calculation by FLEXPART is expected to be slightly more reliable than the isentropic transport by MIMOSA because the trajectories are 3-D (cross-isentropic
3410 P. Keckhut et al.: Cirrus in the stratosphere transport is accounted for). It also includes a random
com-ponent for a representation of the effect of turbulence that permits to reproduce more realistically the spreading of clus-ter trajectories.
3 Stratospheric cases identification
During the first three months of 2000, 58 nights of lidar op-erations were conducted, and cirrus clouds were observed on 27 nights. A similar frequency of occurrence was obtained on a larger lidar data set (Goldfarb et al., 2001). Ten cir-rus out of the 27 detections, were found to be at least partly located in the stratosphere, above the dynamical tropopause defined as 1.6 PVU surface calculated from the MIMOSA fields. For these 10 cases, the height differences between the dynamical tropopause and the top of the cirrus layer range from 250 m to 2.7 km. Out of those 10 cirrus layers, only five of them are found to be completely in the stratosphere (i.e. bottom of the cloud above the tropopause). Finally, two cloud layers are found to be more than 2 km above the tropopause. It is worth pointing that there are some sharp horizontal PV gradients (see Fig. 3) that may explain the disagreement with previous estimates of the location of the cirrus according to the thermal tropopause (Goldfarb et al., 2001).
4 Case study
We now focus our attention on the highest cirrus with respect to the tropopause observed during these 3 months. During the night of 20 to 21 January, several hours of lidar measure-ments were conducted and a thin cloud (Fig. 2) was detected between 13.5 and 13.9 km (respectively potential tempera-ture between 367 and 374 K) from 20:50 to 22:00 UT above OHP. Another cirrus is present at lower altitude (8–10 km) in the troposphere during a longer period corresponding to the whole night of observation, with a mean backscattering ratio of nearly a magnitude larger than the upper cloud that exhib-ited a mean scattering ratio during the whole period of 1.5. The thermal tropopause is at 11.1 km or in potential temper-ature at 325 K (estimated from the radiosonde profiles).
The PV field shows a very disturbed situation (Figs. 3, 4). The PV profile above OHP at midnight on 20 January, indi-cates a threshold value of 1.6 PVU at 310 K (Fig. 1). The signal of the stratospheric cloud is rather weak but above the threshold during more than ten minutes. A fine structure of tropospheric air centered at 325 K (see Fig. 3) is notice-able above this level and then the PV profile crosses again the 1.6 PVU threshold at 332 K. If the upper limit (3.5 PVU) proposed by Hoerling et al. (1991) is used instead of the 1.6 PVU threshold, the potential temperature covered by the tropopause region can extend as high as 340 K.
This cloud appears to be clearly well above the tropopause whatever the definition of it. Around the altitude of the cloud
a slight PV anomaly can be noticed suggesting a possible origin from a region close to the tropopause or even the tro-posphere. Nonetheless, PV values within the anomaly are still too highs to be considered characteristic of tropospheric air. The cloud seems to be located in the upper part of the PV anomaly. This might be due to the fact that the temporal coincidence is not perfect (PV profile at midnight, cirrus de-tected between 20:50 to 22:00). Also even under the thresh-old of detection, the scattering profile seems to indicate that the cloud extends further downward. The meridional section of the PV shows that this structure extends to up to 400 K (Fig. 3).
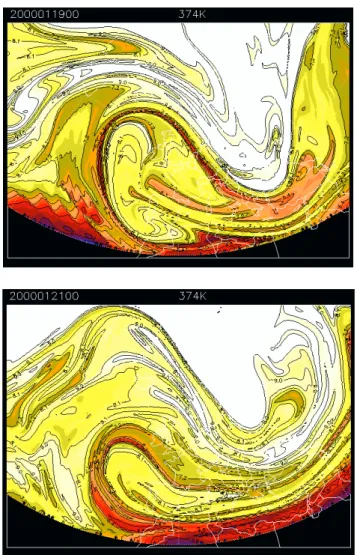
The anomaly is caused by a laminae structure that forms a bit less than a week before, and passes over the lidar location during the night of 20 to 21 January. This structure originates from the sub-tropical area and appears as a folded tongue of tropospheric air sweeping Europe (Fig. 4). The structure ap-pears clearly more than 5 days before detection above OHP and its development can be decomposed in the model simu-lations day after day with a twisted motion on the isentropic surface before being observed above France. It then moves southward, out of France and dissipates, according to the MI-MOSA model.
Plume dispersion calculation are performed with a dif-ferent advection tool, the FLEXPART model which allows advection-dispersion backward in time (Stohl and Thomson, 1999). The FLEXPART simulation is initialized by releas-ing on 20 January 2000, 20 000 air parcels that are uniformly spread over the 12–16 km altitude range between 18:00 and 24:00 UT within a box of 10◦in longitude and 5◦in latitude
centered on the OHP station (43◦560N, 5◦420E). The initial domain was chosen to be large in order to account for pos-sible errors in the wind fields. Among these 20 000 parcels, 3604 are released at the altitude of the observed cirrus (13.5 to 13.9 km).
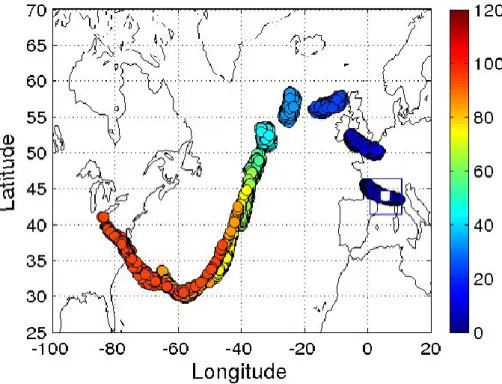
Although air parcels were initially released within a rela-tively large rectangular domain those that originate from the troposphere within the last 6 days (about 310 air parcels) form in the release domain a peculiar filamentary structure (see Fig. 5). This pattern is very similar to that observed in the MIMOSA simulation. Again, like in the MIMOSA sim-ulation, the FLEXPART results show that air parcels were first coming from England after crossing the Atlantic Ocean northward from the Bermudes (Fig. 5). The length of the trajectories and the time for transit from the troposphere up to the stratosphere above OHP are in good agreement with the statistical study of Fueglistaler (2004) that was based on ECMWF trajectories. Their analysis showed median lengths of several tenth thousand kilometers from Africa and South America with a residence time of few days around 360 K .
P. Keckhut et al.: Cirrus in the stratosphere 3411
5 Air mass history
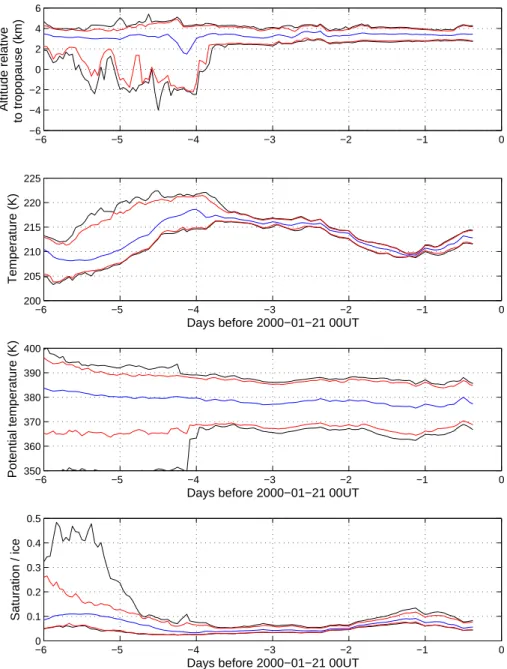
Figure 6 shows the temporal evolution of the altitude with respect to the tropopause of the air parcels of tropospheric origin (i.e. relative altitude becoming negative at one point within the last 6 days). The air parcels were advected-dispersed ackward in time from the night of detection start-ing from OHP at about the altitude range of the cirrus cloud. Instead of showing the temporal evolution for all parcels, only the envelope is inducated. The tropopause is derived in the Flexpart calculations according to the thermal defini-tion equatorward of 20◦and a dynamical one poleward of 30◦ with a linear interpolation of both definitions between these two limits (James et al., 2003). The air parcels started cross-ing the tropopause 3–4 days before the cloud detection over OHP (see Fig. 6). The temporal evolutions of the mean air parcel potential temperature and the evolution of its envelop are also shown in Fig. 6. Only few percents of these parcels move significantly to another isentropic level (see the third plot of Fig. 6), possibly due to turbulence effects rather than diabatic cooling as already reported (Juckes, 2000). Over-all, the transport of the filamentary structure appears quasi-isentropic.
In addition to the cloud occurrence statistics, a lot of un-certainty remains about the formation and persistence of the MSC. With a single measurement, it is not possible to know whether ice crystals were transported into the stratosphere or if moist air parcels froze as air crossed the cold point. Holton and Gettelmen (2001) pointed out the importance of horizon-tal motion for cloud formation and dehydration in the TTL, while Jensen et al. (2004) mentioned that the cloud lifetime along the trajectories into mid-latitude regions are typically no longer than one or two days.
While all the selected trajectories cross the dynamical tropopause, the mean value given by FLEXPART analyses remains above the tropopause on average, air did not origi-nate from below the tropopause. However, some air parcels spent some time below the tropopause (Fig. 6). From the MIMOSA analyses (Fig. 4) the origin of air masses is more clearly related to the tropospheric region. The filament of mixed tropospheric-stratospheric air sampled above the OHP, is expected to be moister than the surrounding stratospheric air but it is quite difficult to estimate the water vapor content. At the cloud altitude, water vapor content, given by the me-teorological analyses, is not reliable enough for deriving ice saturation level. In our case, a value of 0.2 (with a maximum of less than 0.5) is obtained 5 days before the OHP obser-vation in the FLEXPART analyses and thereafter, it mostly remains below 0.1, which is far from cloud formation condi-tions. However, knowing the poor reliability for water vapour in these meteorological analyses around the tropopause, it is worth noting that this relative enhancement is probably a sign of mostering. Even with a correct water vapour level at the coarse resolution of the meteorological analysis, it would be difficult to exactly evaluated the ice saturation level within
Fig. 4. PV map on a geographical sector including Europe. The
potential vorticity is given for potential temperature corresponding to the top of the cloud (about 374 K) midnight on January 21 (bot-tom) and two days before detection (top). Color scale is similar than Fig. 3.
Atmos. Chem. Phys., 5, 1–12, 2005 www.atmos-chem-phys.org/acp/5/1/
Fig. 4. PV map on a geographical sector including Europe. The
potential vorticity is given for potential temperature corresponding to the top of the cloud (about 374 K) midnight on 21 January (bot-tom) and two days before detection (top). Color scale is similar than Fig. 3.
the filament. Indeed, the filamentary structure is so thin that it is not resolved in meteorological field. Clearly, the analysis can only be at best indicative of the water vapour level in the filament. FLEXPART analyses show that temperatures con-tinuously decrease (Fig. 6) after air masses enter and transit through the stratosphere by up to 5–10◦probably because the
trajectories move through higher latitudes. The drop in tem-perature by up to 18 K experienced by the air masses dur-ing their transit in the stratosphere would have resulted in a strong increase in ice saturation and favoured cirrus forma-tion. At the same time, this air parcel would be losing its integrity during transit due to mixing processes, reducing the potential for cloud formation. This temperature trend is only reversed (by 3 K) during half day before advection over OHP. This should probably have been too short to lead to a com-plete evaporation of a cirrus cloud (Jensen et al., 2004).
It is worth pointing out that the associated ozone levels in this air mass must have been low because of its tropospheric
3412 P. Keckhut et al.: Cirrus in the stratosphere
Fig. 5. Geographical position of air parcels released at the altitude of the cirrus and that have gone below the thermal tropopause (backwards
in time). The rectangle box corresponds to the spatial domain where back-trajectories were initialized on 20 January 2000 at 18:00. Every previous 12 hours, the same air parcels are given following the color table indicating the time (hours) before the air transit over OHP.
origin. Unfortunately, no ozone measurements were made on that day at OHP.
6 Discussion and conclusions
This observational case study shows that Mid-latitude Strato-spheric Clouds (MSC) can exist under certain conditions. The transport simulations suggests that ice clouds can ap-pear in the stratosphere when subtropical upper tropospheric moist air is transported quasi-isentropically into the mid-latitudes lower stratosphere through thin filamentary struc-tures. The filament had an horizontal thickness estimated at-less than 100 km from Fig. 4 and crossed France in clearly less than 12 h (see Fig. 5) which explains the short duration of the cirrus detection. The quantity of moist air transported is probably modest. However, this fine scale transport is most certainly irreversible. Quasi-isentropic transport of subtrop-ical tropospheric air into the mid-latitude lower stratosphere is not a new mechanism and is an evident source of moist air into the stratosphere. However, the global significance of this source cannot be assessed from a single case study. The data set analyzed here is too small to derive a reliable estimate of the occurrence of such clouds.
This case is a good illustration of air transport from the troposphere to the stratosphere through what Sherwood and Dessler (2000) termed the TTL (Tropical Tropopause Layer) or sub-stratosphere (Thuburn and Craig, 2002). This layer is
delimited by the level of zero net radiative heating (350 K), and the highest level reached by convection (420 K). The main conceptual idea for the entry of tropospheric air into the stratosphere is based on the Brewer-Dobson circulation. This case (as many other cases) shows that some of the trans-port occurs through small scale filamentary structures of few kilometers vertically and a couple of hundred of kilometers thickness that can be stretched over thousand kilometers be-fore being irreversibly mixed most probably. This obser-vation provides a good support of the statistical analysis of Fueglistaler (2004) that predicts the transport of moist air from the tropical tropopause to the stratosphere.
The presence of cirrus clouds in the mid-latitude low-ermost stratosphere does not imply that the heterogeneous chemistry operating on them is significant for the ozone bud-get as speculated by Solomon et al. (1997). First, tropical up-per tropospheric air contains very low amounts of inorganic chlorine and bromine. Second, contact and mixing with the surrounding air is required to allow an efficient chemical pro-cessing of large volumes of stratospheric air. But this situa-tion is less favorable for ozone destrucsitua-tion, than in the po-lar vortex. Indeed, po-large volumes of stratospheric air can be chemically processed by the usually stationary and often persistent large-scale polar stratospheric clouds. In contract, the persistence of the mid-latitude thin clouds is uncertain and, instead of having air flowing through them, they tend to follow the flow. On the other hand, these thin filamentary structures have extremely high surface to volume ratio and
−6 −5 −4 −3 −2 −1 0 −6 −4 −2 0 2 4 6 Altitude relative to tropopause (km) −6 −5 −4 −3 −2 −1 0 200 205 210 215 220 225 Temperature (K)
Days before 2000−01−21 00UT
−6 −5 −4 −3 −2 −1 0 350 360 370 380 390 400 Potential temperature (K)
Days before 2000−01−21 00UT
−6 −5 −4 −3 −2 −1 0 0 0.1 0.2 0.3 0.4 0.5 Saturation / ice
Days before 2000−01−21 00UT
Fig. 6. Temporal evolution of air parcel altitude relative to the tropopause (top panel), temperatures (second panel) and potential temperatures
(third panel). Instead of showing the temporal evolution for all the parcels, only the envelopes are indicated (black: maximum and minimum, red: upper and lower 2% percentiles. The average is plotted in blue). The air parcels of tropospheric origin are advected-dispersed backward in time starting from OHP on 20 January at night at the altitude range of the cirrus cloud.
therefore offer large surfaces of contact with stratospheric ozone-rich air on the edges. More data are required to quan-tify the frequency of occurrence of such clouds and their sur-face of contact.
High resolution lidar data from space such as those from the CALIPSO should offer a global view of MSCs and al-low a better characterization of the history of the clouds as soon as they exhibit optical depth sufficiently large for detec-tion. Further analysis of the OHP database will be pursued with special attention on cases when simultaneous ozone and water vapor lidar measurements are available.
Acknowledgements. Authors would like to acknowledge B. Nicaise and B. Lelong who contribute to this study during their master preparation at the University of Versailles-Saint-Quentin. The qual-ity and the high frequency of observations are due to the continuous efforts of OHP team and engineers from Service d’A´eronomie and the support of ADEME (contract no. 0362C0076). A. Stohl is acknowledged for helpful advices on the FLEXPART model and ECMWF is also acknowledged for providing meteorological re-analyses. Comments from M. Juckes and the both referees were very constructive. This work was performed under the framework of the EU program PARTS “Particles In The Upper Troposphere And Lower Stratosphere And Their Role in the Climate System”
3414 P. Keckhut et al.: Cirrus in the stratosphere and the EU COST action “Data Exploitation and Modeling for the
Upper Troposphere and Lower Stratosphere”. Edited by: B. K¨archer
References
Borrmann, S., Solomon, S. S., Dye, J. E., and Luo, B.: The potential of cirrus clouds for heterogeneous chlorine in the middle and lower atmosphere, Geophys. Res. Lett., 23, 2133–2136, 1996. ECMWF: User Guide to ECMWF Products 2.1, Meteorol. Bull.
M3.2, ECMWF, Reading, UK, 1995.
Emanuel, K. A. and Zivkovic-Rothman, M.: Development and eval-uation of a convection scheme for use in climate models, J. At-mos. Sci., 56, 1766–1782, 1999.
Fueglistaler, S., Wernli, H., and Peter, T.: Tropical troposphere-to-stratosphere transport inferred from trajectory calculations, J. Geophys. Res., 109, D03108, doi:10.1029/2003JD004069, 2004. Goldfarb, L., Keckhut, P., Chanin, M.-L., and Hauchecorne, A.: Cirrus climatological results from lidar measurements at OHP (44◦N, 6◦E), Geophys. Res. Lett., 28, 1687–1690, 2001. Hauchecorne, A., Godin, S., Marchand, M., Heese, B., and
Souprayen, C.: Quantification of the transport of chemical constituents from the polar vortex to middle latitudes in the lower stratosphere using the high-resolution advection model MIMOSA and effective diffusivity, J. Geophys. Res., 107, doi:10.1029/2001JD000491, 2002.
Heese, B., Godin, S., and Hauchecorne, A.: Forecast and simu-lation of stratospheric ozone filaments: A validation of a high-rersolution potential vorticity advection model by airborne ozone lidar measurements in winter 1998/1999, J. Geophys. Res., 106, 20 011–20 024, 2001.
Hoerling, M., Schaak, T., and Lenzen, A.: Global objective tropopause analysis, Mon. Weather Rev., 119, 1816–1839, 1991. Holton, J. R. and Gettelmen, A.: Horizontal transport and the dehy-dration of the stratosphere, Geophys. Res. Lett., 28, 2799–2802, 2001.
James, P., Stohl, A., Forster, C., Eckhardt, S., Seibert, P., and Frank, A.: A 15-year climatology of stratosphere-troposphere exchange with a Lagrangian particle dispersion model: 1. Methodology and validation, J. Geophys. Res., 108(D12), 8519, doi:10.1029/2002JD002637, 2003.
Jensen, E. J. and Pfister, L.: Transport and freeze-drying in the tropical tropopause layer, J. Geophys. Res., 109, doi:1.1029/2003JD004022, 2004.
Juckes, M. N.: The static stability of the midlatitude troposphere: the relevance of moisture, J. Atmos. Sci., 57, 3050–3057, 2000. Kurylo, M. J. and Solomon, S.: Network for the Detection of
Strato-spheric Change, NASA Report, Code EEU, 1990.
Lacis, A. A., Wuebbles, D. J., and Logan, J. A.: Radiative forc-ing of climate by changes in the vertical distribution of ozone, J. Geophys. Res., 95, 9971–9981, 1990.
Meilinger, S. K., K¨archer, B., von Kuhlmann, R., and Peter, Th.: On the impact of heterogeneous chemistry on ozone in the tropopause region, Geophys. Res. Lett., 28, 515–518, 2001.
Murphy, D. M., Kelly, K. K., Tuck, A. F., Proffitt, M. H., and Kinne, S.: Ice saturation at the tropopause observed from the ER-2 air-craft, Geophys. Res. Lett., 17, 353–356, 1990.
Ramaswamy, V., Schwarzkopf, M. D., and Shine, K. P.: Radiative forcing of climate from halocarbon-induced global stratospheric ozone loss, Nature, 355, 810–812, 1992.
Reichard, J., Ansmann, A., Serwazi, M., Weitkamp, C., and Michaelis, W.: Unexpectedly low ozone concentration in mid-latitude tropospheric ice clouds: A case study, Geophys. Res. Lett., 23, 1929–1932, 1996.
Roumeau, S., Br´emaud, P., Rivi`ere, E., Baldy, S., and Baray, J. L.: Tropical cirrus clouds: a possible sink for ozone, Geophys. Res. Lett., 27, 2233–2236, 2000.
Sassen, K.: Corona-producing cirrus cloud properties derived from polarization lidar and photographic analyses, Appl. Opt., 30, 3421–3552, 1991.
Sassen, K., Griffin, M. K., and Dodd, G. C.: Optical scattering and microphysical properties of subvisible cirrus clouds, and climatic implications, J. Appl. Meteor., 28, 91–98, 1989.
Sherwood, S. C. and Dessler, A. E.: On the control of stratospheric humidity, Geophys. Res. Lett., 27, 2513–2516, 2000.
Solomon, S., Garcia, R. R., Rowland, F. S., and Wuebbles, D. J.: On the depletion of Antarctic ozone, Nature, 321, 755–758, 1986. Solomon, S., Borrmann, S., Garcia, R. R., Portmann, R., Thomason,
L., Poole, L. R., Winker, D., and McCormick, P.: Heterogeneous chlorine chemistry in the tropopause region, J. Geophys. Res., 102, 21 411–21 429, 1997.
Stohl, A. and Thomson, D. J.: A density correction for Lagrangian particle dispersion models, Boundary Layer Meteorol., 90, 155– 167, 1999.
Stohl, A., Hittenberger, M., and Wotawa, G.: Validation of the Lagrangian particle dispersion model FLEXPART against large scale tracer experiment data, Atmos. Environ., 24, 4245–4264, 1998.
Stone, L. L., Yeh, H. Y. M., Eck, T. F., Wellemeyer, C. G., and Kyle, H. L.: The 7 cloud data processing team, Nimbus-7 global cloud climatology, II First year results, Ann. Meteorol. Soc., 671–709, 1989.
Thuburn, J. and Craig, G. C.: On the temperature struc-ture of the tropical substratosphere, J. Geophys. Res., 107, doi:10.1029/2001JD000448, 2002.
Wang, P. H., Minnis, P., McCormick, M. P., Kent, G. S., and Skeens, K. M.: A 6-year climatology of cloud occurrences frequency from Stratospheric Aerosol and Gas Experiment II observations (1985–1990), J. Geophys. Res., 101, 29 407–29 429, 1996. World Meteorological Organization: Scientific Assessment of
ozone depletion, 1985, in: Global Ozone research and Monitor-ing Project, WMO Rep. 16, Geneva, 1986.
World Meteorological Organization: Scientific Assessment of ozone depletion, 1998, in: Global Ozone research and Monitor-ing Project, WMO Rep. 44, Geneva, 1999.
World Meteorological Organization: Scientific Assessment of ozone depletion, 2001, in: Global Ozone research and Monitor-ing Project, WMO Rep. 46, Geneva, 2002.
Wylie, D. P., Menzel, W. P., Woolf, H. M., and Strabala, K. I.: Four years of global cirrus cloud statistics using HIRS, J. Clim., 7, 1972–1986, 1994.