HAL Id: hal-03176191
https://hal.archives-ouvertes.fr/hal-03176191
Submitted on 22 Mar 2021HAL is a multi-disciplinary open access archive for the deposit and dissemination of sci-entific research documents, whether they are pub-lished or not. The documents may come from teaching and research institutions in France or abroad, or from public or private research centers.
L’archive ouverte pluridisciplinaire HAL, est destinée au dépôt et à la diffusion de documents scientifiques de niveau recherche, publiés ou non, émanant des établissements d’enseignement et de recherche français ou étrangers, des laboratoires publics ou privés.
Hydrogen, trace, and ultra-trace element distribution in
natural olivines
Sylvie Demouchy, Olivier Alard
To cite this version:
Sylvie Demouchy, Olivier Alard. Hydrogen, trace, and ultra-trace element distribution in natural olivines. Contributions to Mineralogy and Petrology, Springer Verlag, 2021, 176 (4), �10.1007/s00410-021-01778-5�. �hal-03176191�
Hydrogen, trace, and ultra-trace element
1distribution in natural olivines
23 4
Sylvie DEMOUCHY1,* & Olivier ALARD1,2
5 6
1Géosciences Montpellier, Université de Montpellier & CNRS, 34095 Montpellier, France. 7
2 Department of Earth and Planetary Science, Macquarie University, Sydney NSW 2109, Australia. 8
* Corresponding author: sylvie.demouchy@umontpellier.fr 9
10
Accepted to Contrib. Mineral. Petrol. 11
– March 2021 – 12
13
Cite as: Demouchy S. and Alard O. (2021) Hydrogen, minor, trace and ultra-trace elements 14
distribution in natural olivines. Contrib. Mineral. Petrol. 176, 26, 15 https://doi.org/10.1007/s00410-021-01778-5. 16 17 18 19 20 21 22 23 24
Abstract
25We investigate the coupling between H, minor, trace, and ultra-trace element incorporations in
26
17 olivines from ten different locations covering various petrological origins: magmatic,
27
hydrothermal and mantle-derived context. Concentrations in major element are determined by
28
micro X-ray fluorescence. Minor, trace, and ultra-trace element are determined by laser ablation
29
inductively coupled plasma mass spectrometry. Hydrogen concentrations are quantified using
30
unpolarized and polarized Fourier transform infrared spectroscopy (FTIR). Forsterite contents
31
(83.2 to 94.1 %) reflect the petrogenetic diversity. Hydrogen concentrations range from 0 to 54
32
ppm H2O wt. Minor element concentrations (Ni + Mn) range from 3072 to 4333 ppm, and
33
impurities are dominated by Ni, Mn, Ca or B. Total trace element concentrations range from
34
8.2 to 1473 ppm. Total rare Earth and extended ultra-trace elements concentrations are very
35
low (< 0.5 ppm). Magmatic and hydrothermal olivines show the most and least amount of
36
impurities, respectively, and mantle-derived olivines have concentrations between these two
37
extremes. Combined with minor, trace, and ultra-trace element concentrations, the hydrogen
38
concentrations and FTIR OH bands reflect the point defect diversity imposed by different
39
geological settings. Hydrogen concentrations are inversely correlated with divalent impurities,
40
indicating their competition for vacancies. However, a broad positive correlation is also found
41
between OH bands at 3575 and 3525 cm–1 and Ti, confirming the existence of
Ti-clinohumite-42
like point defect in mantle olivines. Nonetheless, Ti does not exclusively control hydrogen
43
incorporation in olivine due to the co-existence with other mechanisms, and its effect appears
44
diluted. Our results confirm that hydrogen behaves as a peculiar incompatible element, and
45
furthermore as an opportunistic impurity in olivine.
46 47
Key words: Olivine, hydrogen, minor elements, trace elements, FTIR, LA-ICP-MS.
48 49
1. Introduction
50Above absolute zero temperature, perfect minerals do not exist, all minerals contain
51
assorted atomic-scale defects in various amounts, and mostly ionic vacancies. The
52
concentration and mobility of these defects increases significantly with increasing temperature
53
(e.g., Schmalzried, 1981; Philibert, 1995; Schwartz and Lang, 2016). Furthermore, the
54
vacancies in olivine can incorporate a large range of atomic impurities covering the entire
55
chemical classification from heavy (U, Th) to light elements (H, Li, He) in ppb- to ppm-level
56
concentrations (e.g., Bell and Rossman 1992; Sykes et al. 1994; Ingrin and Skogby 2000; Kent
57
and Rosmann 2002; Burnard et al. 2015; Tollan et al. 2018; Delon et al. 2018, 201; Bussweiler
58
et al. 2019, Rasmussen et al., 2020). The atomic impurities are embedded in the crystalline
59
structure of olivine following the substitution rules from Goldschmidt’s (Goldschmidt 1926;
60
Ringwood 1955; Kröger and Vink 1956), and more complex coupled substitutions can occur
61
with increasing nonstoichiometry (e.g., Nakamura and Schmalzried 1983; Jurewicz and Watson
62
1988a, b; Berry et al., 2007a; Padrón-Navarta et al. 2014; Tollan et al. 2018). Olivine is the
63
most depleted upper mantle mineral in trace elements, thus containing significantly less trace
64
elements than in co-existing pyroxenes or garnets (e.g., Bodinier et al. 1987; Bodinier and
65
Godard 2014; Satsukawa et al. 2017; Garrido et al. 2000), therefore olivine is not the most
66
important trace element reservoir in the Earth’s upper mantle. However, olivine is the most
67
abundant (>60%) and the only interconnected mineral in the uppermost mantle, implying that
68
its rheological properties control both the viscosity of lithospheric plates and the underlying
69
convecting asthenosphere. As the viscosity of olivine-rich rock might decrease with increasing
70
incorporation of impurities such as H, Fe or Ti (e.g., Mackwell et al. 1985; Mei and Kohlstedt
71
2000; Demouchy et al. 2012; Faul et al. 2016; Tielke et al. 2017), the mechanisms of hydrogen
72
incorporation in olivine has been the focus of many experimental studies (e.g., Mackwell and
73
Kohlstedt 1990; Bai and Kohlstedt 1992; Kohlstedt et al. 1996; Kohlstedt and Mackwell 1998;
Mosenfelder et al. 2006; Withers and Hirschmann 2008; Férot and Bolfan-Casanova 2012;
75
Padrón-Navarta and Hermann 2017) for various thermodynamic conditions (e.g., pressure,
76
temperature, fO2, fH2O, aSiO2, e.g., Kohlstedt et al. 1996; Gaetani et al. 2014) and chemical
77
composition (e.g, Ti, Al, Cr, etc; Berry et al. 2007a, Tollan et al. 2019). The most recent
78
experimental approaches include doping olivine with a high amount of atomic impurity before
79
or synkinetic with hydration (e.g., Tollan et al. 2019). While these experiments highlight the
80
individual mechanism of H incorporation, these results are not always directedly applicable to
81
Earth’s upper mantle.
82
The experiments on hydrogen incorporation were completed by studies of natural
83
mantle-derived olivine specimens (e.g., Beran and Zemman 1983; Bell and Rossman 1992;
84
Berry et al. 2005, 2007b; Beran and Libowitzky 2006; Skogby 2006; Peslier 2010; Demouchy
85
and Bolfan-Casanova 2016; Xia et al. 2017) and several seminal publications have provided
86
valuable spectral databases (Miller et al. 1987; Mosenfelder et al. 2006; G.R. Rossmann,
87
http://minerals.gps.caltech.edu, or the PULI database, http://puli.mfgi.hu).
88
Despite these advances, data available on trace element incorporation in mantle-derived
89
olivine are scarce and hinders our understanding and thus prediction ability on the mobility of
90
trace elements in olivine (e.g., Demouchy et al. 2006; Mosenfelder et al. 2006; Padrón-Navarta
91
et al. 2014; Thoraval and Demouchy 2014; Satsukawa et al. 2017; Thoraval et al. 2019). Indeed,
92
the coupling of co-existing atomic impurities in olivine were often neglected, principally due
93
to technical limitations (e.g., sample preparation and mass spectroscopy detection limits; see
94
Batanova et al. 2015, 2019; Zhang et al. 2016; Bussweiler et al. 2019). However, recent
95
analytical breakthroughs have sparked and renewed interest in coupled interactions between
96
trace elements in olivine (e.g., De Hoog et al. 2010; Spandler and O’Neill 2010; Foley et al.
97
2013; Bussweiler et al. 2015; 2019; Veter et al. 2017; 2019; Neave et al. 2018). Here we assess
98
the complex point defect diversity in natural olivines by characterizing the coexistence of
hydrogen with minor, trace, and ultra-trace elements. To explore a broad range of chemical
100
compositions, we selected olivines from various geological settings.
101 102
2. Materials and Methods
103104
2.1 Olivine specimens and sample preparation 105
106
We selected 17 single-crystal olivines from ten different geological settings; most
107
specimens are from peridotite xenoliths that originated in the uppermost mantle (Table 1).
108
Three samples (harzburgite SAS20, high temperature (HT) harzburgite SAS21, lherzolite
109
SAS41) are spinel-bearing peridotites from Malaita (Ontong-Java Plateau; Demouchy et al.
110
2015) which contain olivines with low Al and different Ca contents. Samples SC and SC2018
111
are both San Carlos olivines (Arizona, USA), and LAZ is from Lanzarote (Canary Islands);
112
they are all from spinel-bearing peridotites. DMP2 and DMP4 are olivines from spinel-bearing
113
peridotites from Damaping (China). Specimen PA3 was extracted from a garnet-bearing
114
lherzolite from Pali-Aike (Chile; Demouchy, 2004) and OLM is from a very coarse-granular
115
peridotite from Olmani (Tanzania; OL10 from Baptiste et al. 2015). We have selected one
116
magmatic olivine (LR) from La Réunion (Indian Ocean). SAP is a large hydrothermal
gem-117
quality olivine from Sapat (Pakistan; see Göse et al. 2010), and samples HS and PP are from
118
the same locality but were not produced by hydrothermal processes; they are of mantle origin.
119
MYA is a hydrothermal olivine gem from Myanmar (Harlow et al. 2014). We completed the
120
data set with two centimetric gem-quality crystals (NW1 and NW2) from a metamorphosed
121
alpine-type peridotite massif in Norway; based on their chemical compositions, they are
122
hydrothermal specimens from Sandvika (see Medaris 1984) or Almoklovdalen (see Kent and
123
Rosmann 2002; Mosenfelder et al. 2006; Göse et al. 2008; their sample CIT15089 has Fo% =
93.51 – 93.76; Mosenfelder, person. comm. 14/01/2019). Samples NW1, NW2, SAP, and MYA
125
result from hydrothermal recrystallization in dunitic domains.
126
Samples were optically inspected to discard crystal sections containing macroscopic and
127
mesoscopic imperfections (e.g., spinel inclusions, lily pads, cracks, or milky or brownish
128
zonations; e.g., Mosenfelder et al. 2006). Each olivine was then cut into a millimetric right
129
prism with a rectangular base prior to in-situ chemical analyses. All faces of each prism were
130
hand-polished using a polishing jig and diamond-lapping films with grit sizes ranging from 30
131
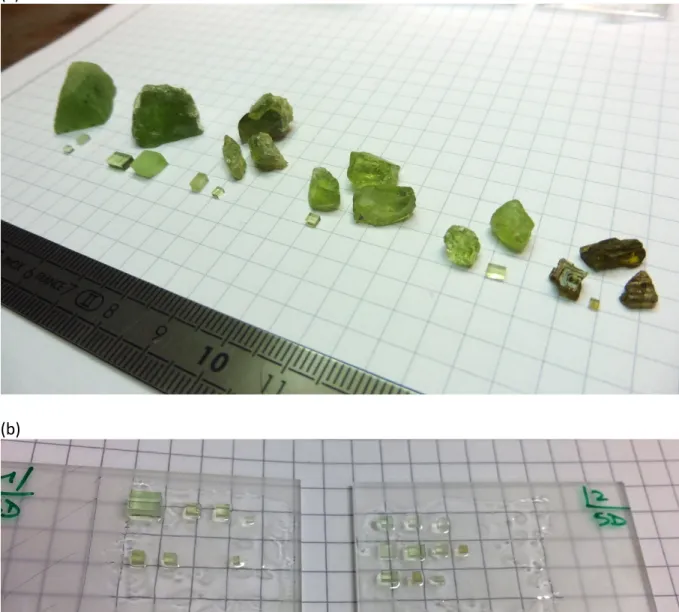
to 1 µm. The final prepared size of each olivine prism is reported in Table 1 and photographs
132
are provided in Figure S1.
133
The distribution of major and a few minor elements were determined by micro X-ray
134
fluorescence (µXRF), hydrogen concentrations by polarized and unpolarized Fourier-transform
135
infrared spectroscopy (FTIR), and minor, trace/ultra-trace element concentrations by laser
136
ablation inductively coupled plasma mass spectrometry (LA-ICP-MS). Since LA-ICP-MS is a
137
destructive method, FTIR analyses were performed first, µXRF mapping second, and
LA-ICP-138
MS last. The analytical procedures are detailed in the same order in the following subsections.
139
The olivine crystals were free of any glue for FTIR analyses, then were fixed on a glass section
140
with crystal bond for both µXRF and LA-ICP-MS measurements.
141
We emphasize that all analyses per sample were performed on the same olivine prism,
142
and not on different olivine crystals co-existing in the same xenolith/hydrothermal vein, as
143
commonly done in other studies. Past practices were constrained by analytical requirements
144
and sample preparation and lead to none negligible scatter in the data. Our approach is designed
145
to investigate consistently the control of olivine crystal chemistry on hydrogen incorporation.
146 147
2.2 Fourier-transform infrared spectroscopy 148
We analyzed hydroxyl groups in olivine using transmission FTIR spectroscopy at the
150
Laboratoire Charles Coulomb (University of Montpellier, France). Unpolarized and polarized
151
infrared spectra were acquired using a Bruker IFS66v equipped with a liquid nitrogen-cooled
152
MCT detector (Mercatel alloy, HgCdTe), a KBr/Ge beam splitter, and coupled to a Bruker
153
HYPERION microscope. The infrared beam was polarized with a KRS-5 polarizer
(thallium-154
bromide-iodide) placed between the mid-IR source and the sample. Unpolarized IR
155
measurements were performed following the protocol of Denis et al. (2015). Optically clean
156
areas were chosen for analyses, and 256 scans were accumulated at a resolution of 4 cm–1 using
157
a square aperture (100 × 100 µm). Each spectrum was baseline corrected and the absorbance
158
normalized to 1 cm thickness. Each sample was washed several times in high purity acetone
159
prior to FTIR analyses and placed on a CaF2 plate when necessary (i.e., for the smallest
160
samples). A minute amount of Fluorolube (ThermoScientificTM) was used to eliminate
161
thickness fringes if needed. The olivine prisms were not crystallographically oriented (except
162
PA3). Still we acquired polarized and unpolarized FTIR spectra along three orthogonal
163
directions, compiling two triplets of polarized spectra and one triplet of unpolarized spectra for
164
each olivine prism (all spectra triplets are provided in supplementary material in Figure S2).
165
Since NW1 and SAS20 olivine specimens were large, FTIR profile were also acquired and are
166
provided in Figure S3.
167
Two types of IR calibrations were used to calculate hydrogen concentrations: the
168
frequency-dependent calibration of Paterson (1982) and the mineral-dependent calibration for
169
olivine of Withers et al. (2012). Hydrogen concentrations were calculated by integrating each
170
spectrum over the 3620 – 3050 cm–1 wavenumber range. This calibration allows a detection
171
limit of about 1 ppm of H2O by weight (wt) for a 1mm-thick olivine sample, although the
172
estimated error from the empirical calibration of Paterson (1982) is around 30 % of the resulting
173
H concentration (e.g., Paterson 1982; Rauch 2000). Reported hydrogen concentrations are the
average of the three orthogonal unpolarized spectra or the three polarized spectra of each
175
orthogonal triplet from each olivine prism. Following the recommendations of Withers et al.
176
(2012) for unpolarized FTIR measurements of olivine, the maximum linear absorption of
non-177
normalized spectra did not exceed 0.3. Hydrogen concentrations are given in ppm H2O wt., in
178
ppm of H (equals to molar concentration), and in H/106Si to ease comparison with past studies.
179
Finally, the normalized integrated absorption area for use in future mineral-dependent IR
180
calibrations are provided in Table S1. Several spectra necessitated deconvolution to obtain the
181
integrated absorption area per peak. The best deconvolution results (i.e., the lowest residue
182
obtained for input peak positions as listed in Table 1 with ± 20 cm-1, and using a gaussian
183
function) are provided in Figure S4 for samples LR, LAZ, PA3, SAS20 and SAS41.
184
Corresponding results of the deconvolution per mechanism of hydrogen incorporation (i.e.,
185
integrated normalized absorptions and relative % compare to bulk hydrogen) are compiled in
186 Table S2. 187 188 2.3 X-ray fluorescence 189
Major and minor element distributions within each olivine prism were measured by
190
µXRF at the Department of Earth and Planetary Sciences (Macquarie University, Australia)
191
using a Bruker M4 Tornado. Because µXRF does not require extensive sample preparation or
192
coating, this technique was preferred over electron microprobe measurements. Furthermore, the
193
polish quality required for FTIR analyses (final mirror polish with <0.5 µm grid) is more than
194
sufficient for such µXRF measurements. Analyses were performed at 50 kV and 200 µA under
195
low vacuum (18 mbar). To detect compositional variability, all maps were acquired over the
196
entire sample with spot and step sizes of 20 µm. Acquisition durations ranged from 4 to 32 min
197
depending on the size of the crystal. Twelve elements were analyzed: Si, Ti, Al, Cr, Fe, Mn,
198
Mg, Ca, Na, Ni, Co and Zn. To obtain quantitative estimates, the spectra were calibrated against
an in-house standard (SCO-2 San Carlos olivine). The µXRF data compare well (i.e., within
200
errors) with electron microprobe measurements (see Table S3).
201 202
2.4 Laser ablation inductively coupled plasma mass spectrometry 203
204
Trace element analyses were performed on olivine samples by LA-ICP-MS at
205
Macquarie GeoAnalytical (Department of Earth and Planetary Sciences, Macquarie University,
206
Australia) using an Agilent 7700cs quadrupole ICP-MS system. The ICP-MS is coupled with
207
an automated laser ablation platform (Analyte G2, Photon Teledyne) equipped with a 2-volume
208
HelEx cell and housing an ArF 193 nm laser. Measurements were conducted in a He
209
atmosphere (total He flow of ~0.8 L min–1), which enhances sensitivity and reduces
inter-210
element fractionation. Numerous studies have investigated the use of additional trace gases
211
such as H2, N2, or CH4 (e.g., Guillong and Heinrich 2007; Hu et al. 2008; Scheffler and Pozebon
212
2014). Here, our in-house experiments agree with Guillong and Heinrich (2007) that the
213
addition of a few mL min–1 of H
2 (not N2) increases the sensitivity for most elements by a factor
214
of 2 to 4 (see also Veter et al. 2019). Thus, given the expected low trace element concentrations
215
of olivine, 5 mL min–1 of H
2 was added to the central line (i.e., between the ablation cell and
216
the plasma torch). The H-bearing He gas stream and particles from the sample were finally
217
mixed with Ar (~0.90 ± 0.02 L min–1) before entering the plasma with a final 30 mL mixed
218
volume. Signals were measured in time-resolved acquisition mode and each analysis lasted 300
219
s, separated by 40 s pauses between analyses. Analysis times comprised 220 s for background
220
(i.e., with the laser off), 60 s for mineral analysis (i.e., with the laser on), and 20 s for wash-out
221
monitoring. The laser was fired at an energy density of 7.2 J cm–2, a frequency of 10 Hz, and
222
using a spot size of 110 µm. Oxide levels were kept to a minimum (below 1%) and were
223
monitored using the ThO/Th ratio.
The reference glasses BHVO2-G and BCR2-G from the USGS and an in-house standard
225
SCO-1 (San Carlos olivine) were included during analytical runs to minimize matrix effects
226
(e.g., Bussweiler et al. 2019), and our measurements are within errors of the published values
227
for these international reference materials (see Table S4, e.g., Jochum et al. 2005; Bussweiler
228
et al. 2019). Elemental concentrations were calibrated against the glass standard NIST612 using
229
the values compiled by Jochum et al. (2005). Data were subsequently reduced using the
230
GLITTER software (Griffin et al. 2008) by carefully inspecting the time-resolved analyses to
231
exclude heterogeneity in the analyzed volume. Silica content (SiO2 wt.% as determined by
232
µXRF) was used as an internal standard for both reference materials and olivine samples.
233
Local backgrounds were used instead of the interpolated or averaged session
234
background. This yielded variable detection limits for the various analyses, which were
235
occasionally either lower or higher than the typical detection limit; the best, worst, and typical
236
detection limits are provided in Table S4 while standard deviations are given together with the
237
LA-ICP-MS data. Reported trace and ultra-trace elemental concentrations in olivine correspond
238
to averages of at least four ablations per olivine grain. All elements were measured in a single
239
acquisition. Due to the formation of polyatomic interferences during LA-ICP-MS analysis,
240
several isotopes were measured for key elements. Olivine matrices are rich in Mg and the
241
formation of 25Mg40Ar overlaps with 65Cu. Therefore, 63Cu was used instead, given that 23Na
242
in olivine is only a trace element. Furthermore, the excess on mass 65 is used to correct the
243
other Mg-argides on mass 64 and 66 corresponding to Zn. Similarly, the effect of oxide
244
formation on 45Sc (16O29Si, natural 29Si abundance is ca 4.68%) is corrected by deconvolving
245
the 44M/43M ratio (44M/43M=(44Ca+16O28Si)/43Ca, 27Al is a trace element in olivine and thus is
246
neglected, 28Si natural abundance is ca. 92.23%) and subtracting the weighed excess from 45M.
247
The accuracy of these corrections is ultimately assessed against certified reference glasses (e.g.
BHVO2-G and BCR2-G) and the in-house SCO-1 olivine standard. The measured isotopes
249
selected for this study are given in Table S4.
250
251
3. Results
252253
We first present concentration and distribution of the major and minor elements, then
254
hydrogen concentrations followed by the other trace and finally ultra-traces elements.The same
255
color code is used throughout the set of figures and indicates the petrogenetic origin of the
256
olivine specimens: hydrogen-rich hydrothermal olivine (SAP, NW1, NW2) in dark-blue; the
257
hydrogen-poor hydrothermal olivine (MYA) in pale-blue; the magmatic olivine (LR) in black;
258
dark-green for the garnet-bearing peridotitic olivine (PA3); high temperature spinel-bearing
259
peridotitic olivine (SAS21) in brown-green, and at last the spinel-bearing peridotitic olivines
260
(DMP2, DMP4, SC, SC2018, SAS41, SAS20, OLM, PP, HS1, LAZ) in bright green.
261 262
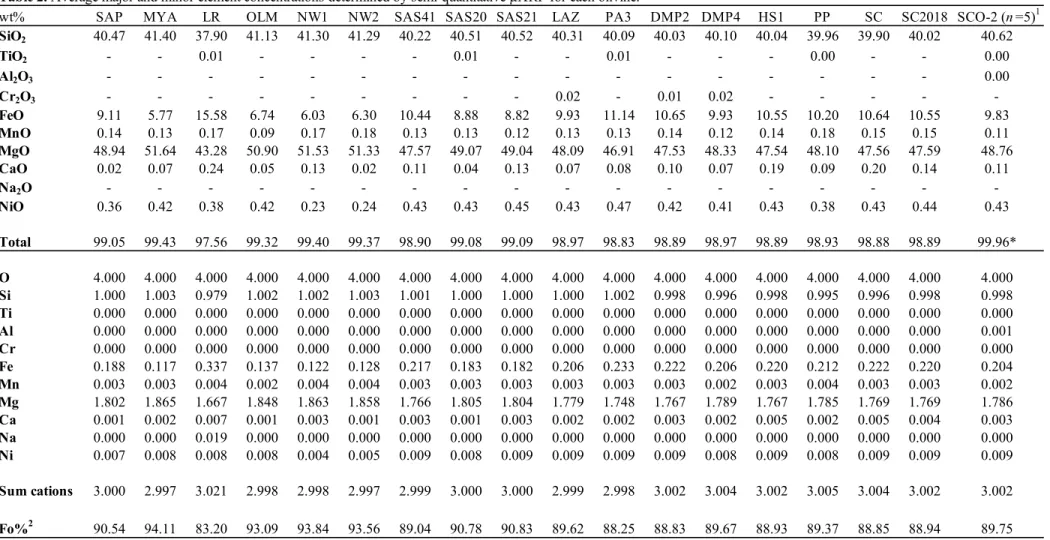
3.1 Major and minor element concentrations from X-ray fluorescence 263
264
Olivine major and a few minor element concentrations determined by µXRF are
265
reported in Table 2. FeO contents range from 5.77 to a maximum 15.58 wt.% FeO in the
266
magmatic olivine LR. Fo% (= 100 × (Mg/Mg+Fe) a.p.f.u.) range from 83.2 (LR) to 94.1%
267
(MYA) as displayed in Figure 1. Nickel (0.23–0.47 wt.% NiO) and manganese contents (0.09–
268
0.18 wt.% MnO) are typical for olivine. An additional compilation of typical Fo% vs NiO
269
values are reported in Figure S5. Calcium concentrations range from 0.02 to 0.24 wt.% CaO.
270
NaO, TiO2, Al2O3, and Cr2O3 contents are low, and fall mostly below the detection
271
limits of the µXRF. Yet, µXRF permits rapid determination of potential spatial heterogeneous
major element concentrations before FTIR and LA-ICP-MS analyses. We did not observe any
273
major or minor edge-to-edge zonings or micro-mineral inclusions or abnormal composition
274
areas in the µXRF maps of the studied prisms of olivines.
275 276
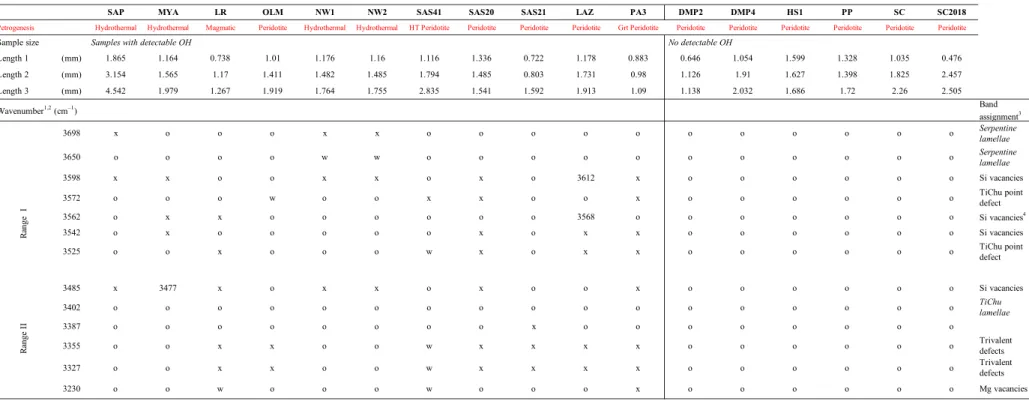
3.2 FTIR spectra and hydrogen concentrations 277
278
Unpolarized spectra obtained on crystallographically unoriented olivines are shown in
279
Figure 2. Additional polarized spectra acquired on the crystallographically oriented olivine PA3
280
are shown in Figure 3. The entire set of unpolarized and polarized FTIR spectra are given in
281
Figure S2. The FTIR spectra display several OH bands of various intensities for only 11 of the
282
17 olivines analyzed; samples from San Carlos (SC and SC2018), Damaping (DMP2 and
283
DMP4), and two of the gem olivines (HS and PP) are hydrogen-free. The wavenumbers of the
284
OH bands are reported for each sample in Table 1 and as previously reported for iron-bearing
285
olivines, for two ranges of wavenumbers (e.g., Miller et al. 1987; Kohlstedt et al. 1996; Göse
286
et al. 2010; Demouchy and Bolfan-Casanova 2016; Thoraval et al. 2019). Range 1 includes
287
wavenumbers between 3650 and 3500 cm–1 and Range 2 from 3500 to 3000 cm–1. The polarized
288
FTIR spectra of PA3 shown in Figure 3 are typical of garnet-bearing mantle peridotites (e.g.,
289
Miller et al., 1987).
290
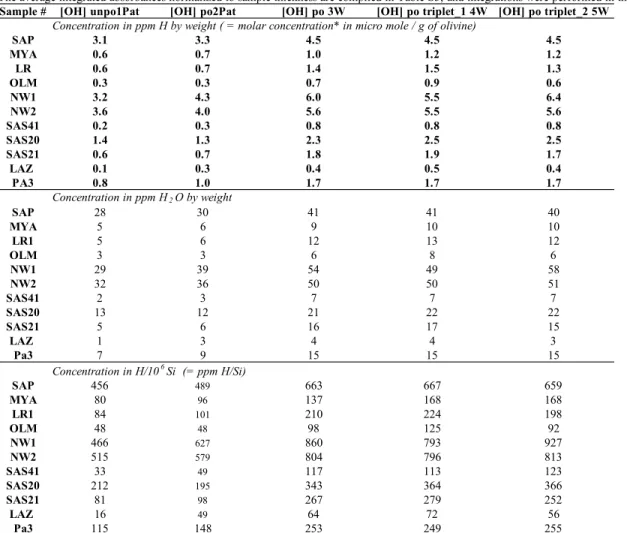
Hydrogen concentrations derived from FTIR spectra are reported in Table 3. We report
291
hydrogen concentrations determined using the calibration of Paterson (1982) for unpolarized
292
IR spectra and using the more recent mineral-dependent calibration of Withers et al. (2012) for
293
polarized IR spectra acquired along three orthogonal directions of the olivine prisms. The later
294
discussion refers only to hydrogen concentrations obtained using polarized spectra and the
295
calibration of Withers et al. (2012) (‘[OH] po W’ in Table 3). Hydrogen concentrations in
296
hydrogen-bearing olivines range from 4 (LAZ) to 54 ppm H2O wt (NW1), spanning a large
range of concentrations typical of olivines in off-craton settings (e.g., Ingrin and Skogby 2000;
298
Peslier 2010; Demouchy and Bolfan-Casanova 2016). We also measured profiles, and they did
299
not reveal special heterogeneous concentrations expect for PA3 (e.g., Figure S3), with very
300
limited edge depletion after removal of the original grain rim as illustrated in Figure 4. This
301
agrees with previous reports for olivine from this locality (Demouchy 2004; Demouchy et al.
302
2006).
303
Overall, and despite significant scatter, mantle olivines constitute a broad positive array
304
of hydrogen concentrations as a function of Fo% shown in Figure 5. Hydrothermal MYA, NW1,
305
and NW2 olivines have the highest Fo% (>93.6) but MYA has low hydrogen concentration (~6
306
ppm H2O wt, respectively) despite its high Fo%. The high hydrogen concentrations observed
307
at high Fo% contrast strongly with the H-free to low hydrogen concentrations (<10 ppm H2O
308
wt) of the low-Fo% (<90), which can be called “fertile” olivines (Fig. 5).
309 310
3.3 Minor, trace, and ultra-trace element concentrations 311
312
As the aim of this study is the decipher atomic impurities as extrinsic defect populations,
313
we have chosen to sort and group the elements first by concentration level, and second by
314
cationic valences.
315 316
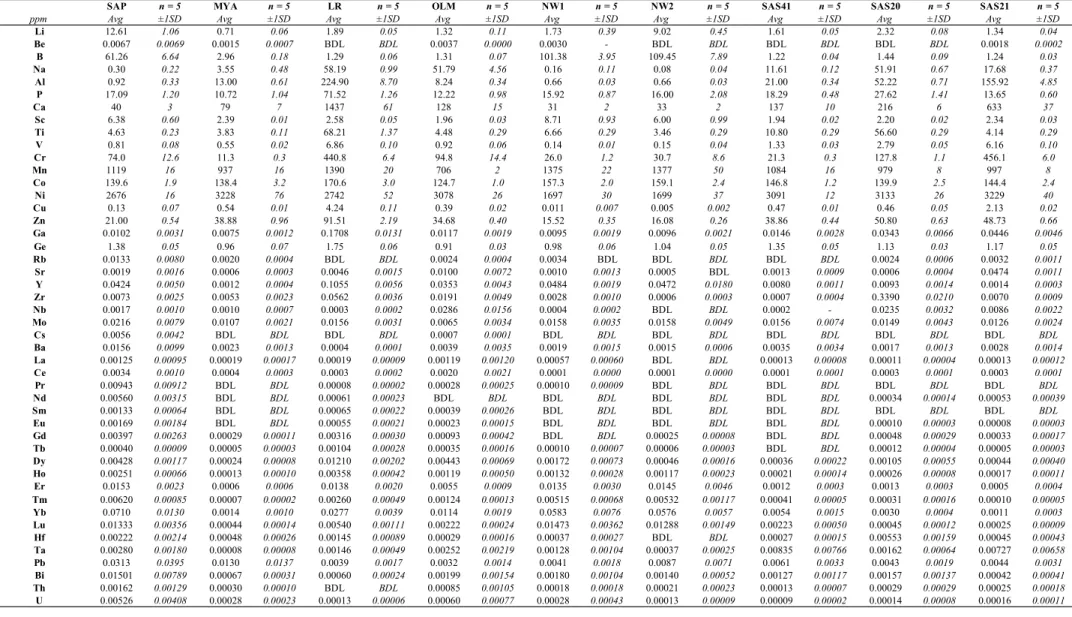
LA-ICP-MS analyses permit the quantification of a large range of minor, trace, and
317
ultra-trace element concentrations, reported in Table 4 (see Table S4 for detection limits), which
318
vary enormously between 3306 ppm Ni (LAZ) down to 0.04 – 0.05 ppb (e.g., Tb in MYA or
319
Th in DMP4, this is equivalent to 4 – 5 × 10–11 g g–1). Here we have considered that a minor
320
element has a concentration above 1000 ppm, trace elements between 1000 and 10 ppm, and 321
we introduce the low trace elements with concentrations between 10 and 0.1 ppm (i.e., two
orders of magnitude for each group) and finally below 0.1 ppm for the ultra-trace elements.
323
Several elements have very variable concentrations in olivine (e.g., Al, between 0.9 and 224
324
ppm, Cu between 0.005 and 4.24 ppm), in agreement with the different petrogeneses.
325
Furthermore, we have summarized in Table S5 the sorting and ranking of the element as a
326
function of their abundance level, which is later used for the sum of concentrations displayed
327
in Figure 6. The rare earth elements (REEs) in olivine all show concentrations below 0.1 ppm
328
and are therefore here referred to as ultra-trace elements.
329 330
3.3.1 Minor elements 331
332
The only elements present at minor levels within the entire olivine set are Ni and Mn,
333
their sum ranges from 3071 (NW1 and NW2) to 4333 ppm LAZ (Table 4). One sample has also
334
a high Ca concentration (1437 ppm Ca in LR olivine). The sums of minor elements are inversely
335
correlated with hydrogen concentrations (Figure 6a). Ni dominates the sum of the minor
336
elements in each sample, followed by Mn (706 – 1390 ppm) and to some extent Ca (31 – 1437
337
ppm). Three olivines (NW1, NW2, and SAP) have high B concentrations with values between
338
61 and 110 ppm (Table 4), thus significantly higher than the relatively constant B
339
concentrations of the other olivines (1.58 ± 0.50 ppm), but not reaching a minor element
340
concentration level. These three relatively B-rich hydrothermal olivines are characterized by
341
lower Ni (1697 – 2676 ppm) and Ca concentrations (30 – 40 ppm) than other olivines and have
342
extremely low Al concentrations (<1 ppm).
343
The different petrological groups (color coded) are well recognized in Figure 6, but we
344
can further define groups I, II, and III, notably in Figure 6b (i.e., area surrounded by the grey
345
dashed lines). Group-I includes hydrogen-rich hydrothermal olivines (NW1, NW2, and SAP),
346
and poor in minor elements. Group-II comprises the minor-element-rich olivines with moderate
to high H contents (PA3, SAS20, SAS21, and LR). Finally, group-III with the H-poor to H-free
348
olivines (DMP, OLM, LAZ, SC, and the H-poor hydrothermal olivine MYA).
349 350
3.3.2 Trace, low-trace and ultra-trace elements 351
LA-ICP-MS analyses yield elements at low (ppm level) to very low concentrations (ppb
352
level) in olivine (Table 4). The total combined concentration of trace, low trace and ultra-trace
353
impurities as a function of hydrogen concentration per sample ranges from 312 to 1496 ppm
354
(presented by level of concentration in Fig. 6b, c and d). There is an inverse relationship
355
between the sum of trace element and H concentration in olivine as illustrated in Fig. 6b, within
356
each group.
357
One can notice graphically that groups-I and II are in prolongation of each other and
358
that group III is shifted down in H concentration compared to groups I and II. The low-H
359
hydrothermal olivine (MYA) also aligns with the sp-lherzolite olivine of group III. The olivine
360
most enriched in trace elements is magmatic olivine LR (Table 4), and those with the lowest
361
trace element contents are the hydrothermal samples (SAP, NW1, NW2, MYA). The groups I,
362
II and III are further confirmed by trace to trace element concentrations (H excluded, B versus
363
Li, Cr versus B; Ti versus Cr/Na; Ti versus V; Cr versus V, Cr versus Al, Li versus P) as
364
illustrated in Figures S6 and S7.
365
The total concentration of ultra-trace impurities per sample ranges from 0.07 to 0.45
366
ppm (Table 4) and are shown in Figure 6d. While we previously identified three groups (I, II,
367
and III), the REE concentrations for all samples are extremely low and the distribution
368
according to those groups is not as clear as in Fig. 6b; the sum of REE contents per sample
369
varies between 4 and 140 ppb (Table 4). However, if the four hydrothermal B-rich olivines and
370
the magmatic olivine LR are discarded, this range is reduced to 4 - 31 ppb. Although MYA
371
(highest Fo% = 94.11) shows the lowest REE content and (Yb)PM value (here, the subscript
‘PM’ indicating normalization to the primitive mantle value; McDonough and Sun, 1995).
373
Overall, the summed REE concentrations in the olivines appear uncorrelated to Fo% and other
374
divalent impurities.
375
REE patterns and Th concentrations are reported normalized to primitive mantle values
376
(McDonough and Sun, 1995) in Figure 7. Except for four samples, the olivine REE patterns are
377
broadly similar. These four exceptions are the three H-rich hydrothermal olivines (NW1, NW2,
378
SAP) and the magmatic olivine LR. These peculiar olivines are characterized by much higher
379
heavy-REE contents ((Yb)PM = 0.16 for SAP) than the other olivines (e.g., (Yb)PM = 0.011for
380
SC2018). Furthermore, the REE patterns of SAP and LAZ are similar in shape, i.e., less
381
depleted in light-REEs (Ce/Yb = 0.778 for LAZ) than the other olivines (on average, Ce/Yb =
382
0.085 ± 0.090). The remaining olivines have REE patterns characterized by a steady, negatively
383
sloped heavy-REEs to middle REE patterns (Yb/Gd)PM = 0.81) and enrichments of Th and La
384
relative to Ce ((La/Ce)PM = 0.387 for SC2018). Large ion lithophile elements (LILEs: Sr, Rb,
385
Ba, U), Ce, and Th show relatively similar patterns and abundances in all olivines, including
386
the four anomalous specimens mentioned above. For instance, U contents are relatively high
387
((U/Th)PM > 1), whereas Rb is systematically enriched relative to Ba ((Rb/Ba) > 1.4 for SAS20).
388
All olivines show negative Sr anomalies relative to Pr or Nd. The behavior of high field strength
389
elements (HFSEs: Ti, Zr, Hf, Nb, Ta) relative to the REEs is much more variable. Overall,
390
HFSEs do not form negative anomalies relative to their neighboring REEs, except occasionally
391
for Zr, and either follow the continuity of the REE pattern or produce marked positive
392
anomalies. Although REEs occur in very low concentrations in olivine, hydrogen is not as
393
depleted as La and Ce. Also seen in Figure 7, the ultra-trace element patterns of mantle-derived
394
olivines (i.e., excluding those of hydrothermal and magmatic origins) are quite similar among
395
the analyzed specimens, and are mostly irrespective of petrological contexts (e.g., melting and
396
metasomatic indexes). The relative consistency of ultra-trace element concentrations and
fractionations in olivine, whatever the geological setting and trace element concentration of the
398
coexisting phases (e.g., pyroxenes), have been previously observed by Bedini and Bodinier
399
(1999) and Garrido et al. (2000). Our results further confirm that the incorporation of these
400
elements (REEs, HFSEs, ± LILEs) into mantle olivine is governed by olivine crystallography.
401
Thus, incorporation is limited by vacancy population and concentrations, and not by the
402
chemical compositions of coexisting phases or past percolating melts and fluids.
403 404
3.4 Distribution by valence and relationship with H 405
406
Point defect theory accounts for mass conservation, the respect of crystallography (i.e.,
407
site balance) and electroneutrality (i.e., charge balance) to minimize defect energy. Therefore,
408
atomic impurities are ‘aware’ of each other and should further be decrypted as a function of
409
their valence. In the past, mechanisms of hydrogen incorporation were successfully decrypted
410
as a function of the occupied vacancies (V), which is limited to 𝑉"#$$$$and 𝑉
%&$$ (using
Kröger-411
Vink notation, Kröger and Vink, 1956), and to possible mere interstitial proton (ℎ#∙ ). In
412
addition, two mechanisms of coupled (or associated) point defect were identified between
413
trivalent and hydrogen (e.g., Fe3+, Cr3+, Mackwell and Kohlstedt 1990; Tollan et al. 2018) and
414
between titanium and hydrogen (the so call Ti-clinohumite-like point defect, e.g., Berry et al.
415
2005). The established hydrogenated point defect and their matching IR bands are already given
416
in Table 1. Occupancies of H in 𝑉"#$$$$ is attributed to IR bands at 3598, 3562, 3542, and 3485
417
cm-1, without information on the number of H inside the tetrahedron. Occupancies of H in 𝑉
%&$$
418
is attributed to 3230 cm-1, again without information on the number of H inside the octahedron
419
(e.g., Berry et al., 2007). Hydrogen coupled to trivalent impurities yields IR bands at 3355 and
420
3327 cm-1 (e.g., Berry et al. 2007, Blanchard et al. 2017; Tollan et al. 2018). At last, hydrogen
421
in 𝑉"#$$$$ balanced by Ti in 𝑉
%&$$ yields IR bands at 3572 and 3525 cm-1. Therefore, hydrogen
mechanisms of incorporation can be inferred by ‘reading’ an infrared spectrum with this
423
framework of four mechanisms. Nevertheless, in the experimental studies, hydrogenation under
424
water saturation was preceded by doping of the olivine lattice with large amount of one type of
425
atomic impurity (Berry et al. 2005, 2007, Padrón-Navarta et al. 2014) and for a given restricted
426
set of thermodynamic conditions (fO2, fH2O, aSiO2), which is not necessarily relevant for the
427
entire upper mantle but for a specific context only (e.g., for subduction, Padròn-Navarta and
428
Hermann, 2017).
429
Below we report the distribution of hydrogen as a function of the valence of co-existing
430
impurities for concentration levels found in natural olivine specimens. From now on, element
431
concentrations are presented in molar concentration (in micromol/g) to better assess associated
432
point defects. The sum of monovalent, divalent, trivalent, tetravalent and pentavalent as a
433
function of hydrogen concentration in ppm of hydrogenby weight are also provided in Figure
434
S8.
435
Monovalent distribution is dominated by Li and Na, they are presented individually and
436
as a sum in Figure 8. No major Li variation as a function of hydrogen is observed in most of
437
the olivines, except for the hydrogen-rich hydrothermal samples (NW1 or NW2), which display
438
high Li and low Na concentrations. In the contrary, Na distribution is more variable from very
439
poor (0.08 ppm Na in NW2) to high (58.1 ppm Na in LR and 63.7 ppm Na in PA3).
440
Divalent distribution is dominated by Ni, Mn, Ca and was already identified in Figure
441
6a and 6b. Since the concentration level of Ni is very high compared to other divalent
442
impurities, the negative correlation observed on Figure 6a is not perturbated by the addition of
443
other metal-like divalent impurities. However, if nickel is excluded, the sum of divalent
444
elements is not strikingly negatively correlated (Fig. S8).
445
The sum of trace trivalent distribution (B, Al, Cr, Sc and V) is very different if we
446
compare the hydrothermal olivines from the others olivines as shown in Figure 9. The mantle
olivines and LR olivine are presented together in Figure 9a and b and the hydrothermal olivines
448
in Figure 9c. If the IR bands attributed to hydrogen - trivalent complex defects (3355 and 3327
449
cm-1) are only considered, the mantle-derived olivines display a positive correlation (R2 = 0.83).
450
A similar distribution is observed for most of the trivalent impurities, including the sum of
451
REEs as shown in Figure 9b. Note that B (1.16 – 2.18 ppm or 0.11 – 0.2 micromol/g) and Sc
452
(5.83 – 9.5 ppm or 0.13 – 0.21 micromol/g) do not show such a clear relationship, as they have
453
a limited range of concentrations when compared to other trivalent elements (one or more order
454
of magnitude for Cr, Al and V). The magmatic olivine (LR) is singled out by its high
455
concentration in trivalent elements, which was also observed for the other atomic impurities.
456
The sum of the concentration of main trivalent elements (B+Al+Sc+Cr+V) as a function
457
of bulk hydrogen concentration for the hydrothermal olivines is shown in Figure 9c and displays
458
positive correlation (R2 = 0.98), which is also visible if only B is considered, even if the
459
correlation is not as good as for the sum of trivalent elements. For the hydrothermal olivines,
460
the mechanism of coupling is likely to involve B siting into 𝑉"#$$$$ and two H in 𝑉 %&$$ as
461
previously suggested by Sykes and Rossmann (1994) to lead to *2𝐻%&× 𝐵 "#$ 𝑂0×1
$
complex
462
defect, but which is not electronically balanced. It can also lead to a simplified defect suggested
463
by e.g., Christ (1965) with *2𝑀𝑔%&× 𝐵
"#$ (𝑂𝐻)0∙ 1 ×
even if the complete substitution (for every Si
464
atomic) is not realistic in these olivines. Unfortunately, our hydrothermal olivines do not permit
465
to make a distinction between these two different complex point defects.
466
Lastly, the quantification of Fe3+ in olivine remains a true challenge (below Mössbauer
467
spectroscopy detection limits, e.g., 100 ppm e.g., Duba et al. 1973), and we could regrettably
468
not discuss the distribution of Fe3+ as a function of hydrogen in this study.
469
Tetravalent impurities, and in particular Ti, were the subject of specific attention as Ti
470
is responsible for the striking high intensity bands at 3575 and 3525 cm-1 (e.g., Berry et al.
471
2005), in a majority of mantle-derived olivines (Fig. 2). The titanium clinohumite-like point
defect is defined as a Ti4+ ion occupying a Mg vacancy and two H+ ions occupying a Si vacancy
473
(Berry et al. 2005, 2007b; Walker et al. 2007; Padrón-Navarta et al. 2014; Padrón-Navarta and
474
Hermann 2017). It is noted *𝑇𝑖%&∙∙ (2𝐻) "# $$𝑂
0×1 ×
in Kröger-Vink notation or abbreviated as
[Ti-475
2H]. Nevertheless, for our data set there is no striking positive correlation between the bulk
476
mineral hydrogen concentration and Ti concentrations in the studied olivines (Fig. S8). Only
477
six of the analyzed olivine samples (OLM, SAS20, SAS41, Pa3, LR and LAZ, see Table 1)
478
displayed the typical OH bands attributed to the [Ti-2H] defect (3575 and 3525 cm-1). However,
479
if we only consider the hydrogen associated with these IR bands, a slightly positive correlation
480
is seen in Figure 10a (R2=0.65) (i.e., deconvolution results are given in Fig. S4; integrated
481
normalized absorptions and % relative to bulk hydrogen concentrations are detailed in Table
482
S2). We added in Figure 10b typical Ti range of concentrations reported in mantle-derived
483
olivines (see also Fig. 2 in Foley et al., 2013). We compare our results with FTIR results from
484
doping experiments (Faul et al. 2016; Padròn-Navarta and Hermann 2017, Tollan et al. 2018)
485
and from mantle-derived olivines (Schmaedicke et al. 2013; Demouchy et al. 2015; Denis et al.
486
2018), which were all reprocessed accordingly to the methodology used here to obtain the
487
normalized integrated absorbance for the [Ti-2H] defect only. We converted the concentration
488
in micromole/g to better evaluate the potential coupling between hydrogen and titanium in
489
Figure 10c. The results are far from the expected 1:2 line (at saturation), but closer to a 1:1
490
coupling. Note that error bars from Padròn-Navarta et al. (2014) are very large since titanium
491
concentrations were obtained by electron microprobe and not LA-ICP-MS; We also wish to
492
point out the non-negligible impact of the choice of the IR calibration (Bell et al. 2003 versus
493
Withers et al. 2012) as illustrated by Figure 10c. We reiterate that such a positive correlation
494
does not hold when considering the bulk (total) hydrogen contents. This discrepancy shows that
495
even if the [Ti-2H] defect is a significant mechanism for hydrogen incorporation in mantle
496
olivine, it is not dominant enough to overcome the other mechanisms (see Table S2). We thus
conclude that the diversity of hydrogen-decorated point defects dilutes the effect of complex
498
defect with Ti.
499
To assess how our olivines match current Ti data, we further compare our results with
500
mantle and magmatic compositions from the literature for Ti and Ca in Figure 11 as these trace
501
elements are commonly used together as a petrogenetic indicator (e.g., O’Reilly et al., 1997;
502
Foley et al., 2013). This figure demonstrates that mantle-derived olivines have low Ti (<100
503
ppm) and Ca concentrations (<1000 ppm). Conversely, Ti- and Ca-rich compositions are typical
504
of magmatic olivines (e.g., sample LR). Hence, Figure 11 provides a framework for further
505
doping experiments to properly assess the potential impact of non-divalent minor elements such
506
as Ti when co-existing with various divalent cations (e.g., Ni, Ca, Mn) in lithospheric olivines.
507
The most abundant pentavalent impurity (phosphorous, Fig. S8d) has a similar
508
concentration level to monovalent and titanium, but a distribution similar to trivalent elements,
509
except for the high temperature (HT) harzburgitic olivine, which is one of the poorest olivine
510 in P. 511 512
4. Discussion
513 5144.1 Potential impact of hydrogen loss 515
516
Only one of the selected olivine samples originally displays a heterogeneous hydrogen
517
distribution (PA3, Fig. 4), which was interpreted as resulting from partial dehydration by
518
diffusion during magma ascent towards the surface (Demouchy et al. 2006). Other studies have
519
reported similar dehydration profiles in olivines and pyroxenes (Peslier and Luhr 2006; Wade
520
et al. 2008; Lloyd et al. 2012, 2017; Denis et al. 2013; Peslier et al. 2015; Tian et al. 2017;
521
Denis et al. 2018). However, after more than a decade, we must face the paucity of olivines and
pyroxenes presenting such heterogeneous hydrogen distributions, which are also never coupled
523
with other minor/trace element spatial heterogeneities. Furthermore, despite the fast hydrogen
524
diffusivities obtained experimentally (Mackwell and Kohlstedt 1990; Demouchy and Mackwell
525
2006), natural olivine crystals ubiquitously contain remnant traces of hydrogen. In this study,
526
we assume that the remnant hydrogen accurately represents the energetically favorable
long-527
term hydrogen-decorated point defects and their diversity. We emphasize that additional
528
hydrogen-decorated defects may be present in the olivine lattice at depth, but not preserved
529
during magma ascent (e.g., Kempf and Hermman 2018; Tollan et al. 2018), hence we do not
530
consider them as reliable long-term mechanisms of hydrogen storage.
531 532
4.2 Effects of temperature and pressure 533
Because the incorporation of minor elements in mantle minerals is a function of
534
thermodynamic parameters (mostly temperature, pressure, and possibly oxygen fugacity)
535
several minor elements have been used as reliable geothermobarometers to estimate
536
equilibrium conditions in upper mantle rocks. For example, Ca exchange between ortho- and
537
clino-pyroxene or Ca in orthopyroxene (Ca-in-opx) is a function of temperature (e.g., Wells
538
1977; Boyd and Nixon 1978; Ellis and Green 1979; Brey and Kohler 1990) and aluminum
539
incorporation in olivine or pyroxene is a function of pressure (e.g., Stalder 2004; Férot and
540
Bolfan-Casanova 2012; Coogan et al. 2014; Bussweiler et al. 2017; D’Souza et al. 2020). In
541
particular, the Ca-in-opx geothermometer (Brey and Kohler 1990) has been widely used to
542
constrain the equilibrium temperature of mantle xenoliths (based on the fact that Ca
543
concentration increases in orthopyroxenes and decreases in olivine with increasing temperature;
544
e.g., O’Reilly et al. 1997), and to help constrain the pressure/depth of origin. Nevertheless, the
545
uncertainties on pressure remains most of the time very high for spinel-bearing peridotites (± 1
546
GPa and ± 100 °C; Brey and Kohler 1990). Nonetheless, in the absence of a better (absolute)
geothermobarometer, its usage quickly became the norm until recently (e.g., Wan et al. 2008;
548
Bussweiler et al. 2017; D’Souza et al. 2020). Combined with this geothermobarometer, the
549
maximum and minimum hydrogen concentrations in mantle-derived olivines display a striking
550
increase with increasing temperature as seen along a geotherm (Costa et al. 2010; Peslier et al.
551
2010; Demouchy and Bolfan-Casanova 2016; Peslier et al. 2017). This agrees with the
552
experimentally-determined control of water fugacity on hydrogen incorporation with increasing
553
pressure under water-saturation (Kohlstedt et al. 1996; Hirschmann et al. 2005; Mosenfelder et
554
al. 2006; Bali et al. 2008; Férot and Bolfan-Casanova 2012; Gaetani et al. 2014; Padrón-Navarta
555
and Hermann 2017). However, in naturally hydrated mantle olivines, this positive correlation
556
might not be that straightforward and could be indirect. Here, we examine the possible
557
correlation between hydrogen and Ca concentrations from this study and from mantle-derived
558
olivines in Figure 12 (Demouchy 2004; Moselfelder et al. 2006; Grant et al. 2007; Falus et al.
559
2008; Li et al. 2008; Yang et al. 2008; Peslier et al. 2010, 2012; Denis et al. 2013, 2015, 2018;
560
Soustelle et al. 2013; Demouchy et al. 2015, 2019; Satsukawa et al. 2017). Hydrogen
561
concentration broadly increases with decreasing Ca concentration in olivine in group III
562
confirming that the two species compete for M-site vacancies with increasing temperature (or
563
depth). The three hydrothermal olivines of Group I do not show the same trend. The olivines
564
from Group II do not show a well-defined correlation as for group III, and the horizontal spread
565
is dragged by the composition of the magmatic olivine LR. We recall here that magmatic
566
olivines (e.g. LR) are highly defective as the Fe-enrichment, resulting from crystallization in a
567
Fe-rich magma, enhances nonstoichiometry (e.g, Nakamura and Schmalzried 1983), thus
568
vacancy concentration, and consequently incorporation of atomic impurities such as Ca is easier.
569
Nevertheless, if the magma is far to be water-undersaturated (e.g., water-fugacity is low at
570
shallow depth), it cannot lead to a concomitant high incorporation of hydrogen, thus hydrogen
571
will be at odd with the other atomic impurities in magmatic olivines. To resume, while
magmatic olivines will have a high capacity to host H, ultimately the concentration of H in
573
these same olivines will depend on the water fugacity in the magmatic system.
574 575
4.3 Co-existence of complex hydrogenated point defects 576
The identification of a dominant and unique mechanism of hydrogen incorporation in
577
olivine relevant to Earth’s mantle conditions has been the subject of important consideration.
578
Early experimental studies established the important role of M-site vacancies in hydrogen
579
incorporation (Beran and Putnis 1983; Kohlstedt et al. 1996; Bali et al. 2008; Férot and
Bolfan-580
Casanova 2012; Gaetani et al. 2014). Experimental studies have now clearly documented
581
increased hydrogen incorporation in minor- and trace-element-doped crystals. Furthermore, the
582
strategic role of Ti and its association with H incorporation into Si vacancies (the titanium
583
clinohumite-like point defect) is now well established. Here, the Figures 2, 6a, 9, 10 and Table
584
S4 clearly show that the integrated OH bands for [Ti-2H] are the most intense OH bands in
585
FTIR spectra for mantle olivines. Despite this, integrated OH bands for [Ti-2H] do not
586
exclusively control the bulk H concentration and thus cannot be used a distinctive proxy for the
587
bulk hydrogen concentration in olivine for water under-saturated conditions compared to the
588
three other mechanisms of hydrogen incorporation (𝑉"#$$$$, 𝑉
%&$$ and coupling with trivalent
589
impurities). Nevertheless, the sum of the hydrogen concentration linked to the four mechanisms
590
of incorporation seem to hold true as shown in Figure 13. Indeed, excluding three olivines from
591
group II (magmatic LR, garnet-bearing lherzolite and the HT harzburgite), olivine forms a
592
linear positive correlation parallel to the 1:1 line. Furthermore, if we take into consideration the
593
entire population of atomic impurities in mole per gram of olivine the sum of trivalent
594
impurities (B+Al+Cr+Sc+V= 1.14 to 17.2 µmol/g) dominates the sum of monovalent
595
(H+Li+Na =1.07 to 6.86 micromol/g), which is above pentavalent (e.g., phosphorous, 0.35 to
596
2.31 micromol/g) and the most abundant tetravalents elements (Ti+Ge = 0.09 to 1.14) as shown
in Figure S9. Then, hydrogen would mostly likely form complex associate-defect with trivalent 598 in natural olivines. 599 600 601
5. Conclusions
602The incorporation of minor, trace, and ultra-trace elements into atomic-scale defects has
603
been used as a petrogenetic indicator of magmatic and mantle processes (e.g., Foley et al. 2013).
604
Here, based on our study of olivine crystals from ten different geological localities, we draw
605
the following conclusions. (1) The diversity of hydrogen-decorated point defects is associated
606
with a large range of minor and trace elements. Nevertheless, no single impurity seems to
607
control the bulk incorporation of hydrogen in olivine. Furthermore, the effect of titanium
608
clinohumite-like point defects appears diluted once bulk hydrogen concentrations are
609
considered in mantle-derived olivines. (2) Incorporation of these elements (REEs, HFSEs, ±
610
LILEs) into mantle olivine appears to be governed by olivine crystallography. This is limited
611
by vacancy population and concentrations for a given temperature, and not by the chemical
612
compositions of coexisting phases or percolating melts and fluids. (3) Although REEs occur in
613
very low concentrations in olivine, olivine is not as depleted in H as in La and Ce, probably due
614
to difference in their valence.
615
The geochemical affinity of hydrogen appears inconsistent, a peculiarity which is
616
probably related to its small ionic radius, the increasing vacancy population in olivine with
617
increasing temperature (and then depth), the diversity of complex defects, and the very fast
618
diffusivity of hydrogen in olivine relative to other minor/trace elements (e.g., fast to reach new
619
equilibrium). This observed behavior could be explained by a late incorporation of hydrogen
620
into olivine, with hydrogen filling all persisting vacancies in the olivine lattice (e.g., post-partial
621
melting, post-metasomatism). Thus, H is offered a large range of sites of storage, and can be
categorized as a versatile and opportunistic atom; H can be seen as a cuckoo element using
623
whatever atomic spaces which remain available.
624
As a consequence
,
targeting a single controlling mechanism of hydrogen incorporation625
into olivine using natural specimens might be in vain. Solubility laws based on high-pressure
626
and high-temperature effects seem to remain the best approach, despite an inclination toward
627
over-doped and over-simplified incorporations of atomic impurities in experimental charges.
628
Furthermore, in ‘cold’ geological domains (e.g., subducted slabs, crustal and metamorphic
629
settings), the mechanisms of hydrogen incorporation might be overall different and more
630
complex than in mantle-derived contexts. This necessitates new and complex experimental
631
approaches to understand the role of co-existing atomic impurities in the mechanisms of
632
hydrogen incorporation and mobility in olivine as a function of the miscellaneous sites of
633 storage. 634 635 Acknowledgements 636
CNRS supported this study through INSU Tellus program 2019 awarded to S.
637
Demouchy and a Future Fellowship (FT150100115) from Australian Research Council
638
awarded to O. Alard. The authors thank Dr. D. Mainprice and Dr. A. Ishikawa for the re-use of
639
selected olivine crystals. S.D. thanks J.-A. Padròn-Navarta and C. Thoraval for constructive
640
discussions, Dr. T.D. Murphy and Dr. Y. Gréau at Macquarie University for their help and
641
precious time on the Bruker M4 Tornado and L. Gorojovsky who improved the spelling and
642
grammar of this manuscript. The IR-Raman technological Platform of University of
643
Montpellier is acknowledged for the vibrational experiments. This is publication XXX of CCFS
644
- Macquarie University.
645 646
Availability of data and material
All raw data are available upon request to the corresponding author.
648 649
References
650
Aines R. D. and Rossman G. R. (1984) Water in minerals? A peak in the infrared. J. Geophys. Res. 89 651
(B6), 4059–4071. 652
Bai Q. and Kohlstedt D. L. (1992) Substantial hydrogen solubility in olivine and implications for 653
water storage in the mantle. Nature 357, 672–674. 654
Bali E., Bolfan-Casanova N. and Koga, K. (2008) Pressure and temperature dependence of H 655
solubility in forsterite: an implication to water activity in the Earth interior. Earth Planet. Sci. 656
Lett. 268, 354–363.
657
Baptiste V., Tommasi A., Vauchez A., Demouchy S. and Rudnick, R.L., (2015) Deformation, 658
hydration, and anisotropy of the lithospheric mantle in an active rift: constraints from mantle 659
xenoliths from the North Tanzanian Divergence of the East African Rift. Tectonophysics 639, 660
34–55. 661
Basch V., Rampone E., Crispini L., Ferrando C., Ildefonse, B. and Godard, M., (2018). From mantle 662
peridotites to hybrid troctolites: Textural and chemical evolution during melt-rock interaction 663
history (Mt. Maggiore, Corsica, France). Lithos 323, 4–23. doi:10.1016/j.lithos.2018.02.025 664
Batanova V.G., Sobolev A.V. and Kuzmin D.V., (2015) Trace element analysis of olivine: High 665
precision analytical method for JEOL JXA-8230 electron probe microanalyser, Chem. Geol. 666
419, 149-157. 667
Batanova, V.G., Thompson, J.M., Danyushevsky, L.V., Portnyagin, M.V., Garbe Schönberg, D., 668
Hauri, E., Kimura, J.I., Chang, Q., Senda, R., Goemann, K., Chauvel, C., Campillo, S., Ionov, 669
D.A. and Sobolev, A.V. (2019). New Olivine Reference Material for In SituMicroanalysis. 670
Geostand Geoanal Res 419, 149–21. doi:10.1111/ggr.12266
671
Bell D.R. and Rossman G.R., (1992) Water in Earth's mantle: The role of nominally anhydrous 672
minerals. Science 255, 1391–1397. 673
Bell D.R., Rossman G.R., Maldener J., Endisch D. and Rauch, F. (2003) Hydroxide in olivine: a 674
quantitative determination of the absolute amount and calibration of the IR spectrum. J. 675
Geophys. Res. 108.
676
Bell D.R., Rossman G.R., and Moore R.O. (2004) Abundance and Partitioning of OH in a High-677
pressure Magmatic System: Megacrysts from the Monastery Kimberlite, South Africa. J. Petrol 678
45, 1539–1564. 679
Bedini M.R. and Bodinier J.L., 1999. Distribution of incompatible trace elements between the 680
constituents of spinel peridotite xenoliths: ICP-MS data from the East African Rift. Geochim. 681
Cosmochim. Acta 63, 3883–3900.
682
Beran A. and Libowitzky E. (2006) Water in Natural Mantle Minerals II: Olivine, Garnet and 683
Accessory Minerals. Reviews in Mineralogy and Geochemistry 62, 169–191. 684
Beran A. and Putnis A., (1983) A model of the OH position in olivine, derived from infrared-685
spectroscopy investigations. Phys. Chem. Min. 9, 57–60. 686
Beran A. and Zemman J., (1969) Üder OH-gruppen in Olivin. Österreich Akademie des 687
Wissenschaften 3, 73–74.
688
Berry A., Hermann, J., O'Neill, H.S.C. and Foran G.J., (2005) Fringerprinting the water site in mantle 689
olivine. Geology 33, 869–872. 690
Berry A., O'Neill H.S. Hermann and J., Scott, D.R., (2007a) The infrared signature of water associated 691
with trivalent cations in olivine. Earth Planet. Sci. Lett. 1-2, 134–142. 692
Berry A., Walker A.M. ,Hermann J., O'Neill H.S., Foran, G.J. and Gale, J., (2007b) Titanium 693
substitution mechanisms in forsterite. Chem. Geol. 242, 176–186. 694
Bodinier J.-L., and Godard M. (2014) Orogenic, Ophiolitic, and Abyssal Peridotites. In: Holland H.D. 695
and Turekian K.K. (eds.) Treatise on Geochemistry, 2nd Edition, v3, 103-167. Oxford: Elsevier. 696
Bodinier J-L, Guiraud M, Fabrie`s J, Dostal J, and Dupuy C (1987) Petrogenesis of layered 697
pyroxenites from the Lherz, Freychinède and Prades ultramafic bodies (Ariège, French 698
Pyrénées). Geochim. Cosmochim Acta 51, 279–290 699
Boyd F. R., and Nixon P. H., (1978) Ultramafic nodules from the Kimberley pipes, South Africa. 700
Brett R.C., Russell J.K. and Moss, S., (2009) Origin of olivine in kimberlite: Phenocryst or impostor? 702
Lithos 112, 201–212.
703
Brey G.P. and Köhler, T., (1990) Geothermobarometery in four-phase lherzolith II. New 704
thermobarometrers, and practical assessment of existing thremobarometers. J. Petrol 31, 1353– 705
1378. 706
Burnard P.G., Demouchy S., Delon R., Arnaud N.O., Marrocchi Y., Cordier P. and Addad, A. (2015) 707
The role of grain boundaries in the storage and transport of noble gases in the mantle. Earth 708
Planet. Sci. Lett 430, 260–270.
709
Bussweiler Y., Foley S.F., Prelevic D. and Jacob D.E. (2015) The olivine macrocryst problem: New 710
insights from minor and trace element compositions of olivine from Lac de Gras kimberlites, 711
Canada. Lithos, 220-223, 238–252. 712
Bussweiler Y., Brey G.P., Pearson D.G., Stachel T., Stern R.A., Hardman M.F., Kjarsgaard B.A. and 713
Jackson, S.E.,(2017). The aluminum-in-olivine thermometer for mantle peridotites — 714
Experimental versus empirical calibration and potential applications. Lithos, 272-273, 301–314. 715
doi:10.1016/j.lithos.2016.12.015 716
Bussweiler Y., Giuliani A., Greig A., Kjarsgaard B.A., Petts D., Jackson S.E., Barrett N., Luo Y., 717
Pearson D.G. (2019) Trace element analysis of high-Mg olivine by LA-ICP-MS – 718
Characterization of natural olivine standards for matrix-matched calibration and application to 719
mantle peridotites. Chemical Geology 524, 136–157. 720
Coogan L.A., Saunders A.D. and Wilson, R.N. (2014) Aluminum-in-olivine thermometry of primitive 721
basalts: Evidence of an anomalously hot mantle source for large igneous provinces. Chemical 722
Geology 368, 1–10. doi:10.1016/j.chemgeo.2014.01.004
723
Costa Rodriguez F., Dohmen R. and Demouchy S. (2010) Modeling the dehydrogenation of mantle 724
olivine with implications for the water content of the Earth’s upper mantle, and ascent rates of 725
kimberlite and alkali basaltic magmas Eos Trans. AGU, Fall Meet. Abstract V24C-06. 726
De Hoog J.C.M., Gall L. and Cornell D.H. (2010) Trace-element geochemistry of mantle olivine and 727
application to mantle petrogenesis and geothermobarometry. Chem. Geol. 270, 196–215. 728