HAL Id: hal-00316753
https://hal.archives-ouvertes.fr/hal-00316753
Submitted on 1 Jan 2001
HAL is a multi-disciplinary open access
archive for the deposit and dissemination of
sci-entific research documents, whether they are
pub-lished or not. The documents may come from
teaching and research institutions in France or
abroad, or from public or private research centers.
L’archive ouverte pluridisciplinaire HAL, est
destinée au dépôt et à la diffusion de documents
scientifiques de niveau recherche, publiés ou non,
émanant des établissements d’enseignement et de
recherche français ou étrangers, des laboratoires
publics ou privés.
A note on the interannual variations of UV-B erythemal
doses and solar irradiance from ground-based and
satellite observations
C. Zerefos, D. Balis, M. Tzortziou, A. Bais, K. Tourpali, C. Meleti, G.
Bernhard, J. Herman
To cite this version:
C. Zerefos, D. Balis, M. Tzortziou, A. Bais, K. Tourpali, et al.. A note on the interannual variations
of UV-B erythemal doses and solar irradiance from ground-based and satellite observations. Annales
Geophysicae, European Geosciences Union, 2001, 19 (1), pp.115-120. �hal-00316753�
Annales
Geophysicae
A note on the interannual variations of UV-B erythemal doses and
solar irradiance from ground-based and satellite observations
C. Zerefos1, D. Balis1, M. Tzortziou1, A. Bais1, K. Tourpali1, C. Meleti1, G. Bernhard2, and J. Herman3 1Laboratory of Atmospheric Physics (LAP), Aristotle University of Thessaloniki, 54006 Greece
2Biospherical Instruments Inc., San Diego, California 3Goddard Space Flight Center, NASA, Greenbelt, Maryland
Received: 22 May 2000 – Revised: 16 October 2000 – Accepted: 17 October 2000
Abstract. This study examines three UV-B data sets: ground-based long-term spectral records at Thessaloniki, Greece (40.5◦N, 22.9◦ E) and San Diego, California, USA (32.7◦ N, 117.2◦W) as well as a global data set of daily erythemal dose obtained from the Total Ozone Mapping Spectrometer (TOMS) onboard the Nimbus-7 satellite. Both ground-based stations have long enough records of spectral UV-B mea-surements to allow independent time series analyses. For 63◦ solar zenith angle (SZA) and clear sky conditions the quasi biennial oscillation (QBO) effect in solar irradiance at 305nm E305is about 32% of the annual cycle for both San Diego and Thessaloniki. The effect slightly increases with cloud cover of up to 4/8, and decreases thereafter for cloud cover greater than 4/8. The data reveal that cloudiness can-not offset interannual signals in UV-B records. The observa-tions at San Diego provide an independent confirmation of the widespread nature of the QBO in UV-B, which about co-incides in amplitude at the two station studies, both located in the latitude zone 30◦– 40◦N. The peak-to-peak amplitude of the QBO in erythemal dose derived from TOMS/Nimbus-7 data is 6.5% at Thessaloniki. This is similar to the values calculated from ground-based measurements from this sta-tion. Based on satellite data, we find that the amplitude of the QBO in the erythemal dose is almost 40% of the ampli-tude of the annual cycle only in the tropics. The ratio of the amplitudes of the QBO over the annual cycle in erythemal dose decreases towards the extratropics, becoming less than 5% over middle latitudes.
Key words. Atmospheric composition and structure (geo-chemical cycles; transmission and scattering of radiation)
1 Introduction
The quasi biennial oscillation (QBO) in the equatorial zonal wind in the lower stratosphere and its relation to the QBO in total ozone has been the subject of a number of papers (e.g.,
Correspondence to: C. Zerefos ([email protected])
Angell, 1988; Bojkov, 1987; Bowman, 1989; Gray and Pyle, 1989; Herman et al., 1991, 1999a; Zerefos, 1983; Zerefos et al., 1992; Fioletov et al., 1997). The inverse relationship between changes in total ozone and changes in solar UV-B radiation reaching the ground has been documented recently with evidence that the QBO also affects clear sky UV so-lar irradiances at Thessaloniki, Greece (Zerefos et al., 1998). Recently Udelhofen et al. (1999) performed a detailed time series analysis for the Australian continent, based on TOMS erythemal dose observations. They associated changes of UV erythemal exposure, to phases of the QBO and the so-lar activity cycles. Cabrera and Fuenzalida (1999) reported evidence of the QBO in measurements of UV solar irradiance at Santiago, Chile. Although the QBO signal in UV-B seems to be well established at some sites, the effect of various fac-tors including cloudiness and latitude on the amplitude of the QBO are not well understood. More importantly, the relative amplitude of the QBO over the amplitude of the annual cycle has not been studied on a global scale.
We study for the first time the relative importance of the QBO in solar irradiance at ground level in the presence of varying cloudiness. The study includes also latitudinal ra-tios of the amplitude of the QBO over the annual cycle in erythemal doses derived from TOMS observations between 1979–1993 (Herman and Celarier, 1998), which puts the be-fore mentioned findings in a global perspective. It should be stressed here that the erythemal dose is the most frequently used UV-irradiance measure with direct biological signifi-cance for humans.
2 Data
Measurements of spectral UV global irradiance began at the Laboratory of Atmospheric Physics (LAP) of the Aristotle University of Thessaloniki, Greece (40.5◦N, 22.9◦E, 60 m a.s.l.), in 1989 with a Brewer-MKII ozone single spectropho-tometer. This Brewer spectrometer has been in operation in Thessaloniki since 1982 taking total column ozone and
116 C. Zerefos et al.: A note on the interannual variations of UV-B erythemal doses and solar irradiance columnar SO2 measurements (Bais et al., 1993, 1996;
Zere-fos et al., 1998). The instrument records UV scans in the spectral region 290–330 nm in steps of 0.5 nm, with a spec-tral resolution of 0.6 nm and the overall accuracy of the mea-surement at 305 nm is of the order of ±5%. We used spectral UV measurements performed during the period 1990–1997.
The solar irradiance data for San Diego are acquired with a SUV-100 spectroradiometer that is part of the United States National Science Foundation’s (NSF) sponsored UV moni-toring network for polar regions (Booth et al., 1994). The instrument is located on the roof of Biospherical Instruments (32.7◦N, 117.2◦W), approximately 6 km from the Pacific coast. Its bandwidth is approximately 1 nm full-width half-maximum (FWHM) and measurements are carried out be-tween 280 and 600 nm. For this study, only spectral mea-surements at 305 nm between November 1992 and Novem-ber 1997 have been used. The different spectral resolution of the two instruments (Brewer and SUV-100) might intro-duce a small bias towards larger wavelengths, when compar-ing the results from the two instruments. However, based on various international intercomparisons of UV spectrora-diometers, this bias is considered to be small compared to the individual uncertainty of each measuring device.
In order to remove any dependence on solar elevation, only measurements at 63◦SZA have been processed for both in-struments, as this is the highest SZA that can be observed in Thessaloniki for all days of the year. Both morning and af-ternoon observations have been included. Ground-based UV measurements at San Diego were accompanied by TOMS measurements of total ozone column for the period of study (overpass data from TOMS on Nimbus-7, Meteor 3, Earth Probe). All UV measurements have been adjusted to the mean Sun-Earth distance. In addition, daily erythemal (sun-burn) exposure data derived from TOMS/Nimbus-7 measure-ments covering the period 1978–1993 have been used. These data were estimated from the daily integrated ultraviolet ir-radiance calculated using a model for the susceptibility of Caucasian skin to sunburn (erythema) (Herman and Celar-ier, 1998, 1999b; Herman et al., 1999a). The Earth-Sun distance and sunrise and sunset times, as well as the pendence of the solar zenith angle on time during a day de-pend on the latitude and time of the year, and are calculated from standard formulas. The extraterrestrial solar irradiance incident at the top-of-the-atmosphere when the Earth is at a distance of 1 A.U. from the Sun was measured over the wavelength interval of interest by the UARS/SOLSTICE in-strument (Woods et al., 1996). The weighting function used to approximate the wavelength-dependent sensitivity of Cau-casian skin to erythema-causing radiation is the model pro-posed by McKinlay and Diffey (1987), and adopted as a stan-dard by the Commission Internationale de l’ Eclairage (CIE). The calculated irradiances have been corrected for the pres-ence of clouds, based on measured radiances at 380 nm or 360 nm. It has been assumed that the cloud cover adjustment is valid throughout the day of integration, an assumption that can lead to large discrepancies between satellite estimates and ground-based measurements.
3 Results
3.1 The annual cycle
The annual cycle in total ozone calculated at Thessaloniki for the period 1992–1997 shows a peak-to-peak amplitude [i.e., (maximum value minimum value) / mean value] of 22% relative to the mean total ozone at Thessaloniki, which is 321 DU (matm-cm). For 63◦ SZA and clear-sky condi-tions the corresponding peak-to-peak amplitude of solar irra-diance at 305 nm (E305) is 63% relative to the mean of 3.34 mWm−2nm−1. The annual cycle in total ozone at San Diego has a peak-to-peak amplitude of 17% relative to the mean total ozone of 293 DU. For 63◦SZA and clear skies, the cor-responding peak-to-peak amplitude of E305, is 59% relative to the mean of 5.07 mWm−2nm−1. The difference between the amplitudes of the annual cycle of E305 in Thessaloniki and San Diego is largely the result of the 8◦latitude differ-ence, which results in a total ozone difference of about 25 DU between the two stations (e.g. WMO, 1998).
The annual cycle in total ozone, which has been calcu-lated from TOMS measurements for the period 1978–1993, has a peak-peak amplitude of 23% relative to the mean to-tal ozone at Thessaloniki. The respective amplitude at San Diego is 19%. Hence, the magnitudes of the ozone cycles calculated for the extended period 1978–1993 are closely comparable to the magnitudes derived for the shorter period 1992–1997 for which ground-based irradiance data are avail-able.
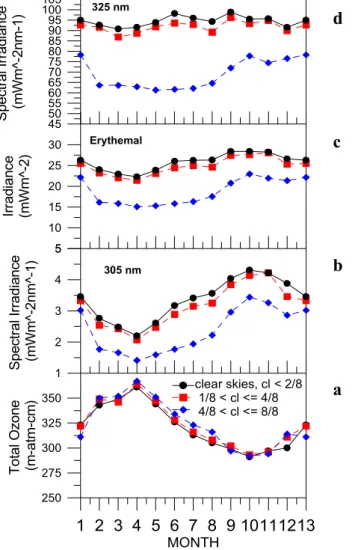
In addition to clear skies, the mean annual cycles of spec-tral solar UV irradiance under all-sky conditions have been examined for Thessaloniki in order to demonstrate the ef-fect of clouds on the annual cycle (Fig. 1). As can be seen, high cloud cover conditions significantly affect spectral irra-diances (e.g. Zerefos, 1997). At cloud cover higher than 4/8, the annual mean spectral irradiances E305and E325as well as erythemal irradiance are reduced by about 30% relative to clear skies. On the contrary at low cloud cover (<4/8), UV ir-radiance and erythemal irir-radiance do not seem to be affected significantly. In general, clouds affect the mean values of the solar irradiances examined (Estupinian et al., 1996), but are unlikely to have a significant effect on the amplitude of the annual cycle, as evidenced from Fig. 1. This is because the annual cycle for erythemal irradiance with constant SZA is mostly caused by the annual cycle in ozone amount in the stratosphere (∼15 to 40 km), well above the clouds, an ap-proximate inverse ratio of 1:1.1 is determined from Eq. (1) dE305/E305= −sec(SZA)(d/ )α , (1) where α is the ozone absorption coefficient at 305 nm, is the column ozone amount, and E is irradiance, as discussed by Herman et al. (1999b). Since attenuation of irradiance depends on cloudiness, constant cloudiness only reduces the magnitude of the irradiance, but not its relative seasonal am-plitude. The same will be true for QBO effects in ozone.
1 2 3 4 5 6 7 8 9 10111213
MONTH 250 275 300 325 350 T otal O zon e (m -a tm -c m ) 1 2 3 4 5 S pe ctr al Ir radi an ce (m Wm ^-2n m ^-1) 5 10 15 20 25 30 Ir ra di an ce (m W m ^-2) 325 nm 305 nm Erythemal 45 50 55 60 65 70 75 80 85 90 95 100 105 Sp ec tr al Ir rad ia nc e (m W m ^-2n m -1) clear skies, cl < 2/8 1/8 < cl <= 4/8 4/8 < cl <= 8/8d
c
b
a
Fig. 1. The annual cycle of (a) total ozone, (b) solar spectral irradi-ance at 305 nm, (c) erythemal irradiirradi-ance, and (d) solar irradiirradi-ance at 325 nm under different sky conditions at 63◦SZA as derived from measurements performed at Thessaloniki between November 1990 and November 1997.
3.2 The QBO
The QBO in total ozone is nearly in-phase with the 30 hPa QBO in stratospheric zonal winds at the equator and lags in phase with increasing latitude. Total ozone at 40◦N presents a phase-shift of almost eight months relative to the 30 hPa equatorial stratospheric zonal wind (e.g. Zerefos et al., 1994, 1998). The relation between the 30 hPa stratospheric equa-torial zonal winds with both total ozone and spectral solar irradiance at 305 nm is shown in Fig. 2 for Thessaloniki for various cloud cover conditions. The sensitivity of 305 nm irradiance shown in Fig. 2 to ozone change is about 3:1 (in agreement with Eq. 1).The composite of the monthly mean zonal wind at 30 hPa is derived by a superposed epoch anal-ysis (Zerefos et al., 1998) with zero lag placed at west-wind maximum. Data from the last four QBO cycles (1990–1997) were included. Applying the same analysis to the deseason-alised time series of total ozone and E305reveals the QBO
ef-Thessaloniki Total Ozone Thessaloniki
Spectral Irradiance at 305 nm
LAG time (months)
-15 0 15 -15 -10 -5 0 5 10 15 20 25 30 -10 0 10cha
nge
(
%
)
-15 -10 -5 0 5 10 15 20 25 30 -5 0 5ch
an
ge
(%
)
cl < 2/8 1/8 < cl <= 4/8 4/8 < cl <= 8/8 Zonal wind at 30 hPa Singapore(a) (b) (c)
-10 -5 0 5 10 15 20 25 30 35
Fig. 2. Composites of (a) 30 hPa zonal wind at Singapore, (b) total ozone at Thessaloniki, and (c) solar irradiance at 305 nm. The com-posites have been calculated for the last four QBO cycles (1990– 1997) and measurements correspond to all-sky conditions and a so-lar zenith angle of 63◦.
fect in these quantities, also under various cloud cover condi-tions. The appearance of a QBO in E305is evident, although the calculations have been made only for a short period. The QBO pattern is evident even when days with cloudy skies are considered in the analysis. In the latter case there is no change in the QBO amplitude of total ozone, but Fig. 2c indicates that the QBO amplitude of E305may be enhanced when partly (<4/8) cloudy skies are taken into account. This indicates that fully clouded days follow the clear-sky days more closely than partially clouded days, when the relation of UV attenuation and cloud fraction is examined. This pos-sible enhancement in the QBO amplitude, for cloud cover 1/8 to 4/8, might then be a result of a possible seasonal cloud effect taking into account the small number of QBO cycles entering the averaging and the UV irradiance enhancement for cloudiness up to 4/8 (Bais et al., 1993).
The relation between the 30 hPa stratospheric zonal winds with both total ozone and spectral solar irradiance at 305 nm are shown in Fig. 3 for Thessaloniki and San Diego, where in the latter case cloud cover conditions <4/8 are consid-ered. As it was shown above for the Thessaloniki records the QBO signal can be seen even when cloudy conditions are considered. The amplitude of the zonal anomalies of QBO
118 C. Zerefos et al.: A note on the interannual variations of UV-B erythemal doses and solar irradiance
LAG time (months)
-15 0 15Z
on
al W
ind
(m
/sec
)
Zonal wind at 30 hPa Singapore Total Ozone Spectral Irradiance at 305 nm -15 -10 -5 0 5 10 15 20 25 30 -10 0 10
ch
an
ge
(
%
)
-15 -10 -5 0 5 10 15 20 25 30 -5 0 5ch
an
ge
(%
)
Thessaloniki San Diego (a) (b) (c)-10 -5 0 5 10 15 20 25 30 35
Fig. 3. Composites of (a) 30 hPa zonal wind at Singapore, (b) total ozone at Thessaloniki (dotted line) and San Diego (solid line), and (c) solar irradiance at 305 nm. The composites have been calculated for the last four QBO cycles (1990–1997). Total ozone and irradi-ance measurements correspond to sky conditions with cloud cover
<4/8 and a solar zenith angle of 63◦.
in total ozone is about 8% at Thessaloniki, and 7% at San Diego. The ozone QBO lags the equatorial QBO in zonal wind by about seven to eight months for both sites. This was expected taking into account the geographic latitude of both sites (Zerefos et al., 1992). The peak-to-peak QBO ampli-tude in E305 is about 20% at Thessaloniki and 19% at San Diego, respectively. These results confirm, that two different well-calibrated instruments, which are located in the same latitude zone with similar exposure and climate, reveal simi-lar amplitudes of the QBO in sosimi-lar UV-B irradiances. These amplitudes are well above the uncertainty induced by any systematic or random errors of the spectral UV measure-ments. According to Bais et al. (1998) systematic errors due to the cosine response of the instrument can introduce an overall error of ±1%, while for the certain spectroradiome-ters the random errors are of the order of ±4% (Bais et al., 2000).
Tables 1 and 2 show that the amplitude of the annual cycle of E305at 63◦SZA is about three times that of ozone, while the amplitude of the QBO in E305 is about 2.5 times that of ozone, both at San Diego and Thessaloniki. A value of 3 for the Radiation Amplification Factor (RAF) (e.g. Booth
Table 1. Observed peak-to-peak amplitudes for the annual and QBO cycles of ozone and spectral solar irradiance at 305 nm and 63◦SZA at Thessaloniki and San Diego, during the period 1992– 1997 (four QBO cycles)
Annual cycle QBO cycle Thessaloniki San Diego Thessaloniki San Diego
O3 (%) 22 17 8 7
E305(%) 63 59 20 19
Table 2. Peak-to-peak amplitudes for the QBO cycles of ozone and erythemal dose at Thessaloniki and San Diego, from TOMS observations, during the period 1978-1993 (seven QBO cycles)
QBO cycle Thessaloniki San Diego
O3 (%) 6 5
Erythemal dose 6.5 5.5
and Madronich, 1994) for E305 at 63◦ SZA was expected from Eq. (1). Part of this seasonal variability, and especially while comparing two different sites, can be slightly masked or enhanced by possible seasonal variations of the aerosol loading over the measuring sites. This fact might explain the difference between the actual and expected RAF.
3.3 TOMS erythemal doses
From TOMS/Nimbus-7 data the composites for total ozone and erythemal dose have been calculated for the period of 1978-1993. This period covers seven QBO cycles. Based on the analysis of TOMS records, overpasses from Thessaloniki and San Diego show, as seen in Fig. 4, peak-to-peak QBO amplitudes in the monthly mean erythemal exposure of about 6.5% for Thessaloniki and 5.5% for San Diego. These ampli-tudes are close to those derived by Zerefos et al. (1998) for erythemal dose rate at 63◦SZA derived from ground-based measurements at Thessaloniki.
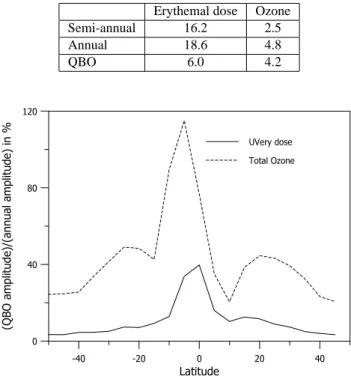
In order to quantify the relative importance of the QBO cycle with respect to the annual variation in UV erythemal dose, we calculated the peak-to-peak amplitudes of the an-nual and QBO cycles for both ozone and UV erythemal dose for different latitude zones, using TOMS data (Herman and Celarier, 1998). In Table 3 they are shown the results for the tropical belt of 5◦ S. In this table the amplitude of the
6-month cycle, induced by the semi-annual change in maxi-mum solar elevation at the equator, is also show, since over the tropics its is of equal importance to the annual cycle. Next the ratio of the QBO amplitude over the amplitude of the an-nual variation was determined. The results are shown in Fig. 5. In the tropics, the amplitude of the QBO effect to the UV erythemal doses is about 40% that of the annual variation, while at middle latitudes, where Thessaloniki and San Diego are located, it is only 5% of the annual change. The same
fig-TOMS / Thessaloniki (40.5 N) - San Diego (33)
-10
0
10
20
30
LAG time (months)
-15 0 15 30 hPa Zon a l Win d s ms e c^ -1
Ozone - Sam Diego Erythemal - San Diego
-5 0 5 Chan ge % -5 0 5 Ch ange % Erythemal - Thessaloniki Ozone - Thessaloniki (a) (b) (c)
Fig. 4. Composites of (a) 30 hPa zonal wind at Singapore, (b) total ozone at San Diego and Thessaloniki and (c) daily erythemal ex-posure at San Diego and Thessaloniki. The composites have been calculated from TOMS measurements for seven QBO cycles (1980– 1995).
ure shows for comparison the ratio of the QBO amplitude in total ozone at different latitudes over the amplitude of the an-nual variation, indicating that in the tropics, the QBO effect in total ozone can be as significant as the annual variation. This is because the annual ozone amplitude is a minimum in the equatorial zones and increases towards middle and high latitudes, while the QBO amplitude has a much smaller vari-ation with latitude.
4 Conclusions
The main results of this study can be summarized as follows: (1) The QBO effect in total ozone at Thessaloniki has a peak-to-peak amplitude of 8% during the period 1990–1997. The minimum and maximum values occur eight months after the west-wind maximum of the equatorial zonal wind at 30 hPa in Singapore. The corresponding peak-to-peak ampli-tude of E305is 20% of the mean irradiance under clear skies. Days with low cloud cover up to 4/8 have a somewhat larger QBO amplitude in E305. In the case of San Diego, the QBO in total ozone has a peak-to-peak amplitude of 7% while the peak-to-peak amplitude of E305is 19% (in agreement with the theoretical RAF). The minimum and maximum values
Table 3. Peak-to-peak amplitudes (in % relative to the mean) for the annual, semi-annual and QBO cycles of ozone and erythemal dose at the tropics (−5◦), from TOMS observations, during the period 1978-1993
Erythemal dose Ozone
Semi-annual 16.2 2.5 Annual 18.6 4.8 QBO 6.0 4.2 -40 -20 0 20 40 Latitude 0 40 80 120 (Q BO amp lit ud e)/(ann ua l am pl itude ) in % UVery dose Total Ozone
Fig. 5. Ratio of the QBO peak-to-peak amplitude relative to the amplitude of the annual cycle as a function of latitude, based on TOMS Uvery exposure estimates (continuous line) and on total ozone (dashed line).
occur about eight months after the west-wind maximum. The QBO amplitude in E305is about 32% that of the annual cy-cle both at Thessaloniki and at San Diego. Therefore inde-pendent instruments confirm the evidence of QBO in UV-B, which is even strengthened by observations reported in other studies for different areas (Udelhofen et al., 1999; Cabrera and Fuenzalida, 1999).
(2) The relative importance of the QBO cycle to the ampli-tude of the annual variation of the UV erythemal dose, was examined by the ratio of the QBO amplitude over the ampli-tude of the annual variation at the same latiampli-tude, and for dif-ferent latitude zones. In the tropics the amplitude of the QBO effect is about 40% that of the annual cycle, while at middle latitudes, where Thessaloniki and San Diego are placed, it is only 5% of the annual, decreasing with latitude. Therefore, we conclude that the biologically important erythemal dose reaching ground-level at low latitudes, has a QBO compo-nent, which cannot be overlooked, even in comparison with the amplitude of the annual cycle.
Acknowledgements. This study has been partly funded by the
Eu-ropean Union under contracts 0550 and ENV4-CT97-0623. The SUV-100 spectroradiometer in San Diego is operated and maintained under a contract from the United States National Science Foundation’s Office of Polar Programs via Antarctic
Sup-120 C. Zerefos et al.: A note on the interannual variations of UV-B erythemal doses and solar irradiance port Associates. Topical Editor Donal Murtagh thanks two referees
for their help in evaluating this paper.
References
Angell, J. K., Relation of Antarctic 100 mb temperature and total ozone to equatorial QBO, equatorial SST and sunspot number, 1958–1987, Geophys. Res. Lett, 15, 915–918, 1988.
Bais, A. F., Zerefos, C. S., Meleti, C., Ziomas, I. C., and Tour-pali, K., Spectral measurements of solar UVB radiation and its relations to total ozone, SO2, and clouds, J. Geophys. Res., 98, 5199–5204, 1993.
Bais, A. F., Zerefos, C. S., and McElroy, C. T., Solar UVB measure-ments with the double- and single-monochromator Brewer ozone spectrophotometers, Geophys. Res. Lett., 23(8), 833–836, 1996. Bais, A. F., Kazadzis, S., Balis, D. S., Zerefos, C. S., and Blumthaler, M., Correcting global solar UV spectra recorded by a Brewer spectroradiometer for its angular response error, Appl. Optics, 37, 27, 6339–6344, 1998.
Bais, A. F., Gardiner, B. G., Slaper, H., Blumthaler, M. , Bern-hard, G., McKenzie, R., Webb, A. R., Seckmeyer, G., Kjeld-stad, B., Koskela, T., Kirsch, P., Grbner, J., Kerr, J. B., Kazadzis, S., Leszczynski, K., Wardle, D., Brogniez, C., Josefsson, W., Gillotay, D., Reinen, H., Weihs, P., Svenoe, T., Eriksen, P., Kuik, F., and Redondas, A., The SUSPEN intercomparison of ultravi-olet spectroradiometers, J. Geophys. Res., accepted for publica-tion, 2000.
Bojkov, R. D., The 1983 and 1985 anomalies in ozone distribution in perspective, Mon. Weather Rev., 115, 2187–2201, 1987. Booth, C. R. and Madronich, S., Radiation amplification factors:
Improved formulation accounts for large increases in ultravio-let radiation associated with Antarctic ozone depultravio-letion, Antarctic Res. Series, 62, 39–42, 1994.
Booth, C. R., Lucas, T. B., Morrow, J. H., Weiler, C. S., and Pen-hale, P. A., The United States National Science Foundation’s po-lar network for monitoring ultraviolet radiation, Antarctic Res. Ser., 62, 17–37, 1994.
Bowman, K. P., Global patterns of the quasi-biennial oscillation in total ozone, J. Atmos. Sci., 46, 3328–3343, 1989.
Cabrera, S. and Fuenzaliada, H. A., Interannual variations of global UV radiation in Santiago, Chile (33.5oS), Geophys. Res. Lett., 26, 19, 2945–2948, 1999.
Estupinan, J. G., Raman, S., Crescenti, G. H., Streicher, J. J., and Barnard, W. F., Effects of clouds and haze on UV-B radiation, J. Geophys. Res., 101, (11), 16807–16816, 1996.
Fioletov, V. E., Kerr, J. B., and Wardle, D. I., The relationship between total ozone and spectral UV irradiance from Brewer spectrophotmeter observations and its use for derivation of total ozone from UV measurements, Geophys. Res. Lett., 24, 2705–
2708, 1997.
Gray, L. J. and Pyle, J. A., A two dimensional model of the quasi-biennial oscillation of ozone, J. Atmos. Sci., 46, 203–220, 1989. Herman, J. and Celarier, E., Erythemal exposure data product,
http://toms.gsfc.nasa.gov, 1998.
Herman, J. R., Hudson, R., McPeters, R., Stolarski, R., Ahmad, Z., Gu, X.-Y., Taylor, S., and Wellemeyer, C., Global average ozone change from October 1978 to May 1990, J. Geophys. Res., 96, 17297–17305, 1991.
Herman, J. R., McKenzie, R. L., Diaz, S., Kerr, J., Madronich, S., and Seckmeyer, G., UV radiation at the Earth’s surface, in UNEP/WMO Scientific Assessment of Ozone Depletion: 1999, Eds. D. L. Albritton, R. T. Watson, and P. J. Aucamp, WMO Global Ozone Research and Monitoring Project, Geneva, 1999a. Herman, J. R., Krotkov, N., Celarier, E., Larko, D., and Labow, G., The distribution of UV radiation at the Earth’s surface from TOMS measured UV-backscattered radiances, J. Geophys. Res., 104, 12059–12076, 1999b.
McKinlay, A. F. and Diffey, B. L., A reference spectrum for ultra-violet induced erythema in human skin, in Human exposure to ultraviolet radiation: risks and regulations, Eds. W. R. Passchler and B. F. M. Bosnajokovic, Elsevier, Amsterdam, 1987. Udelhofen, P., Gies, P., Roy, C., and Randel, W. J., Surface UV
radiation over Australia, 1979–1992: Effects of ozone and cloud cover changes on variations of UV radiation, J. Geophys. Res., 104, 19135–19159, 1999.
Woods, T. N. et al., Validation of the UARS solar ultraviolet irra-diances: comparison with the ATLAS 1 and 2 measurements, J. Geophys. Res., 101, 9541–9569, 1996.
WMO, Scientific Assessment of Stratospheric Ozone: 1998, WMO Global Ozone Research and Monitoring Project Report 44, 1998. Zerefos, C. S., On the quasi-biennial oscillation in equatorial strato-spheric temperatures and total ozone, Adv. Space Res., 2, 177– 181, 1983.
Zerefos, C. S., Factors influencing the transmission of solar violet irradiance through the Earth’s atmosphere, in Solar ultra-violet radiation, modelling, measurements and effects, Eds. C. S. Zerefos and A. F. Bais, pp. 133–142, NATO-ASI Series, 52, Springer, Heidelberg, Berlin, New York, 1997.
Zerefos, C. S., Bais, A. F., Ziomas, I. C., and Bojkov, R. D., On the relative importance of quasi-biennial oscillation and El Nino/Southern oscillation in the revised Dobson total ozone records, J. Geophys. Res., 97 (D9), 10135–10144 , 1992. Zerefos, C. S., Tourpali, K., and Bais, A. F., Further studies on
possible volcanic signal to the ozone layer, J. Geophys. Res., 99 (D12), 25741–25746, 1994.
Zerefos, C. S., Meleti, C., Balis, D., Tourpali, K., and Bais, A. F., Quasi-biennial and longer term changes in clear sky UV-B solar irradiance, Geophys. Res. Lett., 25(23), 4345–4348, 1998.