HAL Id: hal-00112584
https://hal-insu.archives-ouvertes.fr/hal-00112584
Submitted on 15 Nov 2006
HAL is a multi-disciplinary open access archive for the deposit and dissemination of sci-entific research documents, whether they are pub-lished or not. The documents may come from teaching and research institutions in France or abroad, or from public or private research centers.
L’archive ouverte pluridisciplinaire HAL, est destinée au dépôt et à la diffusion de documents scientifiques de niveau recherche, publiés ou non, émanant des établissements d’enseignement et de recherche français ou étrangers, des laboratoires publics ou privés.
Chemical-structural changes during the thermal
treatment of hydrogen-rich vitrinites caused by the
presence of terpene-type resin
María José Iglesias, María José Cuesta, Fatima Laggoun-Défarge, Isabel
Suarez-Ruiz
To cite this version:
María José Iglesias, María José Cuesta, Fatima Laggoun-Défarge, Isabel Suarez-Ruiz. Chemical-structural changes during the thermal treatment of hydrogen-rich vitrinites caused by the presence of terpene-type resin. Journal of Analytical and Applied Pyrolysis, Elsevier, 2006, 77, pp.2, 177-191. �10.1016/j.jaap.2006.03.004�. �hal-00112584�
Chemical-structural changes during the thermal treatment
of hydrogen-rich vitrinites caused by the presence of
terpene-type resin
M.J. Iglesiasa, M.J. Cuestab, F. Laggoun-Défargec and I. Suárez-Ruizb,
aÁrea de Química Orgánica, Universidad de Almería, Carretera de Sacramento, 04120
Almería, Spain
bInstituto Nacional del Carbón (CSIC), Ap. Co. 73, 33080 Oviedo, Spain
cISTO-UMR 6113 – CNRS - Université d’ Orléans, 45067 Orléans, Cedex 2, France
Abstract
The vitrain from Teruel (North-Eastern Spain) is a good example of a vitrinite whose perhydrous character and anomalous properties are caused by the presence of terpene-type resin. The sample used in this work was isothermally pyrolysed in an open-medium system at temperatures ranging from 250 to 500 °C. A mass balance, a petrographic and geochemical characterisation of the pyrolysates and compositional and structural analyses (GC and NMR) of the generated oils were performed. The results confirm the association of huminite-resinous substances through covalent bonds and also point to the possible incorporation of aliphatic material via covalent oxygen bonds. The side-chains that serve as linkers between the phenolic subunits derived from the lignin contain more labile thermal bonds than those present in other vitrinites not affected by resin saturation. Consequently, this type of vitrinite undergoes a more intense degradation at lower temperatures than non-perhydrous and other hydrogen-rich vitrinites. The vitrinite network itself due to the incorporation of resin-like substances (cycloparaffinic in nature) may serve as a hydrogen donor, enhancing the hydrogenation processes during pyrolysis with respect to the polymerisation and recombination reactions. The higher ability of hydrogen to stabilise the free radicals formed during pyrolysis explains the higher conversion to liquids at lower temperatures than in the case of non-perhydrous vitrinites. At the same time, this ability limits the growth of the aromatic structures. The evolution of the vitrinite modified by the presence of terpene-type resin is, thus, retarded with respect to non-perhydrous vitrinites, although in both cases the trend followed is very close. In contrast the trend of this type of vitrinite differs considerably from that of perhydrous vitrinites which are affected by hydrocarbon impregnation. Only for the most severe treatments (450/500 °C) was some degree of structural uniformity observed in the solid residues.
Keywords: Coal; Coal structure; Perhydrous vitrinites; Pyrolysis; Thermal treatment;
1. Introduction
Coal pyrolysis has been extensively studied because it is the basic reaction in the principal coal conversion processes. Models have been developed to describe the evolution of coal structure during thermal treatments and the general reactions and processes established [1] and [2] can be summarised as follows. Initially, hydrogen bonding is reduced, non-covalently bonded compounds are vaporised and light compounds are formed due to the cleavage of the less stable bonds. With the increase in pyrolysis temperature, bridges of increasing stability cleave, leading to the evolution of gas and tar and the formation of a progressively more stable residue (char). Finally, when most of the labile bridges have been removed, the solid residue undergoes further condensation reactions with the release of secondary gases (mainly CO and H2). Tar can also be cracked to form light compounds. The same complex mixture of
depolymerisation, condensation and cracking reactions takes place during natural coalification. Thus, natural evolution can be considered as a peculiar kind of pyrolysis which normally occurs at low temperatures (<200 °C) over millions of years. For this reason, different pyrolysis experiments were used to obtain valuable information about the phenomena that occur during natural evolution [3], [4], [5], [6], [7], [8] and [9].
Vitrinite, one of the coal components, which have undergone a process of natural hydrogen-enrichment exhibit a highly modified structure with peculiar properties and behaviour. On heating they behave in a particularly interesting manner. Whereas vitrinites are generally gas-prone materials, perhydrous vitrinites have the potential to generate liquid products [10]. Upon Gray–King pyrolysis they yield much more oil than non-perhydrous vitrinites [11] and they show a very high petroleum potential and low thermostability [12], [13], [14] and [15]. Thermogravimetric studies on hydrogen-rich vitrinites [14] and [16] have shown that their thermal behaviour is similar to that of type I kerogens. Such studies have also revealed a clear preponderance of destructive processes over polycondensation reactions, although the latter prevail in non-perhydrous vitrinites. In some cases, hydrogen-enrichment can also produce an enhancement of coking properties [17] and [18]. Knowledge of the thermal behaviour of perhydrous vitrinites could, therefore, open up a new field for the application of these materials, either by themselves or as components of coal blends, as feedstock for the preparation of high-quality products. Furthermore, this would lead to a better understanding of the effect of hydrogen-enrichment on the physico-chemical structure of vitrinite and its evolution.
The perhydrous character of vitrinite is usually associated with a high aliphatic content in the vitrinite structure and several mechanisms have been proposed for explaining the incorporation of aliphatic components in the precursors of vitrinite [19], [20], [21], [22], [23] and [24]. However, compositional and structural information about perhydrous vitrinites is rather limited for making generalisations and the class of compounds responsible for the high hydrogen content in vitrinite is often unknown. There are hydrogen-rich vitrinites for which no evidence of aliphatic incorporation has been found [15] and [25]. They can show a higher contribution of aliphatic structures over condensed aromatic ones but also a very significant amount of aromatic rings of a low degree of condensation with a preponderance of substitution [15], [26] and [27]. Thus, the study of the degradation products points to para-alkyl substituted phenols as the major structural units for these vitrinites [11] and [15]. From these findings, the presence of aromatic units of a low size and a low degree of substitution cannot be discarded when trying to explain the perhydrous character in vitrinites and its implication for the properties and behaviour of these materials. However, modification of the vitrinite structure also depends on the source of the hydrogen content and the effect that it has
during its the subsequent evolution. Differences between the aliphatic/aromatic counterparts of vitrinites affected by the saturation of the botanical tissue precursors with terpene-type resin before peatification and those affected by assimilation or impregnation by oil/petroleum-like substances during peatification and/or coalification processes have been pointed out before [11], [15], [16] and [28].
The vitrain from Teruel (North-Eastern Spain), TCV, provides a good example of a vitrinite whose perhydrous character and anomalous properties are caused by the presence of type resin [29]. Saturation of the telinitic tissues by resinous substances (mainly by terpene-type resinite) is described by Stach et al. [30] as typical in some tertiary and cretaceous coals formed from conifer wood: “In older conifer woods the resin is squeezed into the cell walls; indeed saturation of cell walls with resin (resinisation) is a characteristic of conifers”. The implications of this process for the structure of the vitrinite are probably completely different to those related with the absorption of bitumens from the thermal degradation of liptinites and the incorporation of resinite or other hydrogen-rich materials within the huminite precursors during early diagenensis or coalification [19], [31] and [32]. It is very likely that some substances present in resins (terpenes, esters, phenols, higher alcohols and, in particular, a complex mixture of resin acids) react with the lignin, originating subsequent structural modifications of the vitrinites affected by these processes. In agreement with this, the incorporation of aliphatic material via covalent oxygen linkages has been proposed as an explanation for the low aromaticity of TCV coal [11]. The hydrogen donor character of the aliphatic moieties derived from the resin might be responsible for the limited reorganisation of the aromatic lignin framework, which would explain the well-preserved structures and texture of the cellular walls observed in the petrographic examinations [15] and [29]. The structural differences found in the aliphatic moieties of this coal were inferred through a FTIR study and an analysis of the material extracted from the sample [28].
Bearing in mind the important role of the nature of the aliphatic moieties in coal as well as the presence of aromatic units of small size during the pyrolysis process, the objective of this paper was to establish the influence of hydrogen-enrichment and the effect of the source of this enrichment on the structure of the vitrinite during thermal treatment. To achieve this, the TCV vitrinite, whose structure was strongly modified by the presence of terpene-type resin, was heated to different temperatures ranging from 250 to 500 °C, and the results concerning mass balance, characterisation of solid residues and the structural study of the generated oils were compared with those previously obtained for other vitrinites (non-perhydrous and perhydrous) subjected to the same thermal treatment [7] and [9]. Pyrolysis was performed in an open-medium system which proved earlier to be useful in the study of the evolution of oil shales (type II kerogen) and coals (type III kerogen) [6] and [7]. The absence of a flow of inert gas in this system allowed the retention, to some extent, of some of the compounds generated in conditions less drastic than those of confined pyrolysis. Furthermore, it has been shown that this system is much more reliable for obtaining information about the effect the physico-chemical structure of organic matter has on vitrinite reflectance with the increase in temperature compared to confined pyrolysis [33]. This is an important point due to the suppression of the reflectance associated with hydrogen-enrichment. This system was also preferred to hydrous pyrolysis to evaluate the role of the compounds present in vitrinite with a hydrogen donor character.
2. Experimental
The geological background and the physico-chemical characterisation of the coal used in this work, TCV, Albian age (Lower Cretaceous) from the Teruel Basin (Spain), were presented in earlier papers [14], [15], [28] and [29]. The perhydrous character of this coal is reflected in the high hydrogen content (6.2%) and atomic ratio H/C (0.93) with respect to the value of its carbon content (79.7%). The data of these parameters in non-perhydrous vitrinites vary between 5.1 and 4.6% and between 0.87 and 0.61%, respectively, for carbon contents ranging from 70 to 91% [34]. The sample is also characterised by a high volatile matter content (62.4%) and the FTIR analysis show low values of aromatic hydrogen and an aromatic-to-aliphatic hydrogen ratio (0.13 and 0.02, respectively). The vitrinite reflectance value (0.23%) is suppressed as a result of the saturation of its huminite by terpene-resin. In accordance with previous studies [14] and [29] the degree of evolution for this sample corresponds to the beginning of the bituminisation interval (subbituminous A–B coal), 0.45% being the closest estimated reflectance value to the real rank reached by the TCV vitrinite. This sample is an oil-prone vitrinite (S2 from Rock–Eval pyrolysis: 291 mg HC g−1 sample; oil yield from
Gray–King pyrolysis: 27%) and it is characterised by the presence of thermally labile structures and lower values of Tmax and TDTGmax [15] and [16].
This coal was pyrolysed at different temperatures in an off-line open-medium pyrolysis system (using Gray–King assay oven type) [6] and [7]. Grains of vitrinite (≈1 mm size) were placed in an isothermal quartz reactor for 10 h, the temperature being increased 25 °C over a temperature range of 250–500 °C. At the end of the process, the amount of solid residue and effluents was determined in order to obtain the transformation ratio at each temperature. Oil was separated from the water by decantation for its quantification and further analysed by means of GC/MS and NMR.
The solid residues were studied by means of petrographic and geochemical techniques. Optical microscopy observations were carried out with a MPV Combi Leitz microscope in reflected white light using oil immersion lenses (50×). The reflectance of the vitrinite was measured in accordance with the ISO 7404/5 procedure. Observations by means of fluorescence microscopy were carried out with a MPVII Leitz apparatus and blue-violet light excitation. The vitrinite ultrafine structure was studied in grains crushed to <1 mm covered with a gold film using a SEM Zeiss-DSM 942 instrument.
The pore volume was calculated through the data of real (true) and apparent densities. The real density was determined using a glass pycnometer. The samples (ca. 2 g, particle size between 1 and 3 mm) were degassed at 100 °C for 3 h before the introduction of helium. The apparent density was determined by means of a mercury porosimeter using a Carlo Erba Macropore Unit 120 apparatus. The samples were dried and degassed before being filled with mercury.
Chemical characterisation (proximate and ultimate analyses) was carried out in accordance with international standard procedures. The elemental analyses were determined using LECO CHN 600 and LECO SC 132 equipments, and the oxygen was calculated by difference. The solid residues were prepared for FTIR analysis, using the standard KBr pellet procedure (coal:KBr mixture at a 1:100 ratio). All of the absorbance spectra were recorded on a Nicolet Magna IR560 and analysed following the procedure described by Iglesias et al. [26]. Rock– Eval pyrolysis was carried out in accordance with Espitalié [35] and [36] using a Rock–Eval 6 from Vinci Technologies.
For the GC analysis, the oils were dissolved in dichloromethane and kept for a few minutes in an ultrasonic bath to obtain total dissolution; the volume injected was 1 μL. Identification of the compounds was carried out by means of GC/MS using a Finningan GCQ gas chromatograph equipped with mass detection. The working conditions were similar to those used in the chromatographic analysis (SE-54 capillary column; detector temperature, 325 °C; injector temperature, 275 °C; column temperature program from 50 to 290 °C at 4 °C min−1). The NMR spectra of the oils were obtained on a Bruker Avance 300 spectrometer equipped with a 5 mm QNP probe (1H, 15N, 13C, 31P). Samples were prepared by dissolving the oils in CDCl3 using TMS as an internal reference. The concentration used was 0.06 g mL−1 for 1H
NMR and 0.8 g mL−1 for the 13C NMR. The sweep width was 3000–15,000 Hz and 128/6000–10,000 transients were collected for the 1H/13C NMR spectra. In all cases, a line broadening factor of 2 Hz was applied before the Fourier transformation. 13C editing of the protonated carbons was achieved through the DEPT pulse sequence, using a 135 proton for polarisation transfer. Heteronuclear single quantum correlations (HSQC) experiments with carbon edited of CH, CH2 and CH3 were obtained and processed on the standard Bruker
software.
3. Results and discussion
3.1. Pyrolysis mass-balance
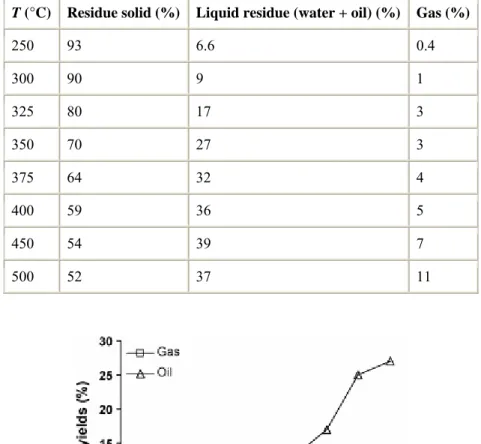
Table 1 and Fig. 1 show the results of the mass balance of the pyrolysis process. The weight loss of the solid residue after heating at 250 °C is mainly due to the release of some of the water trapped in the coal network as can be inferred from the decrease in moisture (from 12.9% in the raw vitrinite to 4.2% for the pyrolysate at 250 °C). At 300 °C oil is recovered but in a low amount. After this temperature, the oil yield undergoes a strong increase up to 450 °C (Fig. 1). Finally, between 450 and 500 °C oil is also recovered but to a lesser extent. In comparison with the results obtained during the thermal evolution of the vitrinite affected by hydrocarbon impregnation [9], maximum oil production seems to take place over a wider range of temperatures (300–450 °C versus 325–400 °C). The amount of oil between 300 and 325 °C points to a more intense degradation of the vitrinite structure at lower temperature in TCV than in the impregnated vitrinite [9]. This result agrees with the presence in TCV of thermally more labile structures [16]. The oil yield between 400 and 450 °C also points to significant differences during the thermal evolution of these two vitrinites. The supply of energy between 400 and 450 °C for the impregnated vitrinite [9] is mainly consumed in restructuring the aromatic framework and some realignment of the aromatic structure without any significant degradation of the network so that the oil yield at these stages remains nearly constant (the observed increase in oil yield was only 1%). On the other hand, for TCV the increase in oil yield (8%) suggests thermal processes associated with an intense degradation of the vitrinite structure.
The evolution of the gas yield (Fig. 1) also shows a clear difference for the data reported for a perhydrous vitrinite affected by hydrocarbon adsorption [9]. For the latter, two pulses in production were obtained, up to 375 °C and between 450 and 500 °C. In contrast, for TCV the gas yield increases progressively with the increase in pyrolysis temperature.
Table 1. : Mass balance of generated products during the pyrolysis of the perhydrous vitrinite T (°C) Residue solid (%) Liquid residue (water + oil) (%) Gas (%)
250 93 6.6 0.4 300 90 9 1 325 80 17 3 350 70 27 3 375 64 32 4 400 59 36 5 450 54 39 7 500 52 37 11
Fig. 1. Oil and gas yields at each stage of the pyrolysis temperature.
3.2. Evolution of physical properties
The evolution of the physical structure of the solid residues during the thermal treatment was followed by optical and electron microscopy (Plate 1). According to the mass balance, at the 250 °C stage the supply of energy is not sufficient to degrade the vitrinite structure, so that heating at this temperature had a drying effect without any oil production (Table 1 and Fig. 1). In agreement with this, the solid particles exhibited the same textural characteristics as the parent coal (Plate 1a and b). The increase in pyrolysis temperature originates a progressive homogenisation of both the initial vegetal structures and the optical properties of the resinite and vitrinite. Variations in the texture, structure and ultrastructure of the pyrolysates are evident at the 300 °C stage. At this stage, the degradation of the resinous material inside the cell cavities is evident from the development of devolatilisation vacuoles (Plate 1e). The formation of light products from the resinite contributes to gas production at this stage (Table 1 and Fig. 1) and to the increase in S1 from the Rock–Eval (see below). At 325 °C the vitrinite
shows a very homogenous aspect with the particles exhibiting rounded borders. Nevertheless, the same botanical structures are still discernible. An intense degradation takes place at this
stage with an increase in both oil and gas productions. This is evident from the formation of fissures in the network (Plate 1). Some remains of resinite can be detected at 350 °C (Plate 1c) but this component disappears above this temperature. For the most evolved residues an increase in the devolatilisation vacuoles is observed (Plate 1d and f).
Plate 1. Photomicrographs of the TCV vitrinite. (Pictures a–d): optical microscopy (reflected white light and oil immersion): (a) raw vitrinite, (b) 250 °C stage, (c) 350 °C stage, (d) 450 °C stage. (Pictures e–f): scanning electron microscopy images. (e) 300 °C stage and (f) 450 °C stage.
The evolution trend of the total pore volume (mm3 g−1) for pyrolysates and comparison with that reported for a perhydrous vitrinite affected by hydrocarbon adsorption is given in Fig. 2. Although the open system was used, the variation in this property indicates that for both perhydrous vitrinites some of the generated compounds were retained in their structures. In both cases, pore volume reaches a minimum at 325 °C. However, the evolution trend up to minimum porosity is different (Fig. 2). This could be the result of differences in the processes that gave rise to the minimum porosity. For TCV coal the decrease in pore volume is caused by the degradation of the exudates and resinite in the cell cavities of the raw sample. For the impregnated vitrinite the minimum in porosity was attributed [9] mainly to the mobilisation of the assimilated substances which originate the softening of the coal. Above 325 °C the increase in pore volume is limited in the pyrolysates derived from TCV up to 375 °C (Fig. 2)
with values lower than those found in the raw material. This implies that not all of the generated compounds are expelled from the system, some of them being retained due to the conditions of internal pressure. The additional increase in temperature produces the massive expulsion of generated compounds as is evident from the oil yield (Fig. 1) and a strong increase in pore volume can be observed (Fig. 2). The initial differences in this parameter between the two vitrinites are lost in the 250–375 °C range but up to this temperature, the residues obtained from TCV show a much higher porosity.
Fig. 2. Variation in pore volume during the thermal treatment of TCV and comparison with data reported for pyrolysates derived from the impregnated vitrinite [9].
3.3. Oil characteristics
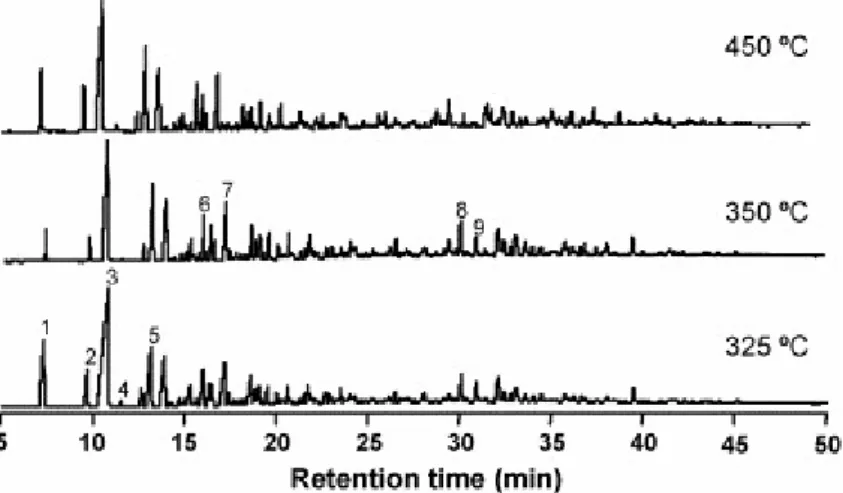
The composition of the volatile fraction of the oils recovered during the thermal treatment is very similar throughout the temperature range (300–500 °C). Fig. 3 shows, as an example the chromatograms corresponding to the oils generated at 325, 350 and 450 °C. The major compounds are phenol derivatives with a clear preponderance of p-cresol (peak 3). Such a composition agrees with the nature of the degradation products of this vitrinite [11] and [15]. Cadalene (peak 8) and nonylphenol (peak 9), the major compounds present in the volatile fraction of the extract [15], are also detected but in a very low proportion.
Fig. 2. Variation in pore volume during the thermal treatment of TCV and comparison with data reported for pyrolysates derived from the impregnated vitrinite [9].
3.3. Oil characteristics
The composition of the volatile fraction of the oils recovered during the thermal treatment is very similar throughout the temperature range (300–500 °C). Fig. 3 shows, as an example the chromatograms corresponding to the oils generated at 325, 350 and 450 °C. The major compounds are phenol derivatives with a clear preponderance of p-cresol (peak 3). Such a composition agrees with the nature of the degradation products of this vitrinite [11] and [15]. Cadalene (peak 8) and nonylphenol (peak 9), the major compounds present in the volatile fraction of the extract [15], are also detected but in a very low proportion.
Fig. 3. Gas chromatograms of the oils obtained at the 325, 350 and 450 °C pyrolysis temperatures: (1) phenol; (2) o-cresol; (3) p-cresol; (4) 2,6-dimethylphenol; (5) 4-ethylphenol; (6) ethylmethylphenol; (7) 4-propilphenol; (8) cadalene; (9) nonylphenol.
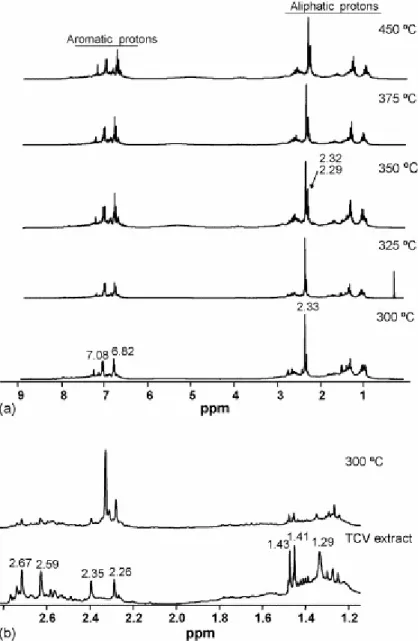
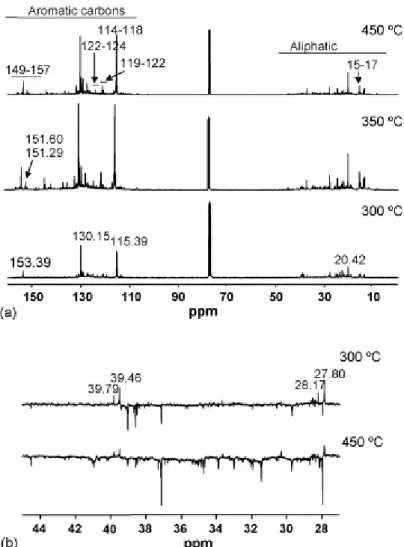
Figs. 4a and 5a show, respectively, the most representative 1H NMR and 13C NMR spectra of the generated oils during the thermal treatment of the TCV vitrinite. The predominantly phenolic nature of the oils, even at low temperature (300 °C) is evident from the NMR spectra. The 13C NMR spectra display signals in the 149–157 ppm (Car–OH), 114–118 ppm (Car–H ortho to Car–OH), 119–122 ppm (Car–H para to Car–OH) and 122–124 ppm (Car– CH3 ortho to Car–OH) ranges. In all cases, the aromatic region of the 1H NMR is dominated
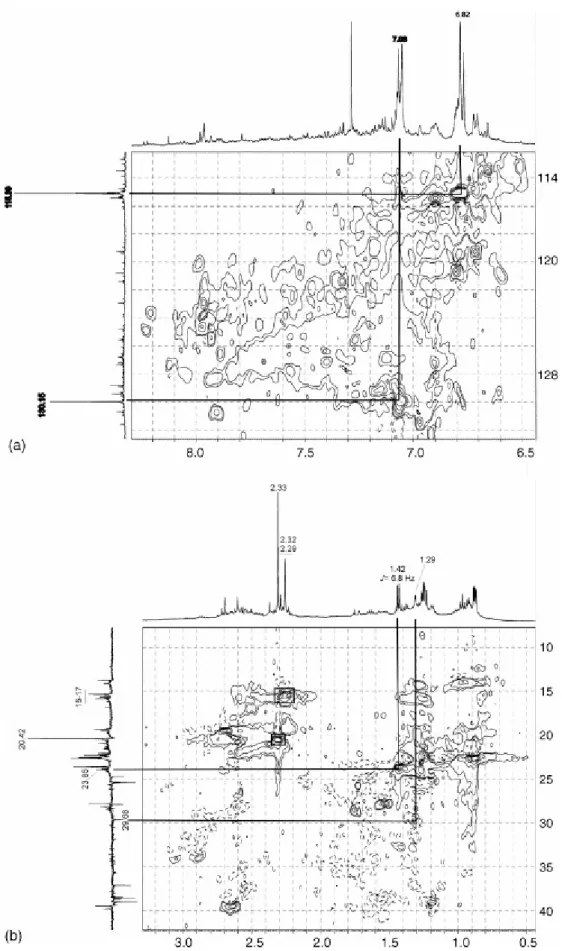
by two multiplets centred at 7.08 and 6.82 ppm that are typical of p-alkylphenols [9] and [11] correlating with the carbon atoms at 130.15 and 115.39 ppm, respectively (Fig. 6a). The aliphatic region of the 1H NMR shows in all cases a sharp signal at 2.33 ppm that correlates with the carbon signal at 20.42 (methyl group directly bonded to aromatic ring) (Fig. 6b). The chemical shifts of the signals at 7.08, 6.82 and 2.33 ppm in the 1H NMR and those of the 13C NMR at 153.39 (the most intense signal in the 149–157 ppm range), 130.15, 115.39, 20.42 ppm are ascribed to p-cresol by comparison with a model compound. Other signals in the 2.1–2.4 ppm region of the 1H NMR appear at δ 2.32 and 2.29 ppm and show cross peaks with carbon atoms resonating in the 15–17 ppm range of the 13C NMR spectra (Fig. 6b) typical of methyl groups ortho to Car–OH [37]. This agrees with the significant contribution of o-cresol and 2,4-dimethyphenol in the volatile fraction of the oils (see Fig. 3, peaks 2 and 4). As can be observed in Fig. 4a, the relative intensity of these latter signals increases for the oils obtained above 325 °C. At the same time, in the 13C NMR spectra (Fig. 5a) an increase in the carbon signals at 151.60 and 151.29 ppm can be observed. Another significant difference in the composition of the oils with the increase in temperature is the relative contribution of aliphatic CH and CH2 groups. As can be inferred from the DEPT spectra (Fig. 5b) the
contribution of CH groups is higher in the oil obtained at low temperature. This might be the result of the degradation of the resinite above 300 °C as was observed by microscopy. On the
other hand, above 325 °C neither the GC/MS nor the NMR analyses provide any evidence for reactions of secondary cracking. In fact, for these stages the spectra do not present significant changes either from a qualitative or quantitative point of view. According to this the increase in gas yield at the mentioned temperatures (Fig. 1) must originate from the vitrinite network.
Fig. 4. (a) 1H NMR spectra of the oils recovered in the 300–450 °C range of pyrolysis temperatures. (b)
Fig. 5. (a) 13C NMR spectra of the oils recovered at the 300, 350 and 450 °C stages of pyrolysis. (b) Comparison
Fig. 6. HSQC with edited carbon of CH, CH2 and CH3 for the oil at 300 °C: (a) aromatic region and (b) aliphatic
Although the oil generated at 300 °C is mainly made up of the degradation products of vitrinite (phenol derivatives), it also contains compounds derived from the resinite present in the raw sample. For this reason a comparison between the aliphatic region of the 1H NMR spectrum of the oil and the extract derived from the raw vitrinite (Fig. 4b) shows common signals. The 2D NMR study of the oil permits the accurate assignment of the signals at 1.43 and 1.41 ppm. These signals were previously associated with cycloparaffinic counterparts [28]. However, the HSQC spectrum (Fig. 6b) shows that they correspond to a doublet (δ = 1.42 ppm, JHH = 6.8 Hz) that correlates with the carbon atom at 23.85 ppm (CH3). These
data are consistent with those of the gem-dimethyl moiety in the cadalene, the major contributor to the volatile fraction of the chloroform extract of the raw sample [15]. The signal at 1.29 ppm in the 1H NMR spectrum that correlates with the carbon signal at 29.68 ppm (CH2) (Fig. 6b), indicates the presence of methylene groups in a chain long enough
to permit free rotation, ensuring the magnetic equivalence of their protons. It is probable that such methylene groups arise from long-chain phenols related to the terpenoid precursors of the resin in TCV, as could be inferred from the abundance of nonylphenol in the volatile fraction of the extract [15]. Cadalene and nonylphenol were also detected in the volatile fraction of the oils (Fig. 3). These spectral features are discernible also for the oil generated at 325 °C but disappear at higher temperatures in agreement with the microscopic observations. The results obtained have two important implications. Resinous substances must be associated with huminite/vitrinite through strong bonds so that they cannot be considered as a part of the non-covalent material. If they were, the composition of the oils at the lowest stages of treatment would mainly contain compounds derived from such substances. By contrast the degradation of the vitrinite structure that implies the cleavage of the side-chain carbons of the phenolic subunits derived from the lignin, occurs at low temperatures. In this case, as a result of the association of huminite-resinous substances, the side-chains would contain more labile thermal bonds than those present in the vitrinites not saturated by resins. A comparison of the NMR spectra for the oils generated from the two perhydrous vitrinites, even at the stages in which the composition of the oils is predominantly phenolic (above 350 °C), also shows significant differences. Such differences mainly concern the aromatic regions of both 1H NMR and 13C NMR. The 1H NMR spectra in the oils derived from the impregnated vitrinite show a higher contribution of aromatic protons between 7.2 and 8.3 ppm (protons in di- and tri-aromatic structures) and the region between 120 and 130 ppm in the 13C NMR is broader
with the contribution of several overlapping signals [9]. These spectral features are more apparent in the oil generated at 375 °C but they are also present at higher temperatures. In contrast the oils derived from the TCV vitrinite give rise to simpler spectra with well resolved signals (see Figs. 4a and 5a). This suggests differences in the reacting medium in which the thermal evolution takes place, considering that some of the compounds generated are retained. The role of the reacting medium during artificial thermal evolution has been widely studied by Mansuy et al. [38] and [39]. Furthermore, the presence of a suspensive medium containing polycyclic aromatic units favours the re-orientation of the aromatic structures in the solid residues [18].
3.4. Evolution of vitrinite reflectance
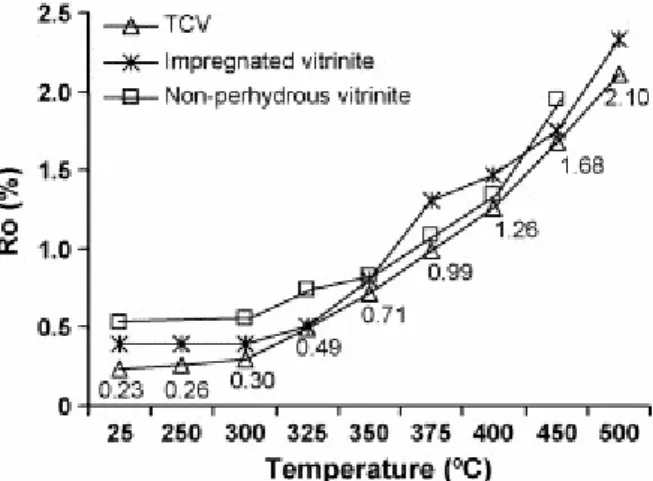
An earlier degradation of the vitrinite structure in the TCV sample with respect to the vitrinite affected by hydrocarbon impregnation as well as differences in the reacting medium in which the thermal evolution of these two samples takes place might have an effect on the evolution of the composition, structure and properties of the solid residues. Fig. 7 shows the evolution of the vitrinite reflectance during the thermal treatment of the TCV vitrinite in comparison
with that reported for the impregnated vitrinite [9] and perhydrous vitrinite [7]. The non-perhydrous vitrinite is a low-rank vitrinite characterised by a very pure organic composition and is made up almost exclusively of the vitrinite maceral group, the telinite maceral, which has well-preserved cell structures, being the major component (73.5 vol.% mmf). Its degree of evolution corresponds to the beginning of the bituminisation stage [14] and is therefore close to the real degree of evolution estimated for the TCV vitrinite [29]. As can be observed in Fig. 7, the reflectance increases at a lower temperature (300 °C) for TCV than for the other two samples. The variation in this parameter at this stage is, however, small (0.07%). Up to 325 °C the increase in reflectance undergone by the TCV sample is higher than for the perhydrous vitrinite affected by hydrocarbon adsorption (0.26% versus 0.12%) so that at this stage (325 °C) the residues show close values for this parameter. However, these values are lower than those of the non-perhydrous vitrinite. Thus, during the first stages of pyrolysis the reflectance can be considered to be suppressed as in the raw materials. Above 325 °C the evolution trend of vitrinite reflectance for the TCV sample is similar to that of the non-perhydrous sample, although for all the pyrolysis temperatures the values are lower. The difference is more significant for the residues at 450 °C. TCV perhydrous vitrinite requires a greater supply of energy to attain a similar reflectance value. The evolution trend of reflectance during the thermal treatment of the other perhydrous vitrinite clearly differs. The residues derived from this vitrinite at 375 and 400 °C show higher values than those derived from either the TCV perhydrous vitrinite or the non-perhydrous vitrinite at the same stages. Furthermore, the reflectance values for all the pyrolysates obtained from the impregnated vitrinite are higher than those obtained for the residues derived from the TCV vitrinite. According to the vitrinite reflectance for the residue at 500 °C, the anthracite rank might be attainable. However, as in the case of the impregnated vitrinite the development of anisotropy was not detected. In both cases, this result may have been due to the enhancement of cross-linking, as a result of the pyrolysis conditions and the special characteristics of the samples with a highly phenolic structure.
Fig. 7. Evolution of vitrinite reflectance with the increase in pyrolysis temperature. Data for the impregnated vitrinite and the non-perhydrous vitrinite are taken from Iglesias et al. [9] and Jimenéz et al. [7], respectively.
It is well known that vitrinite reflectance depends on the refractive and absorptive indices which increase with aromatisation and condensation, respectively. During the thermal treatment of coals, the ability of hydrogen to stabilize the free radicals formed not only governs the conversion to liquid products (oil and tar) but also the contribution of polymerisation and condensation reactions. The effluents generated during the thermal evolution could be the source of hydrogen and close contact between these effluents and the solid residues is believed to be necessary to favour hydrogenation reactions over
recombination ones [40]. Furthermore, it appears that the coexistence of hydrocarbons and polar compounds in the reacting medium is also necessary [38]. Hydrocarbons promote mobility and enhance hydrogen transfer. Polycondensed aromatic hydrocarbons act as agents of hydrogen transfer. The development of a suitable medium for hydrogen transfer is not favoured in the non-perhydrous sample because of the combination of two main factors. The initial characteristics of the sample prevent both the formation of heavy hydrocarbons and the development of a fluid phase in the coal [18]. On the other hand, the pyrolysis conditions promote extensive fracturing of the vitrinite structure, thus enhancing the massive expulsion of the generated products and the formation of light products through secondary cracking reactions [7]. The assimilated compounds initially present in the impregnated vitrinite seem to provide a convenient mixture for enhancing hydrogenation. Cross-linking and condensation processes are thus hindered, which could explain the vitrinite reflectance suppression in this sample. During the thermal treatment these compounds are strongly modified provoking a noticeable change in the reacting medium. Polar compounds are more strongly retained in the vitrinite structure [41]. Thus, some of them might have been incorporated into the solid residue, which would explain the strong increase in vitrinite reflectance between 350 and 375 °C. Others, however, could have remained as non-covalent linked material retaining their mobility so that an alignment of the aromatic structures in the vitrinite network takes place, causing a change in the slope of the evolution of vitrinite reflectance, as can be observed in Fig. 7. The rise in pyrolysis temperature above 450 °C under conditions of low hydrogen availability enhances cross-linking and a new pulse in the increase of reflectance without any anisotropy occurs. In the case of TCV the situation is somewhat different. The network itself as the result of the incorporation of resin-like substances, which are cycloparaffinic in nature, into the huminite of this coal through covalent bonds might serve as hydrogen donor during hydrogen transfer without the necessity of polycondensed structures in the reacting medium functioning as vehicles for the donation. This would explain the slower increase in reflectance observed during the thermal treatment.
3.5. Evolution of chemical parameters
Heating originates a decrease in volatile matter as a result of the increase in the proportion of aromatic structures caused by the removal and/or aromatisation of aliphatic and alicyclic groups and the increase in the size of the aromatic units through condensation reactions. The evolution of this parameter for TCV vitrinite and the comparison with other previous results are given in Fig. 8a. In both cases, the slight decrease observed at 250 °C can be attributed to modifications in the substances that are non-covalently bonded to the vitrinite matrix. Above this stage, the evolution of volatile matter differs in both series of vitrinites. In the case of TCV, the degradation of the vitrinite matrix at 300 °C is evident and as a result the volatile matter decreases slightly between 250 and 300 °C (Fig. 8a) which is much more evident at 350 °C. The presence in TCV of more labile thermal bridges and the consumption of part of the energy in the transformation of the assimilated compounds initially present in the perhydrous vitrinite affected by impregnation are the most likely reasons for these differences. The greater intensity of the depolymerisation reactions during heating of TCV up to 350 °C leads to a higher oil production and expulsion (11% versus 7% oil yield) and the formation of a more stable macromolecular network. As a result of this, the volatile matter content of the residues at 325 and 350 °C is lower in TCV than in the impregnated vitrinite (Fig. 8a). Moreover, in the impregnated vitrinite, at these stages the initial assimilated compounds or derived products which are rich in hydrogen are present in appreciable amounts and contribute to the volatile content. The additional depolymerisation reactions of the more stable macromolecular network in TCV together with the formation and expulsion of relatively low
molecular weight products and the parallel decrease in volatile matter possibly require a greater supply of energy. This would explain the differences found in the oil yield between 350 and 375 °C (2 and 7% for TCV and impregnated vitrinite, respectively) and the evolution of the volatile matter at these temperatures (Fig. 8a). At the same time, heating impregnated vitrinite in the 350–375 °C range possibly entails the incorporation into the matrix of polycondensed structures that may contribute to a decrease in volatile matter. On the other hand, given that the structural analysis of the oils does not show any evidence of oil cracking, gas production in the 375–450 °C range may indicate that condensation reactions are the cause of the decrease in volatile matter for the TCV series. This was not the case for the evolution series derived from the impregnated vitrinite for which no gas was obtained in the 375–450 °C temperature range [9]. A greater contribution of condensation during the thermal treatment of TCV at these stages might also be expected also to lead to higher values of vitrinite reflectance in the corresponding residues. However, the vitrinite reflectance values for the pyrolysates derived from TCV are lower than those of the impregnated vitrinite over the entire temperature range (Fig. 7). The correlation between volatile matter and reflectance for the artificial samples obtained in the thermal treatment of the two perhydrous vitrinites and for the natural series from van Krevelen [34] is given in Fig. 8b. Both artificial series fit the natural trend but the values for the pyrolysates from the impregnated vitrinite are closer to those of the natural series than those of the perhydrous TCV vitrinite. In particular, above 325 °C the artificial samples from TCV are depleted of volatile matter, as their reflectance values show. This suggests that the response of the vitrinite structure during thermal evolution depends not only on its perhydrous character but also on the process that originates the hydrogen-enrichment.
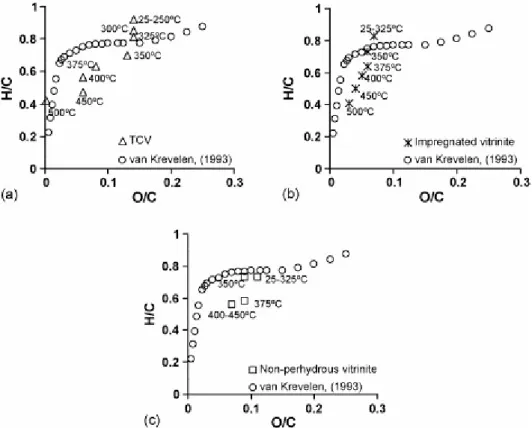
The variation in these H/C and O/C ratios during the heating of the artificial samples has been plotted on a van Krevelen diagram (Fig. 9) together with the ratios derived from the data for the natural vitrinites [34] and for a non-perhydrous vitrinite [7] and the one affected by hydrocarbon impregnation [9]. Regardless of the perhydrous or non-perhydrous character, the H/C atomic ratio decreases at a higher rate than in the natural series. The deviation from the natural series evolution on the van Krevelen diagram is attributed to the use, during pyrolysis, of high temperatures which induces cleavages in the side-chain of aromatics with the subsequent loss of aliphatic carbon in the effluents [7] and [8]. Nevertheless, significant differences in the evolution of the atomic ratios between the three artificial series can be observed. The change in the O/C atomic ratio starts during the same range of temperatures in all cases (325–350 °C). In the non-perhydrous series, as in the natural series, this decrease occurs without any loss of hydrogen, whereas in the perhydrous series there is also a change in the atomic ratio H/C. Furthermore, the beginning of the decrease in H/C takes place at a lower temperature (250–300 °C) in the TCV series than in the series derived from the impregnated vitrinite (300–325 °C), i.e. when a significant degradation of the vitrinite structure takes place. At these stages, the change in H/C atomic ratio is, however, not significant enough to modify the perhydrous character of the samples, which is lost in the following stage (325 °C for TCV, 350 °C for the impregnated vitrinite) as can be inferred from its position with respect to the natural line. Above 350 °C, the modification in the H/C atomic ratio sees a gradual decrease in the artificial series derived from the perhydrous vitrinites. In contrast, a sharp decrease takes place between 350 and 375 °C (0.15 versus 0.08 in the perhydrous series) and then, it remains almost constant for the other series. As a result, the artificial series from the perhydrous vitrinites in the 375 and 400° C ranges are enriched in hydrogen, whereas at 450 °C the H/C atomic ratio of the pyrolysate derived from the non-perhydrous vitrinite shows a higher H/C value. Although the evolution trend of the H/C atomic ratio for the perhydrous artificial series were very close in the 325–500 °C temperature
range, this was not the case for the O/C which shows a more pronounced decrease in TCV in the 350–375 and 450–500 °C temperature ranges. Surprisingly, despite the phenolic nature of the generated oils the strongest changes took place when the oil yield was relatively low (Fig. 1). In the 350–375 °C range these results can be rationalised in terms of the retention of some of the generated oil. This can be inferred from the limited increase in the pore volume at these stages (Fig. 2). Between 450 and 500 °C the vitrinite structure is strongly dislocated so that the decrease in the O/C atomic ratio should have resulted in a loss of phenolic structures and cross-linking.
Fig. 8. (a) Decrease in volatile matter content with the increase in pyrolysis temperature for the two series of artificial thermal evolution perhydrous vitrinites, TCV and impregnated vitrinite [9]. (b) Correlation between volatile matter and vitrinite reflectance for the two artificial series of perhydrous vitrinites and comparison with the natural series of vitrinite (data from van Krevelen [34]).
Fig. 9. Position of the artificial series of vitrinite on the van Krevelen diagram: (a) TCV, (b) impregnated vitrinite and (c) non-perhydrous vitrinite.
3.6. Evolution of vitrinite functional groups
In order to obtain more accurate information about the chemical changes during the thermal evolution of the vitrinite structure the changes in the functional groups were followed by means of infrared spectroscopy. Fig. 10 shows the most significant FTIR spectra for the pyrolysates from the TCV sample and the results of the semi-quantitative analysis are given in Fig. 11 [42].
Fig. 10. FTIR spectra of the raw perhydrous vitrinite, TCV, and their pyrolysates for the most significant stages of temperature.
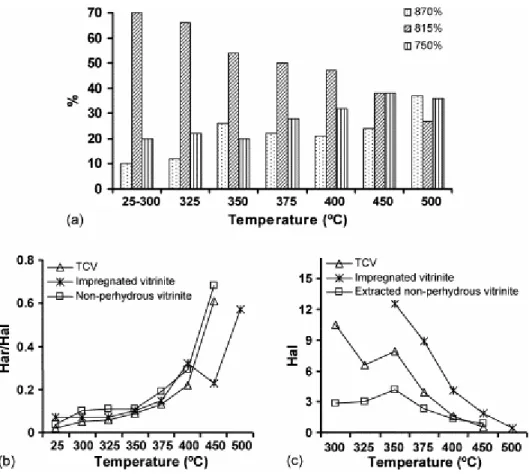
Fig. 11. Semi-quantitative FTIR data: (a) aromatic hydrogen distribution, (b) aromatic-to-aliphatic hydrogen ratio (Har/Hal), (c) aliphatic hydrogen concentration (Hal). Data for the non-perhydrous and impregnated vitrinites are taken for Refs. [7] and [9].
The structural changes that take place after heating at 300 °C are reflected in an overall increase in the intensity of the FTIR spectrum. This feature was also noticed during the thermal evolution of the impregnated vitrinite although at a higher temperature (350 °C) [9]. The increase in infrared absorption indicates a change in the physical structure, probably associated with the homogenisation of the vitrinite observed by microscopy (Plate 1). In the impregnated vitrinite this physical change was also accompanied by a strong chemical transformation reflected in the lack of the aromatic band at 1500 cm−1 in the infrared spectrum of the residue at 350 °C [9]. Although the degradation of the vitrinite structure in TCV started at 300 °C, at this stage it is not as massive as the degradation that takes place at 350 °C for the impregnated vitrinite. As a result the spectra of the raw vitrinite and the pyrolysate show the same infrared bands. A more intense degradation of the vitrinite with a subsequent reorganisation of the aromatic structure takes place above 300 °C, which is reflected in a significant decrease in the intensity of the aromatic mode at 1500 cm−1 in the spectrum of the residue at 325 °C. Progressive pyrolysis causes an increase in the degree of substitution/condensation that in turn affects the intensity and position of the band at 1500 cm−1 so that this mode is absent in the spectra of the residues above 325 °C.
The changes in the reorganisation of the aromatic framework that occur parallel to the depolymerisation reactions with the release of phenolic structures in the oils were semi-quantitatively followed through the relative intensity of the out-of-plane bending modes of the aromatic C–H bonds (900–700 cm−1 region). The corresponding data are depicted in Fig. 11a. The aromatic hydrogen distribution starts to change at 325 °C with a decrease in the relative intensity of the 815 cm−1 mode (%815) which agrees with the decrease in the absorption band
at 1500 cm−1. The continued increase in temperature (350 °C stage) not only gives rise to a sharper decrease in %815 but also a significant increase in the proportion of aromatic systems containing isolated C–H bonds (%870, Fig. 11a). This implies a higher degree of condensation/substitution of the aromatic units, which also rebounds in the disappearance of the absorption band at 1500 cm−1. Between 350 and 400 °C the most noticeable change in the aromatic hydrogen distribution is the increase in the proportion of ortho-disubstituted aromatic systems reflected in the relative intensity of the 750 cm−1 mode (%750, Fig. 11a). However, up to 400 °C the most prominent band in the 900–700 cm−1 is, as for the raw material, the 815 cm−1 mode. The decrease in %815, which is limited in the 350–400 °C
range, again undergoes a sharp decrease during the last stages of pyrolysis (above 400 °C). The decrease between 400 and 450 °C is mainly associated with an increase in the 750 cm−1 mode whereas in the 450–500 °C range there is a strong increase in the relative intensity of the band due to pentasubstituted aromatic rings (%870, Fig. 11a). The drastic change in the aromatic hydrogen distribution between 450 and 500 °C occurs at the same time as a noticeable decrease in the atomic ratio O/C (Fig. 9a). Given that oil production at these stages is very limited, the results obtained indicate a high contribution of cross-linking during the thermal treatment which agrees with the increase in reflectance and the lack of anisotropy in the 500 °C stage.
The relative intensity of the infrared band at 815 cm−1 is associated with the para-alkyl substituted phenols which are the main structural units of the raw vitrinite [15]. Thus, the decrease in %815 agrees with the preponderance of p-cresol in the released oils. On the other hand, the increase in ortho-disubstituted aromatic systems (estimated as %750 in Fig. 11a) found for the solid residues above 350 °C is related, at least in part, with an increase in the proportion of phenol derivatives containing alkyl groups ortho to the Car–OH because this increase occurs at the same time as a corresponding increase in the proportion of ortho-methyl groups in the phenols (Fig. 4a). A grater contribution of the ortho-substituted phenolic units during the thermal treatment of TCV might be consistent with the incorporation of aliphatic structures via covalent oxygen bonds put forward to explain the low aromaticity of this coal [11]. In fact, alkyl aryl ethers can be thermally transformed into ortho-alkyl phenols through the classical Claisen rearrangement. It is also very likely that, during this rearrangement, cleavage of the side-chain with the release of light compounds takes place, thus explaining gas production from the network without any accompanying condensation reactions.
The change in the aromatic-to-aliphatic hydrogen ratio (Har/Hal) with the increase in pyrolysis temperature for the TCV vitrinite and its comparison with data previously reported is given in Fig. 11b. During the thermal treatment of TCV this parameter follows a similar trend to that of the non-perhydrous vitrinite but the values are lower for all the temperature range. The aromatic-to-aliphatic ratio is rank-dependent [43] and [44]. Changes in this parameter for the non-perhydrous series were similar to those described for the natural series and a good correlation between the Har/Hal ratio and reflectance was obtained [7]. The lower values of Har/Hal for the TCV pyrolysates together with the limited increase in the size of the aromatic units up to 500 °C explain the lower reflectance values of the residues (Fig. 7). This can be deduced from an analysis of the relative intensity of the infrared bands in the 900– 700 cm−1 region (Fig. 11a). The evolution of Har/Hal for the impregnated vitrinite is different above 375 °C. The correlation between hydrogen aromaticity (Har/Hal) and reflectance is not straightforward for the evolution series derived from the impregnated vitrinite. Thus, for this vitrinite, the increase in Har/Hal between 350 and 375 °C is similar to that of TCV despite the sharper increase in reflectance and the increase in this parameter between 400 and 450 °C (Fig. 7) takes place with no accompanying change in Har/Hal. These results indicate the
strong influence of compounds assimilated into the vitrinite network during the thermal treatment and confirm that no secondary hydrogenated substances were assimilated into the huminite in TCV. These results and the microscopical observations suggest that reflectance during the thermal evolution of impregnated vitrinites is not only affected by the changes in chemical structure but also the physical structure, as a result of the presence of substances of secondary origin.
During the pyrolysis, perhydrous vitrinites generated a higher amount of oil than non-perhydrous vitrinites. Aliphatic carbon structures which are hydrogen-rich played an important role in the stabilisation of the radicals formed during pyrolysis, hindering their polymerisation and hence increasing the amount of oil. It is well known [45] that conversion to liquids and gases need a high amount of aliphatic carbons in the raw material. The evolution of the aliphatic structures in the solid residues during the thermal treatment of the TCV vitrinite was observed from the variation in the intensity of the infrared bands due to the aliphatic C–H stretching vibrations (integrated area between 3000 and 2700 cm−1, Hal). The intensity values at each pyrolysis stage between 300 and 500 °C are depicted in Fig. 11c together with data previously reported for other artificial series. The evolution trend of aliphatic hydrogen during the thermal treatment of TCV and the non-perhydrous vitrinite is similar but the amount of aliphatic hydrogen estimated by FTIR for the TCV pyrolysates is higher up to the 400 °C stage. This hydrogen is consistent with the high oil yield in the 300– 375 °C range of pyrolysis temperatures for TCV. However, there is a strong increase in oil yield above 375 °C for the TCV series which has a similar aliphatic hydrogen content in the residues to that reported for the non-perhydrous vitrinite. This increase occurs at the same stages at which a very sharp increment in the pore volume is observed (Fig. 2). During the thermal treatment of TCV, the oil yield does not correspond exactly to oil production but it depends on the expulsion capacity. The high oil production in TCV as result of its perhydrous character leads to an increase in the internal pressure of the system and consequently a higher temperature is required in order that the oil generated can be expelled from the open-system. From the results obtained it is very likely that maximum oil production occurs in the 300– 400 °C range, i.e. the final temperature of maximum oil production is the same as that reported for the thermal evolution of the impregnated vitrinite. Therefore, during the thermal treatment of perhydrous vitrinites the conversion to liquid is greater and takes place at a lower temperature than in non-perhydrous vitrinites as a result of the ability of hydrogen to stabilise the free radicals formed during pyrolysis. Finally, a comparison of the Hal in TCV and impregnated vitrinite in the 350–500 °C range shows that this parameter is higher for the residues of the impregnated vitrinite, although the differences decrease with the pyrolysis temperature. Nevertheless, for the most evolved residue also (500 °C) the intensity of the aliphatic bands is strong enough to permit the measurement of its area with some degree of accuracy unlike TCV (Fig. 11c).
3.7. Evolution of Rock–Eval parameters
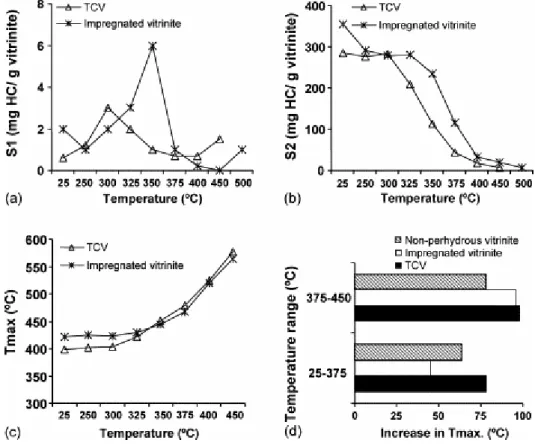
The variation in the most significant parameters from Rock–Eval pyrolysis (S1, S2 and Tmax)
for the pyrolysates of the TCV vitrinite and their comparison with other artificial series is given in Fig. 12 [46]. The evolution of the S1 peak up to 350 °C with a maximum at the
300 °C stage (Fig. 12a) is mainly associated with the degradation of the resinite and the exudates. During the thermal treatment of the perhydrous vitrinite that was affected by hydrocarbon adsorption, S1 reaches a maximum at higher temperatures because it is associated
with transformations of the assimilated substances. These substances are probably thermally more stable. Furthermore, the degradation of the substances, the weakening of the interactions
between the assimilated substances and the coal matrix, their mobilisation and release from the vitrinite network lead to the consumption of thermal energy. Above 350 °C when resinite is not detected the S1 remains almost constant up to 400 °C when it undergoes another
increase (Fig. 12a). As there is no evidence of secondary cracking this result implies the generation of light compounds from the vitrinite network which is probably associated with cross-linking and condensation. This can be inferred from the change in the aromatic hydrogen distribution (Fig. 11a). In the impregnated vitrinite cross-linking occurs at a higher temperature so that the increase in S1 after the maximum takes place between 450 and 500 °C.
Fig. 12. Rock–Eval parameters: (a) evolution of the S1 peak with pyrolysis temperature and comparison with
data reported for the thermal series derived from an impregnated vitrinite, (b) S2 values for the pyrolysates
derived from the two series, TCV and impregnated vitrinite, (c) evolution of Tmax for the two series derived from
perhydrous vitrinites, (d) comparison of the Tmax increases in the 25–375 and 375–450 °C ranges during thermal
treatment of TCV, an impregnated vitrinite and a non-perhydrous sample. Data for the impregnated vitrinite taken from Iglesias et al. [9]. Data for the non-perhydrous vitrinite from Jiménez et al. [7].
In both perhydrous vitrinites pyrolysis at 250 °C does not supply sufficient energy to degrade the structure of the huminite/vitrinite but it does affect the non-covalently bonded material. However, as a result of the different nature of this material its response to the temperature is different. The non-covalent material in the impregnated vitrinite arises from the secondary substances assimilated into its ulminite. According to the NMR data of the extractable material, the effect of thermal treatment at 250 °C on these compounds is consistent with a cyclisation of aliphatic chains with the formation of hydroaromatic structures, which are then further dehydrogenated to aromatics [9]. These transformations cause an increase in the molecular weight of the aromatics reducing their volatility, which would explain the decrease in S1 (Fig. 12a). Furthermore, the transformations also affect S2 and so this decreases after
heating at 250 °C (Fig. 12b). The substances that are non-covalently bonded to the coal matrix in TCV are derived from the resinite inside the cell cavities and exudates [28]. According to
microscopic observation, the degradation of the exudates initially present in TCV is the main process at the 250 °C stage. Their transformation into lighter compounds is, thus, responsible for the increase in S1. In contrast to the effect of the treatment at 250 °C on the S2 peak in the
impregnated vitrinite, this parameter does not change for the residue derived from TCV at 250 °C. According to the results presented in Fig. 12b, it is clear that up to 300 °C the differences in S2 for the raw material are due to the contribution of some of the assimilated
substances to the value of this parameter for the impregnated vitrinite. This is not the case for TCV vitrinite in which the exudates and resinite do not significantly affect the value of petroleum potential. The degradation of the vitrinite in TCV is the main factor responsible for the decrease in this parameter. Because the degradation starts at a lower temperature, the variation in S2 occurs at 300 °C as opposed to 325 °C for the impregnated vitrinite (Fig. 12b).
A comparison of Figs. 12b and 11c shows that the lower values of S2 up to 400 °C for the
residues derived from TCV compared to those obtained from the impregnated vitrinite are consistent with a higher aliphatic hydrogen content in the latter.
As expected, the Tmax values rise as the pyrolysis temperature increases (Fig. 12c). This
increase starts between 300 and 325 °C, i.e. in the same range of temperatures as the perhydrous vitrinite affected by hydrocarbon adsorption and, therefore at a higher temperature than in the non-perhydrous vitrinite series (330 °C) [7]. Similarly, the strongest modifications in this parameter also take place up to 375 °C. However, this increase is higher during the thermal treatment of the perhydrous vitrinites, as can be seen in Fig. 12d. This figure also shows different increases in the three artificial series below 375 °C. Thus, up to 375 °C TCV undergoes a higher increase in Tmax than the other samples, the impregnated vitrinite
exhibiting the lowest variation. Finally, the pyrolysates above 350 °C have a higher thermostability (Fig. 12c).
4. Conclusions
The thermal treatment performed on a hydrogen-rich vitrinite affected by the presence of terpene-type resin allow us to establish that resinous substances are associated with huminite/vitrinite through strong bonds so that they cannot be considered as a part of the non-covalently bonded material. This material is made up of the resinite filling the cell cavities and exudates. The degradation of these components takes place during the first stages of thermal treatment (250–325 °C) but it does not significantly affect the evolution of the vitrinite's structure. Modification of the vegetal precursors through the process of saturation by resin originates the presence of thermally labile bridges in the huminite so that this type of vitrinite undergoes a more intense degradation at a lower temperature than in the case of either the non-perhydrous or other hydrogen-rich vitrinites. The results obtained also support the view that aliphatic material is incorporated into this vitrinite via covalent oxygen bonds. Regardless of the perhydrous or non-perhydrous character or the origin of the hydrogen-enrichment, pyrolysis treatment causes a decrease in the H/C atomic ratio at a higher rate than in the natural series. However, the pyrolysates derived from the perhydrous samples up to the 400/450 °C stage are enriched in aliphatic hydrogen with respect to the residues obtained during the thermal evolution of non-perhydrous vitrinites. The ability of hydrogen to stabilise the free radicals formed during the pyrolysis of perhydrous vitrinites explains the fact that more liquids are converted at lower temperatures than in the non-perhydrous vitrinites. Evidence for the retention of some of the generated compounds during the thermal evolution of perhydrous vitrinites was obtained.
The enhancement of the hydrogenation process compared to the recombination and condensation processes during the thermal evolution of the vitrinite which is modified by the presence of terpene-type resin limits the aromatisation and growth of the aromatic units. Evolution was therefore found to be retarded with respect to that of the non-perhydrous vitrinites, although in both cases the trend was very close. The evolution of this type of perhydrous vitrinite differs strongly from that followed by vitrinites affected by hydrocarbon impregnation through adsorption. As a result of the incorporation of cycloparaffinic, resin-like substances into the huminite via covalent bonds, the vitrinite network itself is able to serve as hydrogen donor during hydrogen transfer.
From the results obtained it is clear that the response of the vitrinite structure during thermal evolution depends not only on its perhydrous character but also on the process that originated the hydrogen-enrichment. Nevertheless, a certain degree of structural uniformity for the residues obtained at the most severe treatments of 450/500 °C was observed.
Acknowledgements
The financial support for this work was provided through a contract with the European Community (No. 7220/EC-764). The authors thank the NMR facilities of the University of Almería (Spain) for allocating measuring time.
References
[1] G.R. Gavalas, P.H.-K. Cheong and R. Jaln, Ind. Eng. Chem. Fundam. 20 (1981), p. 113. [2] P.R. Solomon, M.A. Serio and E.M. Suuberg, Prog. Energy Combust. Sci. 18 (1992), p. 133.
[3] M. Monthioux, P. Landais and J.-C. Monin, Org. Geochem. 8 (1985), p. 275.
[4] H.J. Schenk, E.G. Witte, R. Littke and K. Schwochau, Org. Geochem. 16 (1990), p. 943. [5] R. Michels and P. Landais, Fuel 73 (1994), p. 1691.
[6] I. Suárez-Ruiz, L. Martínez, Ph. Bertrand, J.G. Prado and J.-R. Disnar, Int. J. Coal Geol.
25 (1994), p. 47.
[7] A. Jiménez, M.J. Iglesias, F. Laggoun-Défarge and I. Suárez-Ruiz, J. Anal. Appl. Pyrol.
50 (1999), p. 117.
[8] F. Behar and P.G. Hatcher, Energy Fuels 9 (1995), p. 984.
[9] M.J. Iglesias, M.J. Cuesta, F. Laggoun-Défarge and I. Suárez-Ruiz, J. Anal. Appl. Pyrol.
58–59 (2001), p. 841.
[10] R.W.T. Wilkins and S.C. Geroge, Int. J. Coal Geol. 50 (2002), p. 317.
[11] M.J. Iglesias, M.J. Cuesta, F. Laggoun-Défarge, I. Suárez-Ruiz, J. Anal. Appl. Pyrol.,
[12] J. Newman, L.C. Price and J.H. Johnston, J. Petrol. Geol. 20 (1997), p. 137.
[13] C.M. Norgate, C.J. Boreham, P.J.J. Kamp and J. Newman, J. Petrol. Geol. 20 (1997), p. 427.
[14] A. Jiménez, M.J. Iglesias, F. Laggoun-Défarge and I. Suárez-Ruiz, Chem. Geol. 150 (1998), p. 197.
[15] M.J. Iglesias, J.C. del Río, F. Laggoun-Défarge, M.J. Cuesta and I. Suárez-Ruiz, J. Anal. Appl. Pyrol. 62 (2002), p. 1.
[16] A. Arenillas, F. Rubiera, J.J. Pis, M.J. Cuesta, M.J. Iglesias, A. Jiménez and I. Suárez-Ruiz, J. Anal. Appl. Pyrol. 68–69 (2003), p. 371.
[17] S. Creaney, D.E. Pearson and L.G. Marconi, Fuel 59 (1980), p. 438.
[18] F. Laggoun-Défarge, J. -N-Rouzaud, M.J. Iglesias, I. Suárez-Ruiz, N. Buillit and J.-R. Disnar, J. Anal. Appl. Pyrol. 67 (2003), p. 263.
[19] A. Hutton and A. Cooke, Fuel 59 (1980), p. 711.
[20] M. Mastalerz, K.R. Wilks and R.M. Bustin, Org. Geochem. 20 (1993), p. 555. [21] E. Zhang, P.G. Hatcher and A. Davis, Org. Geochem. 20 (1993), p. 721.
[22] T. Gentzis and F. Goodarzi In: P.K. Mukhopadhyay and W.G. Dow, Editors, ACS Symposium, series 570, American Chemical Society, Washington, DC (1994), p. 93.
[23] W.A. Hartgers, J.S. Sinninghe Damsté, J.W. de Leeuw, Y. Ling and G.R. Dyrkacz, Energy Fuels 8 (1994), p. 1055.
[24] B.A. Stankiewicz, M.A. Kruge and M.A. Mastalerz, Org. Geochem. 24 (1996), p. 531. SummaryPlus | Full Text + Links | PDF (1161 K)
[25] R. Sykes, M.G. Fowler and K.C. Pratt, Energy Fuels 8 (1994), p. 1402.
[26] M.J. Iglesias, A. Jiménez, F. Laggoun-Défarge and I. Suárez-Ruiz, Energy Fuels 9 (1995), p. 458.
[27] M.J. Iglesias, A. Jiménez, J.C. del Río and I. Suárez-Ruiz, Org. Geochem. 31 (2000), p. 1285.
[28] M.J. Iglesias, J.C. del Río, F. Laggoun-Défarge, M.J. Cuesta and I. Suárez-Ruiz, J. Anal. Appl. Pyrol. 68–69 (2003), p. 387.
[29] I. Suárez-Ruiz, A. Jiménez, M.J. Iglesias, F. Laggoun-Défarge and J.G. Prado, Energy Fuels 8 (1994), p. 1417.
[30] E. Stach, M.Th. Mackowsky, M. Teichmüller, G.H. Taylor, D. Chandra and R. Teichmüller, Textbook of Coal Petrology (third ed.), Gebrüder Borntraeger, Berlin (1982).
[31] A.C. Raymond and D.G. Murchison, Fuel 70 (1991), p. 155.
[32] M.G. Fowler, T. Gentzis, F. Goodarzi and A.E. Foscolos, Org. Geochem. 17 (1991), p. 805.
[33] M.J. Iglesias, A. Jiménez, F. Laggoun-Défarge and I. Suárez-Ruiz In: B.Q. Li and Z.Y. Liu, Editors, Prospects for Coal Science in the 21st Century, Sanxi Science 6 Technology Press, Taiyuan, PR China (1999), p. 887.
[34] D.W. van Krevelen, Coal, Elsevier (1993).
[35] J. Espitalié, G. Deroo and F. Marquis, Rev. Inst. Fr. Petrol. 40/5 (1985), p. 563 (40/6, 755).
[36] J. Espitalié, G. Deroo and F. Marquis, Rev. Inst. Fr. Petrol. 784 (1986) (4171), p. 73. [37] M.J. Iglesias, M.J. Cuesta and I. Suárez-Ruiz, J. Anal. Appl. Pyrol. 58–59 (2000), p. 255. [38] L. Mansuy, P. Landais and O. Ruau, Energy Fuels 9 (1995), p. 691.
[39] L. Mansuy and P. Landais, Energy Fuels 9 (1995), p. 809. [40] M. Monthioux, Fuel 67 (1988), p. 843.
[41] M. Radke, H. Willsch and M. Teichmüller, Org. Geochem. 15 (1990), p. 539.
[42] (a) The aromatic hydrogen distribution was estimated through the relative intensities of the aromatic bands between 900 and 700 cm−1 (aromatic C–H out-of-plane bending modes). (b) The aromatic (Har) and aliphatic hydrogen (Hal) were deduced from the integrated areas in the 3100–3000 and 3000–2700 cm−1 ranges, respectively. (c) The overall increase in intensity of the infrared spectra for the residues at 300 and 350 °C for TCV and the impregnated vitrinite, respectively, does not allow the semi-quantitative analysis to be performed for the entire range of pyrolysis temperatures. (d) The extremely low intensity of the aliphatic C–H modes in the 3000–2700 cm−1 range does not allow their integration so that accurate values of Hal for the TCV residue at the 500 °C stage cannot be obtained. (e) The Hal data for the non-perhydrous vitrinite correspond to those obtained after chloroform extraction because as previously reported [7] the soluble material affects the extinction coefficients of the aliphatic bands, thereby increasing their intensity.
[43] J.K. Brown, J. Chem. Soc. Lond. (1995), p. 744.
[44] W. Kuehn, R.W. Snyder, A. Davis and P.C. Painter, Fuel 61 (1982), p. 682. [45] F.P. Miknis, D.A. Netzel and R.C. Surdam, Energy Fuels 10 (1996), p. 3.
[46] The data for the TCV series correspond to the residues up to 450 °C because no accurate data for the sample pyrolysed at 500 °C were available.
![Fig. 2. Variation in pore volume during the thermal treatment of TCV and comparison with data reported for pyrolysates derived from the impregnated vitrinite [9]](https://thumb-eu.123doks.com/thumbv2/123doknet/14783186.597532/9.892.235.660.810.1058/variation-thermal-treatment-comparison-reported-pyrolysates-impregnated-vitrinite.webp)