HAL Id: hal-00085821
https://hal.archives-ouvertes.fr/hal-00085821
Submitted on 14 Jul 2006
HAL is a multi-disciplinary open access
archive for the deposit and dissemination of
sci-entific research documents, whether they are
pub-lished or not. The documents may come from
teaching and research institutions in France or
abroad, or from public or private research centers.
L’archive ouverte pluridisciplinaire HAL, est
destinée au dépôt et à la diffusion de documents
scientifiques de niveau recherche, publiés ou non,
émanant des établissements d’enseignement et de
recherche français ou étrangers, des laboratoires
publics ou privés.
Pupil plane optimization for single-mode multiaxial
optical interferometry with a large number of telescopes
Jean-Baptiste Le Bouquin, Eric Tatulli
To cite this version:
Jean-Baptiste Le Bouquin, Eric Tatulli. Pupil plane optimization for single-mode multiaxial optical
interferometry with a large number of telescopes. Monthly Notices of the Royal Astronomical Society,
Oxford University Press (OUP): Policy P - Oxford Open Option A, 2006. �hal-00085821�
ccsd-00085821, version 1 - 14 Jul 2006
Pupil plane optimization for single-mode multiaxial optical
interferometry with a large number of telescopes
J.-B. LeBouquin
1,3⋆and E. Tatulli
2,31European Southern Observatory, Casilla 19001, Santiago 19, Chile 2Osservatorio di Arcetri, L.go E. Fermi, 5, 50125 Firenze, Italia
3Laboratoire d’Astrophysique, Observatoire de Grenoble, 38041 Grenoble, France
Accepted 2006 July 12. Received 2006 July 7; in original form 2006 May 29
ABSTRACT
Incoming and planed optical long baseline interferometers will allow rapid spectro-imaging at high angular resolution. Non-homothetic Fizeau instrument using optical fibers is one of the most promising concept because it combines good sensitivity and high spectral resolution capabilities. However, when increasing the number of input telescopes, one critical issue is the design of the beam recombination scheme, at the heart of the instrument. Extending our previous analysis on the multiaxial ”all-in-one” recombination, where the beams are mixed all together (Tatulli & LeBouquin 2006), we tackle in this paper the possibility of reducing the number of pixels that are coding the fringes by compressing the pupil plane from partially redundant output pupils configuration. Shrinking the number of pixels – which drastically in-creases with the number of recombined telescopes – is indeed a key issue that enables to reach higher limiting magnitude, but also allows to lower the required spectral resolution and fasten the fringes reading process. By means of numerical simulations, we study the performances of existing estimators of the squared visibility with respect to the compression process. We show that, not only the model based estimator lead to better signal to noise ratio (SNR) perfor-mances than the Fourier ones, but above all it is the only one which prevent from introducing baseline mixing biases in the visibilities as the pupil plane compression rate increases. Fur-thermore, we show that moderate compression allows to keep the visibilities SNR unaffected. In the light of these conclusions, we propose an optimized pupil arrangements for 6 and 8 beam recombiners.
Key words: Techniques:interferometric – Methods:data analysis – Instrumenta-tion:interferometers
1 INTRODUCTION
After the first results of COAST (Baldwin et al. 1996; Young et al. 2000), NPOI (Hummel 1998) and IOTA (Monnier et al. 2004b), the next challenge of optical long baseline interferometry is to com-monly perform spectro-imaging of faint sources. From the end of 2005, this technique has moved one step forward with the operating of the AMBER instrument (Petrov et al. 2003), the near-infrared combiner of the Very Large Telescope Interferometer (VLTI, Glin-demann et al. 2003). However, with its 3 beams, it will require sev-eral nights to be able to restore consistent images (Thi´ebaut et al. 2003). Then, huge improvements are contemplated to be accom-plished with second-generation instruments that will use 4, 6 or even 8 telescopes coupled with spectral resolution abilities (Malbet et al. 2004). One critical point in the design is the choice of the beam recombination concept, heart of the instrument.
The interferometric observables are the complex coherence
⋆ E-mail: [email protected]
factors (amplitude and phase) of the fringes formed by each pair of beams (the so-called baselines). They contain the information re-lated to the spatial distribution of the source at high angular resolu-tion. The simplest way to recover all the available information is to mix all the beams together (all-in-one scheme), as their is no need to split and rearrange the beams as in a pairwise design. Besides, it leads to better performances in the photon noise regime, because
all photons are used to create all fringes. Those fringes appear by
modulating the optical path differences between the beams. That can be done temporally (coaxial or Michelson modulation) or spa-tially (multiaxial or Fizeau modulation). Between these two solu-tions, recent studies emphasized the advantages of multiaxial con-cept thanks to less beam-splitters, mirrors and outputs (LeBouquin et al. 2004a).
But to measure the coherence factor of each baseline individ-ually, the geometry of the multiaxial combiner has to be carefully checked. On the detector each pair of pupils produces a fringe pat-tern with a frequency given by their separation. In order to sepa-rate the energy of each fringe pattern in the Fourier plane, the
out-2
J.-B. LeBouquin and E. Tatulli
put pupil configuration should be non-redundant. This necessary condition can be achieved with bi-dimensional or linear arrange-ments. In the first approach, the focal image is fringed in differ-ent directions, while in the second one all fringes are aligned but use different frequencies. Only this last 1-D diffraction pattern can be injected into a slit of spectrograph, opening spectral abilities at medium and large resolutions. It explains why the majority of the projects only consider linearly aligned output pupils, as VITRUV (Malbet et al. 2004), MIRC (Monnier et al. 2004a), MATISSE and VEGA (Mourard, private communication).
From Monte-Carlo simulations, Ribak et al. (1988) derived geometries allowing up to 30 beams to be combined without any redundancy. However, the number of frequencies dramatically in-creases with the number of input beams. For instance, 35 different frequencies are required for 8 beams. Reducing this number has been initially proposed by Vakili & Koechlin (1989), for a visible interferometer in the presence of a fully turbulent image (dispersed fringed speckles). The authors used a completely redundant con-figuration but introduced small optical path differences to differ-ently tilt the fringes in the dispersed image, and thus separate the information. However, to save the spectral resolution abilities, the spectral dimension should be oversampled and the total number of pixels remains the same: the coding is converted from spatial to spectro-spatial. This method has never been used but could prob-ably be explored to combine a large number of telescopes. Never-theless it is clearly out of the scope of this paper, since it requires a global analysis taking into account its technical specificity (high spectral resolution, spectro-spatial coding). To fit with existing and incoming instrumentation, our work focuses on partially redundant output pupils configuration, without using an optical path differ-ence.
In this case, to be able to recover the interferometric quanti-ties, the fringed image pattern should not be blurred by the atmo-spheric turbulence. In other words, the image should be stabilized and not contain moving speckles. Practically, the common way to transform a corrugated input wavefront into a planar and stable output is to spatially filter the beams with single-mode fibers. It also drastically improves the accuracy of the instrument as demon-strated by the FLUOR experiment (Perrin 1997; Coud´e Du Foresto et al. 1998) and theoretical studies (Tatulli et al. 2004). Yet, the average phase difference between the pupils (the so-called piston) should remain constant over the exposure time. This is ensured by freezing the random atmospheric piston with short exposures of few millisecond, or by the help of an external fringe tracker that al-lows longer exposures. However, this is not an issue for our study, since the same frame-to-frame data processing can be applied to both short or long exposures. Finally, the average value (distance to white fringe) and the residual motion (high frequency jitter) of the piston during each exposure will lead to contrast losses that have to be calibrated. Again, this pure multiplicative factor on the fringe amplitude has no incidence in our study.
All these advantages explain why partially redundant
multi-axial combination and spatial filtering is the setup currently used
in the AMBER interferometer. And also why it is a contemplated solution for next-generation instrument. Even so, no studies of the influence of the pupil redundancy on the interferometric quantities and on their estimators have been published. The objective of this work is to fill this lack. In Section 2, we present the description of the single-mode all-in-one multiaxial combination. We clarify the relation between the pupil and the interferogram planes. We ex-plain why and how to reduce the maximum coding frequency of the fringes by compressing the pupil plane. We recall four different
exp(−π) Nfri 1/D Npattern 0 100 200 300 400 0.0 0.5 1.0 1.5 2.D Nfri 2.Npattern+1 exp(−π) 0 20 40 0.0 0.5 1.0 1.5 Intensity Pixels PSD{Intensity} Frequencies Pupils position (xi) Nfri D Pi
Figure 1. Geometrical relations between the image in the focal plane (top),
its power spectral density (PSD, middle), and the output pupil configura-tion (bottom) of a multiaxial all-in-one single mode interferometer. Here is shown a 3-beam combiner when beam 1 and 2 are illuminated with an in-strumental contrast set to 1. When beam 3 is illuminated, two other fringe systems appear (dotted lines in the Fourier space; the corresponding fringes in the image space have not been drawn for a sake of clarity). The displayed geometry is defined by Nf ri= 3, Npattern= 4 and Pi= (0, 1, 3). See text for
a complete explanation of these parameters.
estimators of the squared visibility that can be used in the case of single mode interferometry. In Section 3 these estimators are com-pared in terms of relative performance. We investigate how they are robust with respect to the compression process. Finally section 4 contains applications to incoming project making use of multiaxial all-in-one scheme with an increasing number of recombined beam. Thanks to results derived in previous sections, we propose an opti-mal output pupil configuration for 6- and 8-beam combiners.
This work is the second part of our study of single-mode mul-tiaxial combination for astronomical interferometry. The work pre-sented here makes an intensive use of the formalism and the results presented in the first paper (paper I, Tatulli & LeBouquin 2006).
2 SINGLE MODE MULTIAXIAL COMBINATION
We redefine here only the parameters relevant for this part of the study. For a detailed description of the single-mode multiaxial com-bination, the reader can refer to Section 2 of paper I. The different spatially filtered beams are surimposed in a focal plane, forming a fringed image. The amplitude and phase of this modulation, also called complex visibility, are related to the source intensity distribu-tion at high angular resoludistribu-tion, by the Zernike van Cittert theorem. Strictly speaking the visibility obtained with a fibered interferom-eter is not the source visibility but the so-called modal visibility (M`ege 2003), that we will consider to be our observable.
Due to the spatial filtering, the shape of the image pattern and the fringe frequencies are completely defined by the width and the separation of the output pupils (Fig. 1). We called D the width of
c
the beams in a pupil plane, here defined by the extension of the fiber mode. The fringes are weighted by the diffraction pattern of the fiber mode in the image plane (here Gaussian, dashed line in Fig.1 top). The number of fringes in this pattern (Nf ri) is fixed by
the distance between the output pupils. Npatternis the detector
read-ing window size expressed in unit of the diffraction pattern, that
is Npattern = 1 means half of the lobe of the Gaussian pattern has
been considered. It also correspond to the number of independent frequency points under each peak (Fourier sampling law). Addi-tionally, Piis a non-redundant integer list which fixes the relative
positions of the other pupils and thus of the others peaks. Note that the largest frequency used in the Fourier plane identifies with the largest distance between two pupils. Thus, the position xi of the
pupils i (starting with i = 0 for the first one) can be expressed as:
xi= Pi.Nf ri.D (1)
where Piis the non-redundant integer list:
Pi= (0, 1, 3) (2)
Pi= (0, 1, 4, 6) (3)
for a 3-beam (Eq. 2) and a 4-beam combiner (Eq. 3). With such assumptions, the peaks corresponding to each fringe pattern are equally spaced in the Fourier plane (Fig. 1, middle).
2.1 Pupil plane compression
To separate the Fourier peaks, the distance between the pupils should be a least twice the pupils width (Nf ri>2). When increasing
the number of beam, the non-redundant configuration Pireaches
wide frequency ranges, such as 35 for a 8-beam combiner. Thus the largest distance between two pupils is 2 × 35 = 70 times the pupil width (Eq. 1). Using Npattern>2 to record the whole image pattern,
the number of fringes is 2 × 35 × 2 = 140, and it requires about 2 × 35 × 2 × 4 = 560 pixels to sample them. A the same time, such combiner requires a minimal spectral resolution of about 600, to be sure that the number of fringes in the coherence lenght is larger than the number of recorded fringes. First, reducing the frequency range reduce the number of pixel used to code the signal, and thus the detector noise contribution. Besides, reducing the number of recorded fringe allows to reduce the minimal spectral resolution, when the dispersion is not mandatory by the science case.
The first way to scale down the frequency range is to reduce
Nf ri. It corresponds to a homothety of the pupil and the Fourier
planes without changing the pupil diameter and the peak width. Peaks start to overlap when Nf ri < 2, and the overlapping rate is
similar for all of them. However, it is impossible to have Nf ri <1
since the pupils cannot spatially overlap. As a result this method has limited compression capability. Another solution to perform more efficient compression is to keep the distance between the first and second pupils fixed (i.e the Nf ri parameter) and only rescale the
position of third and further pupils. If we conserve an homothetic scaling of these latter – namely the compression factor ρ – to keep a partial non-redundancy, the pupils positions now follow:
xi= (i + (Pi−i).ρ) . Nf ri.D (4)
The smallest frequency does not shift, and the Fourier plane trans-formation is not perfectly homothetic. Gaps are created with a size of Nf ri, the original space unit between the pupils. Interesting
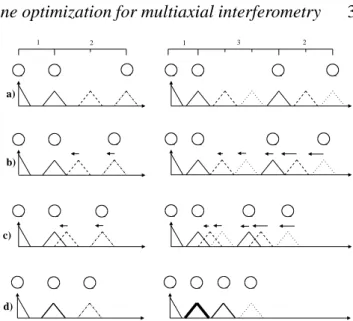
val-ues are displayed on Figure 2 :
a : the pupils and Fourier peaks are at the positions defined by
Eq. 1. 1 2 1 3 2 a) d) c) b)
Figure 2. Superposition of the peak due to a compression of the pupil plane
by Eq. 4 for a 3- and a 4-beam combiner. The Compression Factor is set to
ρ =1, 2/Nf ri, 1/Nf riand 0 (a, b, c and d).
a → b : the Fourier peaks do not overlap each other, the
configu-ration is not compressed.
b → c : the Fourier peaks overlap each other less than a half, the
configuration is slightly compressed.
c → d : the Fourier peaks overlap more than a half of the peak
width, the configuration is strongly compressed.
d : the pupil space is constant, the configuration is fully
redun-dant. In the Fourier plane, the peaks are superposed by group sepa-rated by Nf ri.
Note that this method allows the Fourier plane to be compressed, even if it is impossible to juxtapose the closest pupils, for technical reasons for instance.
2.2 Visibility estimators
There are different ways to recover the individual visibility of each baseline from the recorded image. Before the advent of single mode interferometry, and to overcome the problem of turbulence, Rod-dier & Lena (1984) developed estimators based on Power Spectral Density integration. In paper I, we exposed the formal expressions of expected values and Signal to Noise Ratio (SNR) for this kind of estimators in the framework of filtered multiaxial combiners. In this paper, this method will be called PSD-Integration (Integ).
It is also possible to measure the visibility by considering only the maximum value of the PSD of each peak. The required cali-bration is the same as for PSD-Integration. This estimator was not specifically studied in the previous paper, but it can be calculated with the same formalism with integration limited to only one pixel (the maximum) of the Fourier peak. This method will be called
PSD-Maximum (Max).
By taking more benefit from the deterministic properties of the PSD, the square visibility can be recovered by fitting the PSD shape. The shape has to be previously calibrated by observations of unresolved star or internal light. This estimator was not presented in our previous study. We implemented its theoretical expressions for expected values and SNR and checked them thanks to numerical experiments described in paper I. This method will be called
PSD-Fitting (Fit).
4
J.-B. LeBouquin and E. Tatulli
0.2 0.4 0.6 0.8 1.0 0 50 100 peak # 1 peak # 2 peak # 3 peak # 4 peak # 5 peak # 6 0.2 0.4 0.6 0.8 0.0 0.5 1.0 0.2 0.4 0.6 0.8 0.0 0.5 1.0 : Fit : Int. : Max : P2VM Compression factor < µ 2> Compression factorPeak position and width
: # 1 : # 2 : # 3 : # 4 : # 5 : # 6 : # 1 : # 2 : # 3 : # 4 : # 5 : # 6 Compression factor SNR( µ 2) with p2vm
Figure 4. Left : Positions (thick lines) and supports (filled regions) of the fringe peaks in the Fourier space versus the compression factor. Middle : Square
visibility (µ2) obtained with the different estimators described in Sec. 2.2. Right : SNR on the square visibility of each baseline computed for the model-based estimator normalized with respect to the zero-compression factor value (ρ = 1). The vertical dashed line is for ρ = 1/Nf ri= 0.4.
10+0 10+1 10+2 10+3 10+4 0.2 0.4 0.6 0.8 1.0 10+0 10+1 10+2 10+3 10+4 : Fit : Integ : Max
nb. of photon per pixel
SNR / SNR
p2vm
Npattern = 2
nb. of photon per pixel Npattern = 6
Figure 3. Ratio between the SNR of the PSD-based estimators and the SNR
of the model-based one, as a function of the number of photon per pixel in the interferogram. The source visibility is set to µ = 0.5. Detector noise is σ = 15e−/pix. The Fourier peaks are fully separated (N
f ri = 2.5 and
no compression). The curves are plotted for a narrow and a large detector reading window (left and right).
the visibilities can also be recovered by fitting the data. The fit can be identically done in the direct plane (fringe fit) or in the Fourier plane (complex Fourier transform fit). It can be formally expressed as a matricial relation between the recorded values on the detector and the complex visibility of each baseline: the so-called Pixel To
Visibility Matrix (P2VM). The visibility amplitudes and phases are
recovered in the same inversion process. If no fringe tracking unit is available, the phase quantity is stochastic from frame to frame and is meaningless. It is ignored by averaging the square visibility instead of the complex one. As a main difference with the PSD-based algorithms presented above (Integ, Max and Fit), this square operation is done after the information of the baselines have been separated. The calibration requires to record the instrumental fringe shapes with a good accuracy. The reader can refer to the AMBER data processing method for which such a model-based algorithm is currently used (Millour et al. 2004).
3 NUMERICAL EXPERIMENT
As far as an astronomer is concerned, the properties of interest when dealing with different estimators are the relative accuracy per-formance, the relative bias on the expected value and their depen-dencies with the instrumental parameters.
3.1 Estimator relative performances without compression
Figure 3 illustrates the performance of the PSD-based estimators compared to the model-based one in different noise regimes, with-out compression, and for two different detector reading windows
(Npattern). The source visibility is arbitrarily set to µ = 0.5 and
the detector noise is σ = 15e−/pix. The model-based estimator
al-ways presents better SNR, especially in the strong photon-rich and photon-poor domains. The PSD-based estimators follow more or less the same curves for a small detector reading window. How-ever, when increasing the number of independent points over the fringe frequencies (Npattern >2), the PSD-maximum shows worse
performance, because it does not take into account the whole avail-able information. At least, they all reach a similar asymptote in photon-noise limit, from where their SNR is about 0.6 times the model-based one. This asymptote does not depend on the instru-mental configuration but only function on the source visibility.
In paper I, we have mentioned the advantage of model-based estimator versus PSD-integration, especially for unresolved sources with high visibility. Showing the computations presented here we conclude that this advantage can be extended over all the PSD-based estimators without exception. It tends to prove that a first-order estimation systematically drive a better – or at worst identical – performance than quadratic one.
3.2 Estimator robustness to compression
To compare the estimator relative robustness to compression, we compute the recovered visibility amplitudes for a large range of compression factor. The initial setup is the same than in Sec. 3.1 (4-beams, Nf ri = 2.5, Npattern = 6, and pupil positions given by
Eq. 3). For the sake of the clarity of Figure 4, the input visibili-ties have been chosen arbitrarily different, and all the phases are set to zero. It has absolutely no incidence on the results, that have been validated with various set of input parameters (combiner ge-ometry, fringe visibilities and phases). Results are displayed in Fig-ure 4, with a compression factor ranging from 1 to 0.1. As soon as peaks overlap, PSD-integration and PSD-fit rapidly fail to recover to visibility. PSD-maximum only fails when peaks strongly overlap (ρ 6 0.4). Besides, the model-based estimation is never biased even when the compression factor reaches 0.1.
The bias in the estimated visibility can be explained by mix-ing of information between correspondmix-ing peaks when they start to
c
overlap. This blend is due to the coherent sum of the two interfero-grams under the overlapped frequencies. Because the input phases and optical path delays are arbitrarily zero, the asymptotic square visibility recovered is the square average of the two corresponding “single” visibilities, as shown in the right asymptotes of Fig. 4. In a general way, it depends on both the visibilities and phases. Such a complex sum prevents from a simple calibration of this effect. The only solution is to previously calibrate the complex shape of each individual peak and then to inverse both the amplitudes and the phases at the same time. Doing-so one has just re-invented the model-based estimator in the Fourier space, and it explains why this last estimator is never biased.
3.3 Signal-to-Noise Ratio versus compression
We now focus on the model-based estimator since we have shown that this latter is the only one able to retrieve unbiased interferomet-ric quantities even if the pupil plane is compressed. Formal expres-sions of the SNR computed in paper I remain valid for all compres-sion factors. Computations give similar results in both photon noise and detector noise regime. We present here only photon-rich com-putations. The instrumental setup used is the same as in Sec. 3.2. Remember that it has been chosen for illustration purpose only and that we checked the results with various combiner configurations.
Right sub-panels of Fig. 4 shows the results, after normaliza-tion of the SNR by the value obtained without compression. Three different slopes can be distinguished :
• Peak #6 never overlaps. Its SNR remains constant.
• Peaks #4 and #5 interact with one neighbor. Their SNR keep unchanged when peaks slightly overlap but rapidly decrease when peaks strongly overlap.
• Peak #2 interact with its two neighbors. Its SNR keeps un-changed for a slight overlap but presents the more abrupt decrease when peaks strongly overlap.
Slopes related to peaks #1 and #3 can be explained as a combina-tion of the latter. They start with 2-peak interaccombina-tions (each of them with a side of peak #2). So their SNR follow the curve of peaks #4 and #5. Then they meet together over peak #2 and begin also to be engaged in a 3-peak interaction. Their SNR reach the curve related to peak #2.
The expression of model-based estimator as a matrix can help to understand these results. Each complex visibility (one per base-line) corresponds to one line of this matrix. When peaks overlap, corresponding lines begin more and more similar, and thus singu-lar, which mathematically reduces the accuracy of the inversion. From this study, we conclude that – whatever the initial peak po-sition and the number of neighbors – the SNR is unaffected by a slight overlap but goes down rapidly for a strong one. So compres-sion factor of 1/Nf rican be applied to any configuration without
damaging the performance, whatever the initial Nf riparameter and
the noise regime.
3.4 Remarks
In this section, the presented computations have been done with a Gaussian interferogram shape, which is the Fourier Transform of a beam filtered by a Gaussian mode. Strictly speaking, a fiber mode is purely Gaussian only if the profile of the refraction index is a Gaussian function too. However, it gives a good approximation in general with step-index fibers or waveguides. All the results have
been also checked with Bessel interferogram envelop (correspond-ing to circular pupils), and lead to same conclusions. However, one should remember that turbulent beams (not perfectly corrected by adaptive optics or not spatially filtered) will lead to fringes that can-not be fitted by a first-order estimator. Besides, the total number of pixels remains constant in our computations, although it becomes possible to reduce it when the Fourier plane is compressed (Shan-non sampling is relaxed). We have tried to optimize the sampling rate for each compression factor, but it does not change the results.
4 APPLICATION TO 6- AND 8- BEAM COMBINERS
For more than 4 beams, it is impossible to theoretically determine the best non-redundant pupil configuration Piwhich minimizes the
maximum frequency used. This well-known problem can only be solved by “brute force” methods, and non-redundant integer lists have been obtained for a large number of telescopes (Ribak et al. 1988), such as :
Pi= (0, 1, 4, 10, 12, 17) (5)
Pi= (0, 1, 8, 20, 22, 25, 31, 35) (6)
for 6 and 8 beam respectively. The maximum of Piis larger than
the number of baselines, even if the configuration is optimized. As a consequence, it leaves gaps in the frequency space. To compress the Fourier plane, we applied Eq. 4 on the 6-beam and 8-beam con-figurations. Surprisingly, some peaks fully overlap before the com-pression factor goes to zero. So we expected that some worse start-ing Pi configuration (with more gaps) could be more compressed,
and finally provide smaller frequency range.
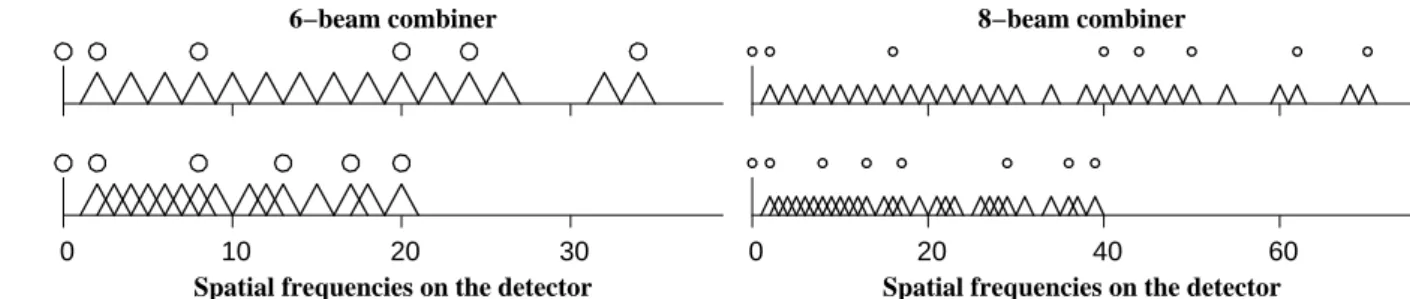
To test it, we directly introduced the minimum allowed over-lap rate in the “brute force” optimization algorithm as a new user-defined parameter (ρmin). Fig. 5 shows the results with no
compres-sion (top, corresponding to Eq. 5 and 6) and with the maximum overlap rate allowed by our study (bottom, ρmin = 1/Nf ri) for a
6- and 8-beam combiner. There is no simple transformation be-tween the best pupil configurations with and without compression. We infer that it is impossible to found the best compressed con-figuration from the best un-compressed one. Empirically, we re-mark that the compact solution leaves more gaps in the frequency space which are over-compensated by the compression. As a con-sequence, the maximum frequency is not multiplied by a factor
ρmin = 1/Nf ri = 0.5. We only reach a compression of ∼ 0.58 for
the 6-beam combiner and ∼ 0.55 for the 8-beam combiner.
5 CONCLUSION
In this paper we have chosen to focus on multiaxial single mode in-terferometry concept because it is one of the most promising solu-tion for future spectro-imaging interferometers with a large number of telescopes (LeBouquin et al. 2004a). Also, it is currently used in the AMBER instrument. Based on this specific recombination scheme, we have proposed a simple method by compressing the output pupil plane with keeping a partial non-redundancy condi-tion. We then have recalled the definition of four different visibility estimators that can be classified in two types: the estimators that make use of the Power Spectral Density of the interferogram and the estimator based on the model fitting of the interferogram.
First extending our analysis of paper I, we have shown that without compression,the model-based estimators drives to better
6
J.-B. LeBouquin and E. Tatulli
0 10 20 30 0 20 40 60
Spatial frequencies on the detector Spatial frequencies on the detector
ρm
= 1
ρm
= 0.5
6−beam combiner 8−beam combiner
Figure 5. Results of plane optimization for a 6-beam (left) and 8-beam (right) combiner. The output pupil configuration and the Fourier plane are represented
at the same scale (autocorrelation relation). The pupil positions are computed for a Compression Factor of ρ = 1 (top) and ρ = 0.5 (bottom). The minimum distance between the pupils is set to twice the pupils width (Nf ri= 2). The frequency range is reduced by a factor 0.58 and 0.55 in the 6- and 8-beam case
respectively.
performances than all PSD-based, whatever the noise regime (de-tector or photon noise) and the instrumental setup. This tends to prove that a first-order estimation systematically drive a better per-formance than quadratic one. Then we have analyzed the effects of the compression on these estimators. We have demonstrated that a model-based estimator is as well the suitable algorithm to deal with compression. Indeed, by first separating the baseline complex vis-ibilities before taking the modulus, the method prevents informa-tion mixing between the baselines that leads to bias the visibility. Yet, the compression reduce the Signal to Noise Ratio because the matrix used in the inversion process becomes more and more sin-gular. However, the accuracy on the visibilities is not dramatically damaged before the peak maximum reaches the edge of its close neighbor, that we have called a slight overlap.
As regards to the existing AMBER instrument, this study al-lows us to claim that the model-based estimator (the so-called P2VM, Millour et al. 2004) is the suitable algorithm, and that the pupil overlap rate used (slight overlap) only reduces the SNR by few percents.
As regards to future instruments dealing with a larger number of input beams, we propose to use this overlapping rate to minimize the required frequency range. Nonetheless, we have shown that the maximum frequency can be multiplied by a factor smaller than 0.6. Such an optimization of the output pupil configuration has impor-tant consequences. First, it reduces the number of pixel per spec-tral channel, leading to a smaller contribution of the detector noise and a better limiting magnitude. Secondly it reduces the minimum required spectral resolution, and thus increases again the limiting magnitude when dispersion is not mandatory by the science case. At the same time, by reducing the number of required pixels and/or spectral channels, it increases the reading speed, which is an im-portant parameter if no fringe tracking unit is available.
From the technical point of view, Integrated Optics (IO) offers promising solutions to realize a multiaxial single mode combiner. This technology has been proved with both laboratory and sky ex-periments (Berger et al. 2001; LeBouquin et al. 2004b), and mul-tiaxial combiners have already been designed (Berger et al. 2000). The size of the chip is directly related to the physical space between the output pupils. Since losses are mainly due to linear propaga-tion in the waveguides, reducing the required distance between the beams, as presented in this work, will lead to a better global ef-ficiency. The compactness of the planar optical component allows one to combine many beams in the same chip, which drastically re-duces the instability and the required alignments. The observational strategies (number of baselines, wavelength...) can be adapted to the object thanks to the plug and play ability of IO combiners.
Fi-nally, output beams of the planar component can act as the input slit of a spectrograph, avoiding complex anamorphic optics.
ACKNOWLEDGMENTS
The authors want to warmly thank Florentin Milour, Karine Per-raut, Jean-Philippe Berger and Fabien Malbet for their interesting remarks and helps. We are grateful for the valuable comments by the referee which helped to improve this article. All the calculations and graphics were performed with the freeware Yorick1.
REFERENCES
Baldwin, J. E., Beckett, M. G., Boysen, R. C., et al. 1996, Astron. & Astrophys., 306, L13+
Berger, J., Benech, P., Schanen-Duport, I., et al. 2000, in Proc. SPIE Vol. 4006, p. 986-995, Interferometry in Optical Astron-omy, Pierre J. Lena; Andreas Quirrenbach; Eds., 986–995 Berger, J. P., Haguenauer, P., Kern, P., et al. 2001, Astron. &
As-trophys., 376, L31
Coud´e Du Foresto, V., Perrin, G., Ruilier, C., et al. 1998, in Proc. SPIE Vol. 3350, p. 856-863, Astronomical Interferometry, Robert D. Reasenberg; Ed., 856–863
Glindemann, A., Algomedo, J., Amestica, R., et al. 2003, in Inter-ferometry for Optical Astronomy II. Edited by Wesley A. Traub. Proceedings of the SPIE, Volume 4838, pp. 89-100 (2003)., 89– 100
Hummel, C. A. 1998, in Proc. SPIE Vol. 3350, p. 483-492, As-tronomical Interferometry, Robert D. Reasenberg; Ed., ed. R. D. Reasenberg, 483–492
LeBouquin, J.-B., Berger, J., Labeye, P., et al. 2004a, in Proceed-ings of SPIE Volume 5491. Edited by Wesley A. Traub., 1362–+ LeBouquin, J.-B., Rousselet-Perraut, K., Kern, P., et al. 2004b,
Astron. & Astrophys., 424, 719
Malbet, F., Berger, J., Kern, P. Y., et al. 2004, in New Frontiers in Stellar Interferometry, Proceedings of SPIE Volume 5491. Edited by Wesley A. Traub. Bellingham, WA: The International Society for Optical Engineering, 2004., p.439, 439–+
M`ege, P. 2003, PhD thesis, Universit´e Joseph Fourier de Grenoble Millour, F., Tatulli, E., Chelli, A., et al. 2004, in New Frontiers in Stellar Interferometry. Edited by Wesley A., Traub, Proceedings of the SPIE, Volume 5491, 1222–1229
1 http://yorick.sourceforge.net/index.php
c
Monnier, J. D., Berger, J.-P., Millan-Gabet, R., & Ten Brumme-laar, T. A. 2004a, in New Frontiers in Stellar Interferometry, Pro-ceedings of SPIE Volume 5491. Edited by Wesley A. Traub. Bellingham, WA: The International Society for Optical Engi-neering, 2004., p.1370, 1370–+
Monnier, J. D., Traub, W. A., Schloerb, F. P., et al. 2004b, Astro-physical Journal, Letters, 602, L57
Perrin, G. 1997, Astronomy and Astrophysics, Supplement, 121, 553
Petrov, R. G., Malbet, F., Weigelt, G., et al. 2003, in Interferome-try for Optical Astronomy II. Edited by Wesley A. Traub . Pro-ceedings of the SPIE, Volume 4838, pp. 924-933 (2003)., 924– 933
Ribak, E. N., Hochberg, E. B., Page, N. A., Synnott, S. P., & Breckinridge, J. B. 1988, in NOAO-ESO Conference on High-Resolution Imaging by Interferometry: Ground-Based In-terferometry at Visible and Infrared Wavelengths, Garching bei M¨unchen, Germany, Mar. 15-18, 1988. Edited by F. Merkle, ESO Conference and Workshop Oroceedings No. 29, p.1105, 1988, 1105–+
Roddier, F. & Lena, P. 1984, Journal of Optics, 15, 363
Tatulli, E. & LeBouquin, J.-B. 2006, Mon. Not. of the Royal As-tron. Soc., 368, 1159
Tatulli, E., M`ege, P., & Chelli, A. 2004, Astron. & Astrophys., 418, 1179
Thi´ebaut, E., Garcia, P. J. V., & Foy, R. 2003, Astrophysics and Space Science, 286, 171
Vakili, F. & Koechlin, L. 1989, in New technologies for astron-omy; Proceedings of the Meeting, Paris, France, Apr. 25, 26, 1989 (A90-37976 16-89). Bellingham, WA, Society of Photo-Optical Instrumentation Engineers, 1989, p. 109-116., 109–116 Young, J. S., Baldwin, J. E., Boysen, R. C., et al. 2000, Mon. Not.
of the Royal Astron. Soc., 315, 635
This paper has been typeset from a TEX/ LATEX file prepared by the